
Abstract
Abstract
Reproductive cloning by somatic cell nuclear transfer (SCNT) is a valuable method to propagate service dogs with desirable traits because of higher selection rates in cloned dogs. However, incomplete reprogramming is a major barrier to SCNT, and the assessment of reprogramming is limited to preimplantation embryos and tissues from dead and/or adult tissue. Thus, lifelong monitoring in SCNT dogs can be useful to evaluate the SCNT service dogs for propagation. We applied microarray and qRT-PCR to profile of mRNA and miRNA in whole blood samples collected from four cloned dogs (S), three age-matched control dogs (A), and a donor dog (D). In the analysis of differentially expressed genes in S-A, A-D, and S-D pairs, most genomes were completely reprogrammed and rejuvenated in the cloned offspring. However, several RNAs were differentially expressed. Interestingly, the altered genes are associated with aging and senescence. Furthermore, we identified potential biomarkers such as mirR-223 (NFIB; CLIC4), miRN-494 (ARHGEF12), miR-106b (PPP1R3B; CC2D1A), miR-20a (CC2D1A; PPP1R3B), miR-30e (IGJ; HIRA), and miR-19a (TNRC6A) by miRNA-target mRNA pairing for monitoring rejuvenation, aging/senescence, and reprogramming in cloned dogs. The novel comparative transcriptomic information about SCNT and age-matched dogs can be used to assess the lifelong health of cloned dogs and to facilitate the selection of training animals with minimal invasive procedures.
Introduction
Viable offspring have been obtained by somatic cell nuclear transfer (SCNT) from a range of species since the first mammal, Dolly the sheep, was cloned. However, the efficiency of SCNT is still low and the application is limited (Campbell et al., 2007). Nevertheless, SCNT remains a unique tool for the preservation of endangered species and production of elite animals (Williams et al., 2006).
In particular, service dogs are widely used for security, rescue, and guidance, but extensive training periods and cost are required to produce animals with suitable and desirable traits. Notably, the selection rate for service dogs in the cloned puppies was higher than that of naturally bred puppies, suggesting that SCNT is a useful technique to propagate service dogs with higher performance traits (Choi et al., 2014; Oh et al., 2016).
Almost identical sequences in a whole genome comparison study using donor and cloned dogs support the possibility of the propagation (Kim et al., 2012). However, several fundamental and methodological issues remain unresolved in this process. For example, faithful expression of genes such as imprinted genes and the epigenetic alteration of gene expression across the animal lifespan remain to be thoroughly investigated, but most available data related to reprogramming are limited to gene expression profiling of SCNT embryos/tissue and histological characterization of the placenta/fetus (Bai et al., 2016; Bourc'his et al., 2001; Chavatte-Palmer et al., 2012; Li et al., 2014; Matoba et al., 2014; Tian et al., 2009).
Alternatively, the use of circulating nucleic acids in plasma or serum (CNAPS) is widely accepted as a noninvasive tool for early diagnosis, prognosis, and treatment monitoring in cancer (Deng et al., 2010; Schwarzenbach et al., 2011). CNAPS contains circulating DNA/RNA, mRNA, micro RNA (miRNA), and mitochondrial DNA that are released into the blood by leukocyte breakdown, bacteria breakdown, viruses, cell/tissue necrosis, cell apoptosis, and cellular release of extracellular vesicles including exosomes (Gahan, 2010). In addition, fetal circulating nucleic acids including cell-free fetal DNA/RNA (cffDNA/RNA) are used as fetal epigenetic markers and to determine fetal sex and aneuploidy for noninvasive prenatal diagnosis (Banerjee and Misra, 2013; Gahan, 2013).
Given that the efficacy of canine SCNT remains low, the production of suitable service animals is difficult in natural breeding systems, and SCNT dogs show higher examination passing rates, it is important to establish effective methods to examine the expression profiles of inherited special genomes before the initiation of extensive training and also to monitor the elite service dogs over long periods. Here, we employed mRNA and miRNA expression profiling from whole blood (which circulates throughout the body) and pairwise comparison to identify potential biomarkers in the elite sniffer dogs produced by SCNT.
Materials and Methods
Experimental design and sample collection
All animal operating procedures used in this study were approved and performed under the guidelines of the National Institute of Animal Science Animal Care and Experimentation Committee in the Republic of Korea (2013-045). We produced four genetically identical male Labrador retriever dogs by SCNT as described in our previous study (Kim et al., 2013).
Briefly, donor adult fibroblast cells isolated from an ear skin biopsy of a 7-year-old Labrador retriever male government working dog were used for SCNT. Blood was collected from these four genetically identical SCNT dogs at 2 years after birth and from a 9-year-old somatic cell donor dog. The donor dog and four SCNT dogs have served in the Korean national police agency. The blood was also collected from natural breed 2-year-old healthy male Labrador retriever dogs as an age-matched control. The blood samples were transferred into a PAXgene Blood RNA Tube (PreAnalytiX GmbH, Hombrechtikon, Switzerland) and incubated for 6 hours at room temperature and stored at −70°.
Gene expression analysis
The extraction of mRNA using the PAXgene 96 Blood RNA Kit (Qiagen, Valencia, CA) and microRNA with the PAXgene Blood miRNA Kit (Qiagen) was conducted according to PAXGene manufacturer recommendation. RNA labeling and hybridization were performed by using the Agilent One-Color Microarray-Based Gene Expression Analysis protocol (Agilent Technology, Santa Clara, CA, V 6.5, 2010).
Briefly, 100 ng total RNA from each sample was linearly amplified and labeled with Cy3-dCTP. The labeled cRNAs were hybridized to the Agilent SurePrint HD Canine GE 4X 44K Microarrays. The hybridized array was immediately scanned using an Agilent Microarray Scanner D. For miRNA array, the miRNA Microarray System with miRNA complete labeling and hybridization kit (Agilent) was used according to the manufacturer's recommended protocol. Briefly, 100 ng of each total RNA sample was labeled with pCp-Cy3 and was then hybridized with the Agilent SurePrint HD Custom miRNA Canine 8 × 15K Microarrays, and the arrays were scanned on an Agilent Technologies G4900DA SureScan scanner using 3 μm resolution.
Raw data were extracted using Agilent Feature Extraction Software (v11.0.1.1). The raw data for the same gene were then summarized automatically by the Agilent feature extraction protocol to generate a raw data text file, providing expression data for each gene probed on the array. For microarray analysis, statistical significance of the expression data was determined using fold change, with the null hypothesis being that no difference existed among the two groups. Hierarchical cluster analysis was performed using complete linkage and Euclidean distance as a measure of similarity. All data analysis and visualization of differentially expressed genes (DEGs) were conducted using R 3.1.2.
For the miRNA arrays, the comparative analysis between test and control samples was carried out using fold change and independent t-tests with the null hypothesis being that no difference existed among the two groups. Hierarchical cluster analysis was performed using complete linkage and Euclidean distance as a measure of similarity. All data analysis and visualization of differentially expressed miRNA were conducted using R 3.1.2.
Real-time RT-PCR array
The expression of 84 genes associated with senescence including pathways, initiators, and responses was evaluated by using a customized canine RT2 Profiler PCR Array (SABiosciences, Qiagen, Frederick, MD) according to manufacturer's instructions. In brief, total RNA was isolated from each whole blood sample (four controls, four clones, and one donor, respectively) using the PAXgene® Blood RNA kit, and cDNA was synthesized from 450 ng total RNA using an RT2 PCR Array First-Strand Kit (Qiagen). PCR array analyses were performed in 96-well plates on a Stepone Plus Real-Time PCR system (Applied Biosystems, Foster City, CA). The gene expression levels were normalized to ACTB, B2M, HPRT1, and RPLP1 and were imported into an Excel database. The data were analyzed using Web-based RT2 profiler PCR Array data analysis software V3.5 (Qiagen).
Bioinformatics analysis
Genes that were upregulated or downregulated ≥2-fold in multiple comparisons were selected and sorted using Venn diagrams using a web-tool, VENNPLEX for bioinformatics analysis (Cai et al., 2013). To identify and analyze the enriched biological processes and functional enrichment for a set of genes, GO and KEGG pathway enrichment analysis were performed using a web-based tool, DAVID Bioinformatics Resources 6.7, NIAID/NIH (https://david.ncifcrf.gov/summary.jsp) (Huang et al., 2008).
The results were obtained by the default condition (a modified Fisher's exact p-value, EASE score ≤0.10). For further pathway analysis of the biological and molecular networks underlying reprogramming differences in an age-matched control or clone dogs groups compared with a donor dog group, the web-based Ingenuity Pathway Analysis (IPA) tool was used (IPA version 01–04; Ingenuity Systems, Redwood City, CA, www.ingenuity.com). GeneMANIA was used for a small set of genes to predict genetic interactions, physical interaction, and function based on a human database (application version 3.1.2.8; http://genemania.org/) (Warde-Farley et al., 2010). miRDB, based on the target prediction algorithm MirTarget (www.mirdb.org/miRDB/index.html), was used for miRNA target prediction and functional annotations.
Results
Comparison of mRNA expression profiles of cloned, donor, and control dogs
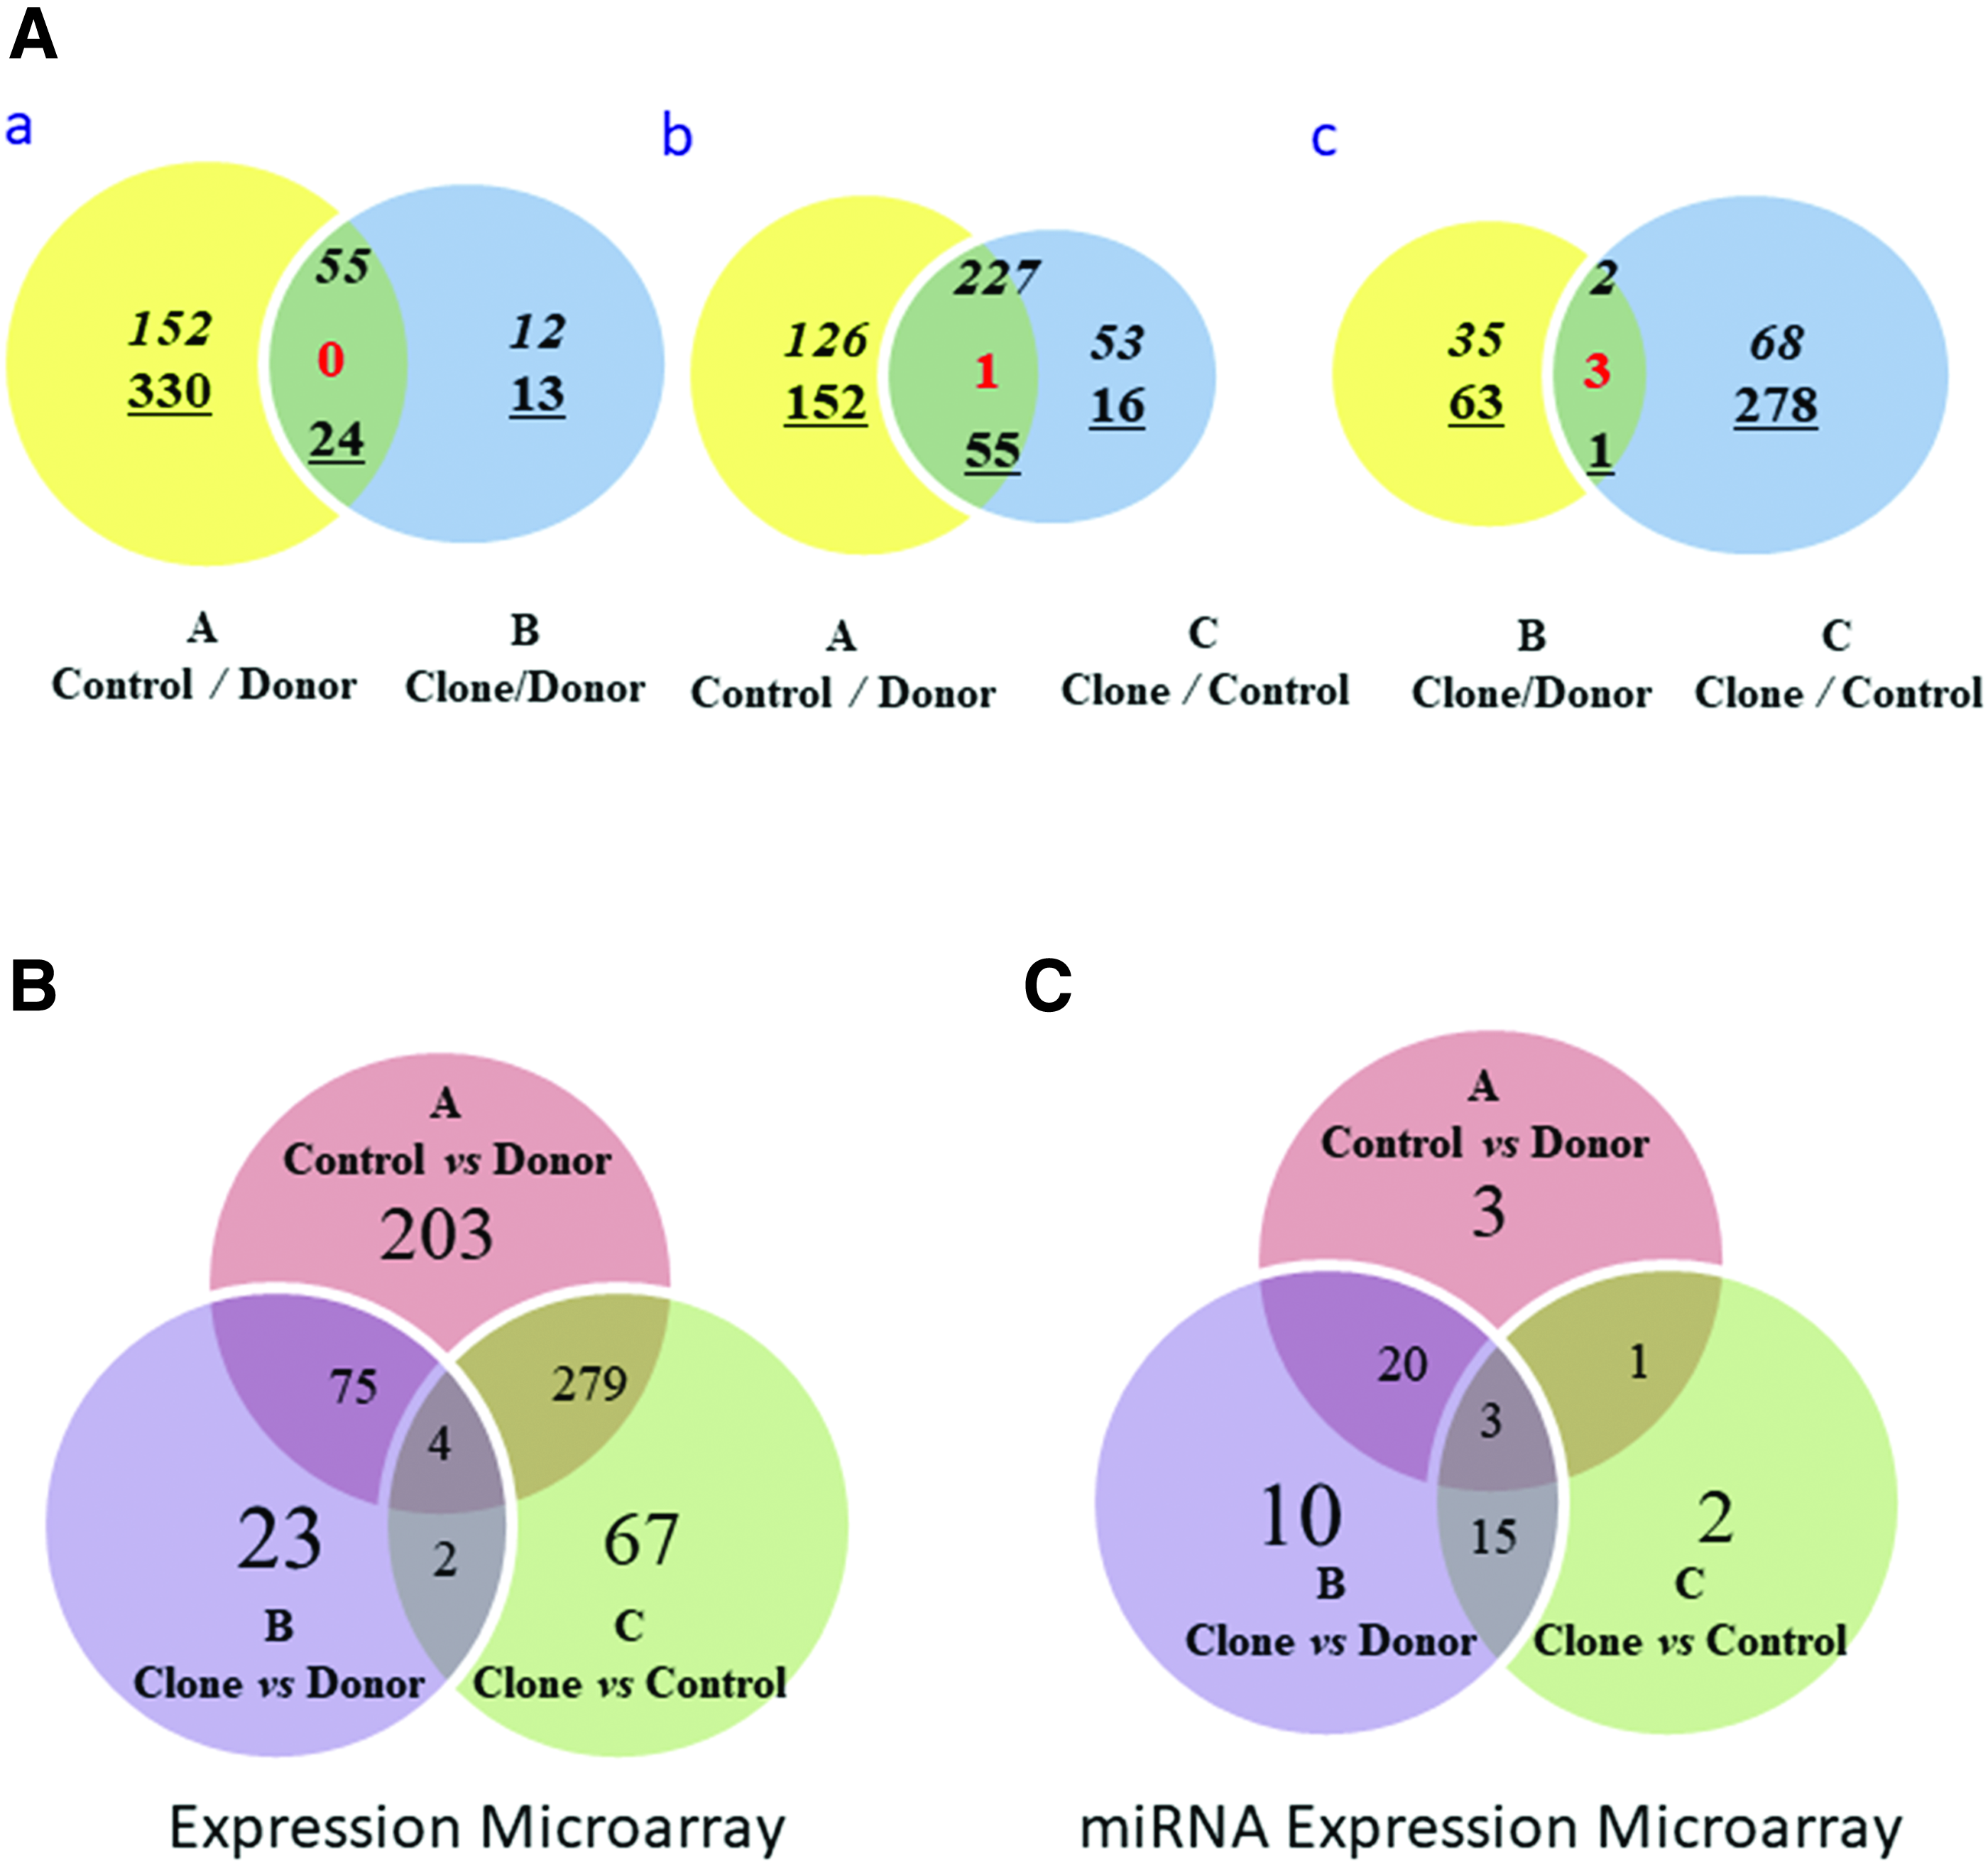
In this study, we used three groups (age-matched control, donor, and clone) with different samples sizes and analyzed genes that differentially expressed in the three pairwise comparisons; aging comparison set (A) age-matched control (n = 3) and a donor dog used for cloning (different ages and genomes), accurate reprogramming comparison (B) cloned dog (n = 4) and a donor dog (the same genome, but different age), and rejuvenating reprogramming efficiency (C) cloned dogs and age-matched controls (the same ages but different production method) as listed in Table 1. We identified 561, 104, and 352 DEGs with a greater than twofold change (upregulation or downregulation) in aging, reprogramming, and rejuvenating comparison set, respectively (Fig. 1A, B and Supplementary Tables S1,S2,S3). Interestingly, of these altered genes, many genes were found in other comparison set. For example, 75.9% (79/104) in reprogramming (B) and 80.3% (283/352) in rejuvenating (C) were listed in aging comparison (A), and 63.85% (358/561) were found in either B or C.
Differentially expressed genes and distribution in cloned, age-matched control, and donor dogs.
Features of Analyzed Sets
G, variants from donor genome; G′, variants from donor genome via SCNT; g, variants from control genome; Y, variants from young age; Y′, variants from young age via SCNT; O, variants from old age.
Next, we evaluated the gene functions of the DEGs specifically identified for each group to assess gene ontology (GO) biological processes, GO cellular components, GO molecular functions, and Kyoto Encyclopedia of Genes and Genome (KEGG) pathways using the web-based tool DAVID. In aging comparison (A; Table 2), the GO terms of their biological processes and KEGG pathways included “defense response” and “response to bacterium,” and “porphyrin and chlorophyll metabolism” and “cell cycle,” respectively (p < 0.005).
Different Expressed Genes Between Age-Matched Control and a Donor Dog (Aging Comparison; A)
In reprogramming comparison (B; Table 2), which may reflect possible effects of aging and reprogramming via SCNT, we characterized DEGs by GO and KEGG pathway enrichment analyses using DAVID. Notably, the most significantly enriched pathway between the cloned and age-matched control groups was “cell cycle” (Table 3 and Supplementary Table S2). Among the DEGs between cloned and donor dogs, only the “cell cycle” pathway was significantly different (p = 0.033, Table 3; and Supplementary Table S2). In rejuvenating reprogramming comparison (C), only one KEGG pathway, “porphyrin and chlorophyll metabolism” was identified (p < 0.05, Table 4).
Different Expressed Genes Between Clone Dogs and a Donor Dog (Faithful Reprogramming Comparison; B)
Different Expressed Genes Between Clone and Age-Matched Control Dogs (Rejuvenating Reprogramming Comparisons; C)
We subsequently generated Venn diagrams to identify the common and exclusively DEGs for each comparison and understand the relationship between comparison sets (Table 1). The Venn diagram showed that the 79 overlapping DEGs between aging and faithful reprogramming (A and B). As seen in Table 1 (multiple set comparison), the common altered genes may be derived from donor genome variant, different ages, and incomplete rejuvenating by cloning (GOY/Y′). In the A∩B, 55 were elevated and 24 were repressed in young dogs (clones and age-matched control dogs), and four genes including IGHAC, LOC612106, MGP, and TXNDC5 were detected in A∩B∩C (contra-regulated) (Fig. 1B).
As DAVID analysis showed that cell cycle (cfa04110) was observed in both aging and reprogramming comparisons (A and B), cfa05200:Pathways in cancer and cfa04110:Cell cycle were detected in the 79 overlapping genes. In particular, among the 55 upregulated genes, the cell cycle-associated genes CCNE1, CCNB2, and CCNA2 were upregulated in younger dogs (the age-matched controls and cloned dogs) compared with an old donor dog. In the 24 downregulated genes, lipid metabolism and basal cell carcinoma pathways were relatively enriched, although statistically not significant (Table 5).
Analysis of Common Genes Between Set A and B (A∩B)
To gain a better understanding of the functions and disease associations of the DEGs among the 79 overlapping genes, we carried out a gene annotation analysis by IPA. The top five diseases and biofunctions of the 79 overlapping genes are listed in Supplementary Figure S1. We observed a high statistical enrichment of genes involved in the cell cycle, cellular assembly and organization, DNA replication, recombination and repair, cellular growth and proliferation, and cancer (Supplementary Fig. S2).
To understand the interaction of the DEGs in the group of 79 overlapping genes, we next performed gene network analysis by using IPA. In total, five networks were formed and a combined network (1 and 3) was generated to investigate the interactions of molecules in the network (Supplementary Fig. S3). Most upregulated genes were involved in the molecular/cellular functional pathway related to cell cycle and cellular development, whereas downregulated genes were associated with cell-to-cell signaling and interaction (Table 6). We also analyzed the DEGs between aging (A) and rejuvenating reprogramming (C) that may reflect variation from different genome and young age (
Top Scoring Functions and Genes from Ingenuity Pathway Analysis
Boldface indicates 79 overlapping genes.
Enrichment analysis of GO terms showed that the upregulated genes might be functionally associated with “porphyrin and chlorophyll metabolism” and” defense response to bacterium,” and the downregulated genes might relate to “apical part of the cell” and “metal ion binding” as seen in the rejuvenating reprogramming (C; Supplementary Table S3). Among the overlapping genes between faithful and rejuvenating reprogramming (B and C), reflecting incomplete reprogramming (
Analysis of circulating miRNA expression profiles of cloned, donor, and control dogs
The miRNA expression profiles of age-matched control, clone, and donor dogs were obtained through Agilent miRNA expression microarray analysis. We detected ∼100 miRNAs from each sample and selected 27, 48, and 21 miRNAs from aging (A), faithful reprogramming (B), and rejuvenating reprogramming (C), respectively. The selected miRNAs were changed over twofold (Supplementary Tables S4,S5,S6). We identified 23, 18, and 4 overlapping miRNA between two different multiple comparison (A∩B, B∩C, and A∩C), and 3 shared miRNAs in A∩B∩C (Fig. 1C).
In particular, we found age/cellular senescence-related miRNAs such as miR-181a, miR-191, miRNA-23a, miRNA-19b, and miRNA-194 among the 18 common miRNAs between B and C that could be attributed to the alteration of genome expression via SCNT (Table 1). To screen out miRNAs that are potential molecular markers for the long-term health or other factors of cloned dogs, and to predict their function, we uploaded each list of differentially expressed miRNAs (DEMs) to the miRNA database miRDB and generated each list of predicted gene targets using the target prediction algorithm, MirTarget (Wang, 2016). Finally, we identified 7339, 14529, and 6180 predicted gene targets in each comparison A, B, and C, respectively (Fig. 2 and Supplementary Table S7).
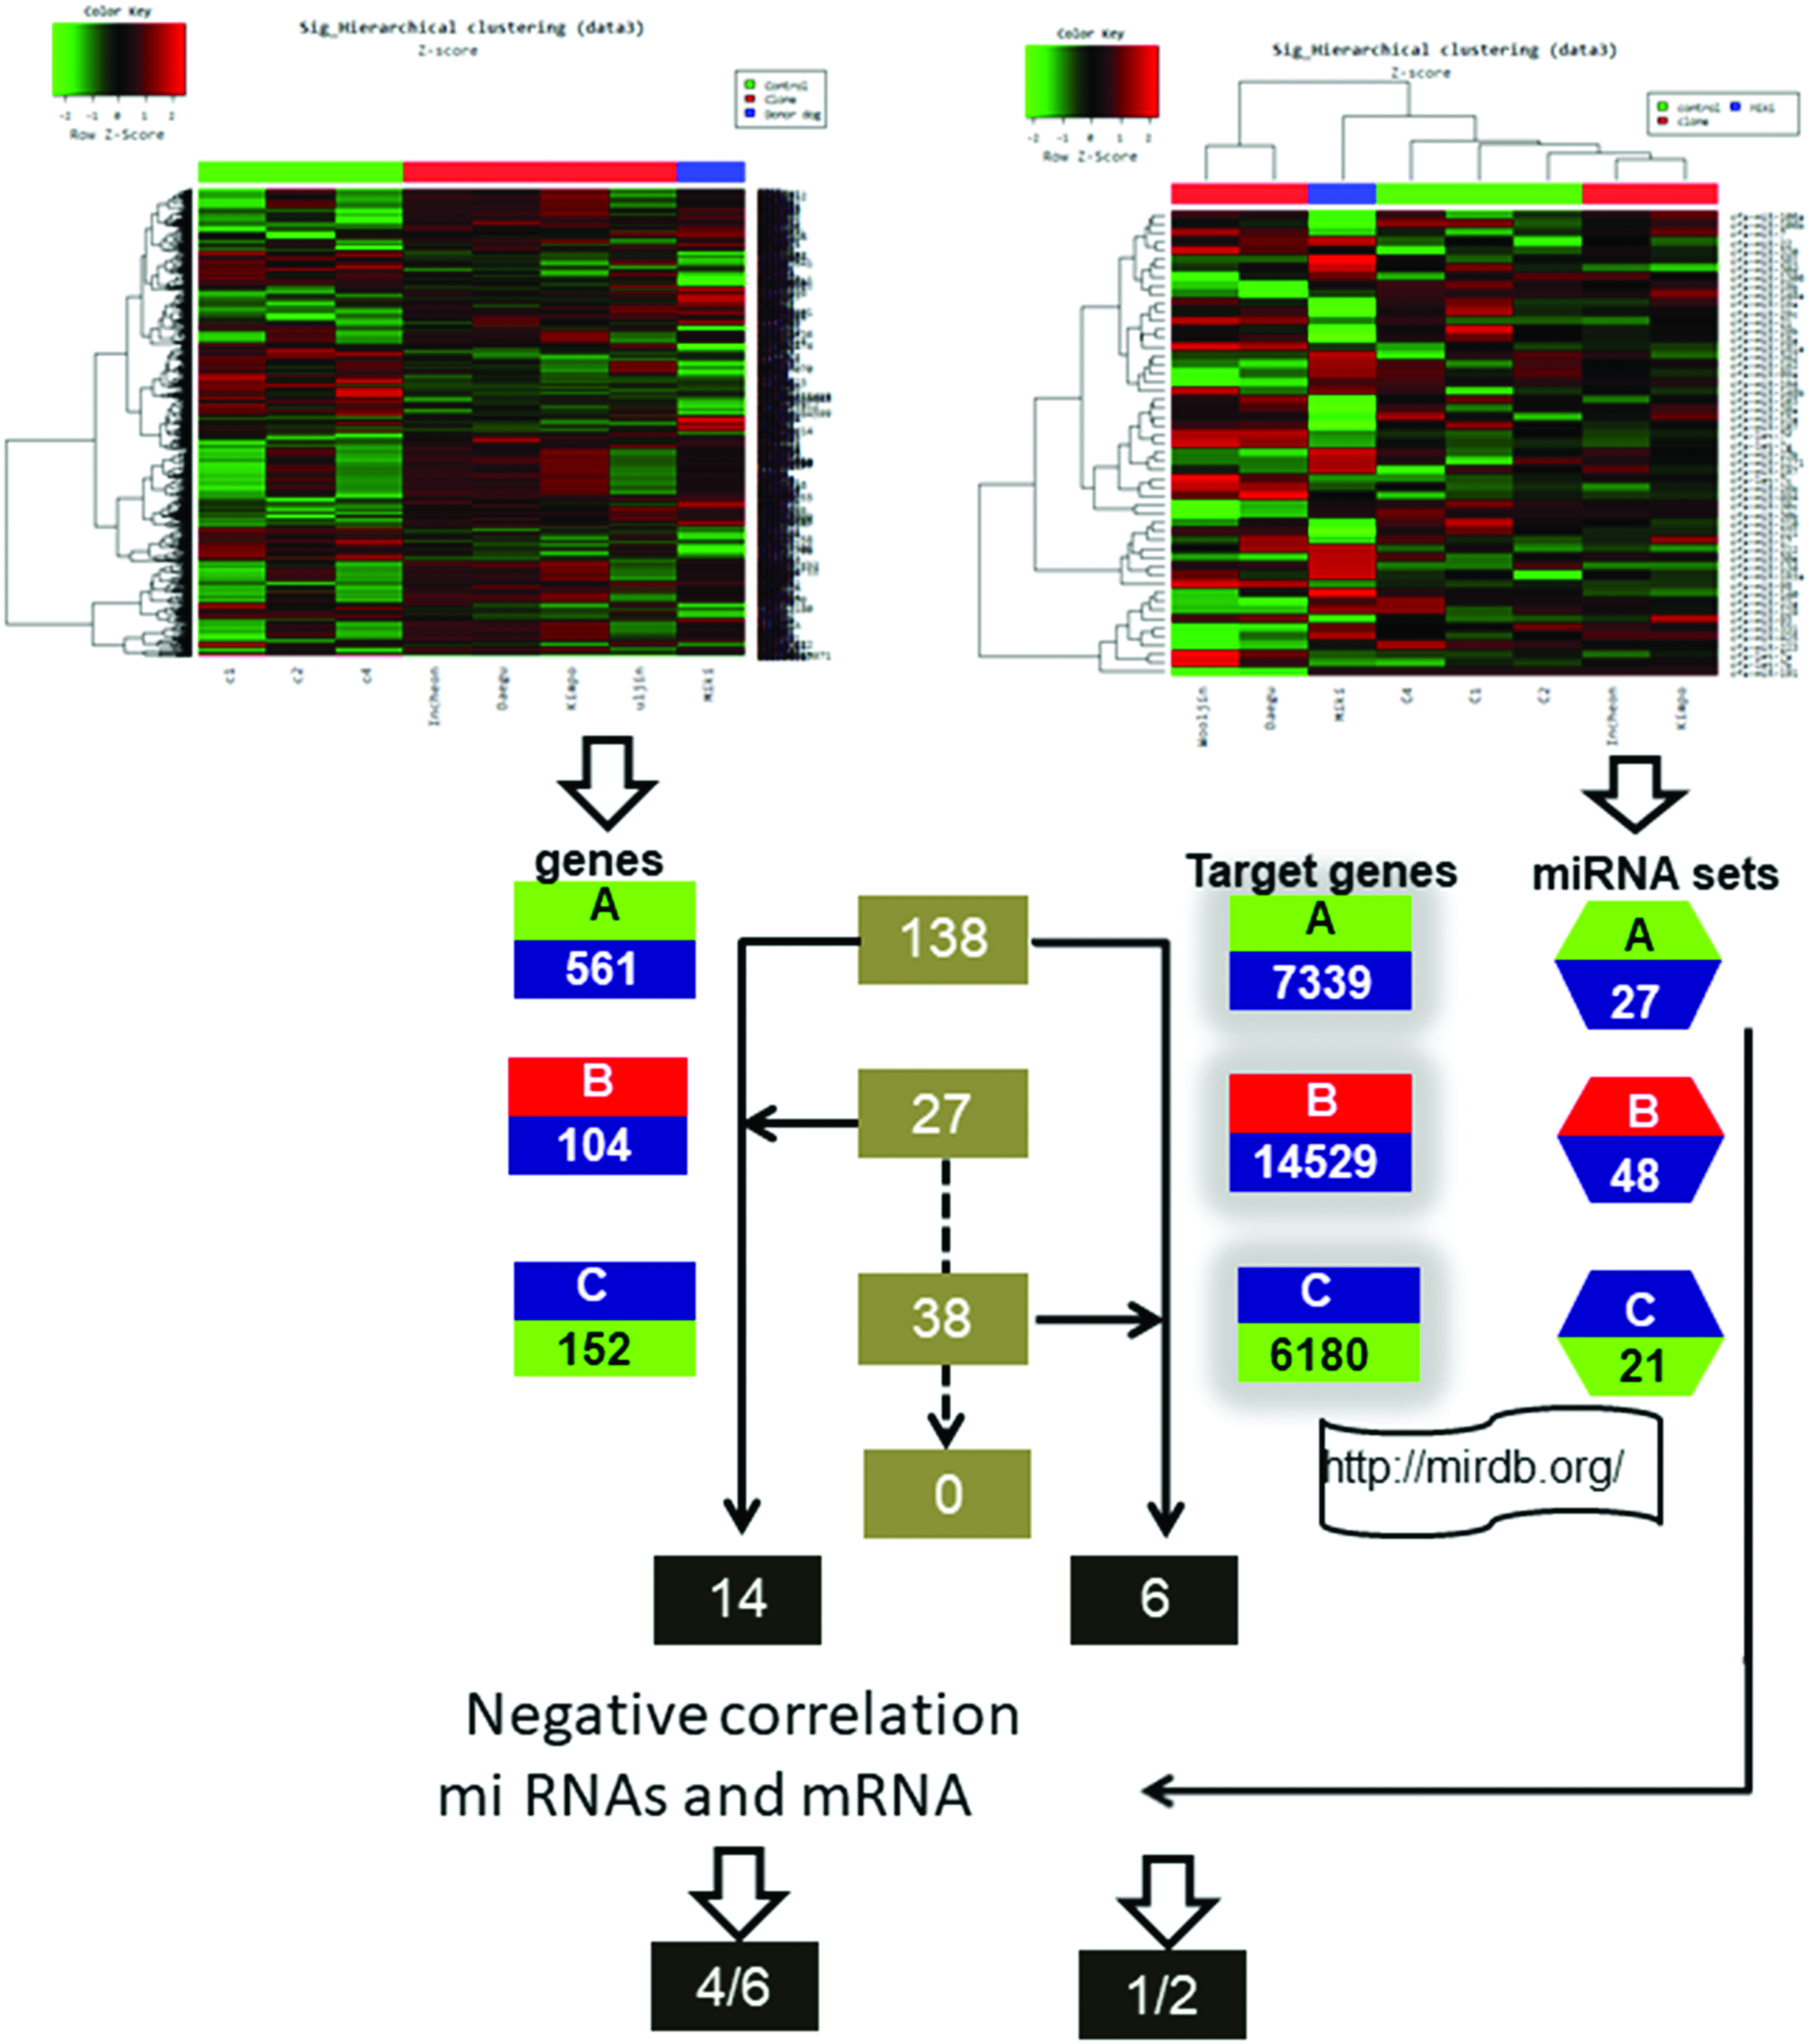
Overview of pairwise comparison of mRNA and miRNA data obtained from microarray analyses. Differentially expressed genes from the mRNA microarray were paired with predicted target genes based on altered miRNA expression. This identified 14 and 6 genes in A ∩ B and A∩C, respectively. Finally, negative correlations between miRNA and mRNA were checked. Color images are available online.
We also conducted KEGG analysis for the target genes in each group to assume their function using DAVID. Notably, the results did not resemble those of the DEGs described above (Supplementary Table S5); instead, a large number of genes belonging to pathways in cancer were observed among the target genes from both DEM groups A and B. The overlapping DEMs between groups A and B [(A∩B)-C] consisted of 10 upregulated and 10 downregulated miRNAs. KEGG analysis using the predicted target genes from the 20 DEM [(A∩B)-C] also revealed that the predicted genes are involved in cancer pathways (Supplementary Table S8).
Next, we sought to refine the relationships between the predicted target genes of DEMs and each DEG profiling and found that 138 (1.88%; aging comparison; A), 27 (0.20%; faithful reprogramming comparison; B), and 38 genes (0.56%; rejuvenating comparison; C) were detected in each DEG and predicted target gene profile (Fig. 2 and Supplementary Table S9), suggesting that these genes represent potential marker genes for evaluating aging/senescence.
Finally, we compared the predicted gene targets and DEGs and identified 14 and 6 potential marker genes in A ∩ B (mainly old-age effects;
Genes Are Matched with Putative Targets by miRNA
Expression profiles of senescence molecules
As the analysis of microarray data demonstrated that differences in expression were related to the cell cycle, we next investigated gene expression in blood from four cloned dogs, four age-matched control dogs, and one donor dog using a customized canine senescence gene RT2 Profiler PCR Array. We detected 12 genes showing a fold change in expression of greater than two in the clone and donor groups compared with that of the age-matched control (p < 0.05) (Supplementary Table S10). In the clone group, CDC25C, CREG1, and FN1 were upregulated, and ABL1, ETS2, and SERPINE1 were downregulated, compared with the age-matched control. Notably, CDC25C and CREG1 were upregulated in only the clone group, whereas SPARC and THBS1 were predominately upregulated in the donor dog.
We also produced a hierarchical clustering scheme (Fig. 3) using the transcriptional profiling obtained by the RT2 Profiler PCR Array and then sorted gene lists based on the clustering: CDM (minimum expression in both clone and donor), DM (maximum expression in the donor only), and CCM (maximum expression in the clone and age-matched control). We analyzed the three gene sets using GeneMANIA (human database; Supplementary Fig. S4) and found that the top two most enriched functions were “cell aging” and “regulation of mitotic cell cycle” in CCM, and “cellular response to FGF stimulus” and “cellular senescence” in DM, suggesting that a few senescence-associated genes are likely incompletely reprogrammed in cloned animals (Supplementary Table S11).

Microarray heat map of differentially regulated genes. CDM (minimum expression in both clone and donor groups), DM (maximum expression in donor group only), and CCM (maximum expression in clone and age-matched control groups). Color images are available online.
In addition, we compared gene expression profiles from microarray with those of RT2 profiler PCR (Table 8). Overall gene expression patterns (upregulation or downregulation) were similar, although several genes such as ABL1, CDC25C, CREG1, and SERPINE1 were not significantly altered in microarray analysis.
Comparison of Gene Expression Between RT2 Profiler PCR Array and Microarray
NC, not considered.
Discussion
In this study, pairwise and multiple comparisons were performed on the data obtained from microarray experiments to identify DEGs in the age-matched control versus donor (A), clone versus donor (B), and clone versus age-matched control (C). As presented in Table 1 and Figure 1, the alteration in A are likely attributed to different genome and different age (gY GO), possibly aging effects of the variations are more significant, compared with the differences in genome because both the control and donor dogs are the same breed, Labrador retriever. Comparison of transcriptome profiles between clone and donor (B) reflects faithful reprogramming and aging effects (G′Y′ GO) because cloned dogs have the same genome of a donor, but different ages, and incomplete reprogramming by SCNT.
Thus, the results of comparison may demonstrate the main causes of the differences, for example, age effects or incomplete reprogramming. In transcriptome comparison of clone with age-matched control, the variants were different genome and reprogramming (G′ Y′gY). As mentioned above, the genome per se may do not affect the different gene expression, but incomplete reprogramming including rejuvenating would be main an effector. Therefore, multiple comparison using pairwised three different tested groups may determine which factors mainly affect DEG.
A relatively small number of genes were differentially expressed in each pairwise comparison or multiple comparisons; in particular, the number of identified genes was very small (104 genes) in the faithful reprogramming (B; clone vs. donor, G′Y′ GO), indicating that the vast majority of genes were completely reprogrammed. However, among the 23 genes exclusively altered in B, immune response-related genes such as CD8A, KLRK1, SART1, and INHBA were identified (Ojeda-Fernández et al., 2016; Toyoshima et al., 2012), suggesting that heath issues related with incomplete reprogramming could be observed in SCNT dongs.
Notably, expression of cOR11G7, which is associated with olfactory transduction, also differed (Olender et al., 2004). Thus, we needed to analyze 79 overlapping genes, which may associated with aging. Analysis of the transcriptome profiles of A with B (A∩B) showed the common variant features, GO Y/Y′, postulating that the DEGs are likely caused by aging effector including incomplete reprogramming. Cell cycle-associated DEGs, for example, elevation of CCNE1, CCNB2, and CCNA, and repression of CHPT1 and PPAP2B in the younger samples (cloned and age-matched control dogs), support this hypothesis because the CCNE1, CCNB2, and CCNA genes are reported to be downregulated in tissues of old animals including rhesus monkey (Coqueret, 2002; Wei et al., 2015).
In addition, the glycerophospholipid metabolism is associated with aging (Das et al., 1993; Kim et al., 2014; Lee et al., 2014); for example, the upregulation of PPAP2B might play a role in adipogenesis, which is closely related to aging and senescence (Bianchini et al., 2013; Kirkland et al., 2002; Wei et al., 2015; Xu et al., 2015). However, in the cloned dogs, we found that the alteration expression of THEM4 and XYLT2 was linked to glioblastoma and sclerosis, which are closely associated with aging, suggesting that epigenetic alterations occur via SCNT and that these genes may represent potential markers for SCNT reprogramming (Götting et al., 1999; Knobbe et al., 2004; Luckhardt and Thannickal, 2015; Serão et al., 2011; Sweatt et al., 2003; Wu et al., 2015).
This study also presents the first detailed and comprehensive assessment of the complementation of predicted mRNA-miRNA with mRNA derived from whole blood. We found negative expression correlations between miRNA and mRNA among the overlapping genes, suggesting that the identified miRNA and mRNA genes may be used as a biomarker for the lifelong health assessment of SCNT animals including elite sniffer dogs without invasive diagnostic tests and procedures.
Furthermore, the overlapping genes between faithful and rejuvenating reprogramming (A∩C) are likely caused by mainly incomplete reprogramming regarding aging because the overlapping part reflects variants by SCNT (
Moreover, regarding the feature of the overlapping genes, the genome may generate the specific expression of genes linked to desired traits found in special-purpose dogs; for example, in military working dogs, there is a link between behavioral phenotyping and genotyping (Eo et al., 2013). Notably, the two upregulated genes such as NFIB and CLIC4 are expressed in the olfactory bulb and may play a regulatory role in the development of the olfactory system (Padmakumar et al., 2014; Plachez et al., 2012), and miRNA-223 is relatively highly expressed in neural tissues including the olfactory bulb in rat (Hua et al., 2009), suggesting that these genes may be useful markers for the selection of elite sniffer dogs.
In addition, we identified potential biomarker gene pairs (miRNA and mRNA) by combining target prediction and expression profiling (Wang and Wang, 2006). miRNAs function as good biomarkers for screening, diagnosis, and monitoring of diseases and health status (Etheridge et al., 2011; Sheinerman and Umansky, 2013). Furthermore, the existence of a negative correlation in expression level between miRNA and mRNA may facilitate biomarker detection as the amplification of mRNA using PCR is relatively easy and straightforward compared to the examination of expression levels of miRNA.
Particularly, we consider that the reciprocal miRNA-mRNA expression may be associated with aging because the overlapping genes in young cloned/age-matched dogs versus an old donor dog (A∩B) represent differences in age-dependent expression. For example, the expression of cfa-miR-106b (CC2DIA and PPP1R3B), cfa-miR 20a (PPP1R3B and CC2D1A), and cfa-miR-30e (HIRA, IGJ) was inversely associated with that of two different genes, and the two transcripts, PPP13B and CC2D1A, exhibited opposite expression patterns from cfa-miR-106b in the aging effects (A∩B).
In contrast to previous studies (Cartwright et al., 2010; de Magalhães et al., 2009; Favaro et al., 2012; Hackl et al., 2010; Jeyapalan et al., 2007; Teslovich et al., 2010), increased expression of HIRA, IGJ, and STMN, which are implicated in aging processes including lipid metabolism, and reduced expression of PPP1R3B and CC2D1A, which are associated with neurodegenerative disease, indicate that the miRNA/mRNA negative regulation pairs may be used as markers to monitor cell reprogramming process/status in SCNT dogs in terms of aging/senescence.
Analysis of mRNA and miRNA microarray data revealed that age or senescence-associated genes were significantly differentially expressed, although only few genes were altered compared with the number of tested genes. Therefore, we investigated gene expression profiling focusing on senescence using the RT2 Profiler PCR Array. As previously indicated, most genes were not changed (p < 0.05); however, the expression of senescence initiators such as CDC25C and CREG1, which enhance cellular senescence via p16INK4a, was significantly increased, indicating that premature aging features may be imposed by SCNT, although expression levels required to affect this outcome remain incompletely defined (Boquoi et al., 2015; Moolmuang and Tainsky, 2011).
Furthermore, in both cloned and donor samples, we observed upregulation of FN1, the expression of which in the olfactory system is related to features such as unpolysialylated olfactory cell adhesion (Foley et al., 2010), suggesting that FN1 may also constitute a marker gene for monitoring elite sniffer dogs.
In conclusion, we evaluated the expression profiling of mRNA and miRNA originating from the whole blood of cloned dogs, age-matched control dogs, and a donor dog and revealed that the SCNT process faithfully recapitulated the expression of most genes in terms of circulating mRNA and miRNA expression. In particular, we were able to identify evidence for genomic rejuvenation by the epigenetic reprogramming of aging/senescence-associated genes, the expression of which was more similar between cloned and age-matched control dogs, compared with that of a donor dog.
To the best of our knowledge, this represents the first comparison of the expression patterns of both mRNA and miRNA, and of the identification of potential miRNA-target pairs that may be used as biomarkers for monitoring age-related phenotypes in cloned dogs. Furthermore, comparison of mRNA and miRNA in donor/clone elite sniffer dogs and age-matched control dogs highlighted candidate genes that may contribute to superior detection ability. Our proposed approach to assessment in cloned animals may therefore allow us to monitor lifelong health and facilitate the selection of candidate/training animals with minimally invasive procedures.
Footnotes
Author Disclosure Statement
The authors declare they have no conflicting financial interests.
Funding Information
This work was carried out with the support of “Cooperative Research Program for Agriculture Science & Technology Development (Project No. PJ008945012012)” Rural Development Administration, Republic of Korea. The funding agency does no play a role in the design of the study and collection, analysis, and interpretation of data and in writing the manuscript.
References
Supplementary Material
Please find the following supplemental material available below.
For Open Access articles published under a Creative Commons License, all supplemental material carries the same license as the article it is associated with.
For non-Open Access articles published, all supplemental material carries a non-exclusive license, and permission requests for re-use of supplemental material or any part of supplemental material shall be sent directly to the copyright owner as specified in the copyright notice associated with the article.