
Abstract
The severe acute respiratory syndrome coronavirus 2 (SARS-CoV-2) was primarily noted as a respiratory pathogen, but later clinical reports highlighted its extrapulmonary effects particularly on the gastrointestinal (GI) tract. The aim of the current study was the prediction of crucial genes associated with the regulatory network motifs, probably responsible for the SARS-CoV-2 effects on the GI tract. The data were obtained from a published study on the effect of SARS-CoV-2 on the Caco-2 (colon carcinoma) cell line. We used transcription factors-microRNA-gene interaction databases to find the key regulatory molecules, then analyzed the data using the FANMOD software for detection of the crucial regulatory motifs. Cytoscape software was then used to construct and analyze the regulatory network of these motifs and identify their crucial genes. Finally, GEPIA2 (Gene Expression Profiling Interactive Analysis 2) and UALCAN datasets were used to evaluate the possible relationship between crucial genes and colon cancer development.
Using bioinformatics tools, we demonstrated one 3edge feed-forward loop motifs and recognized 10 crucial genes in relationship with Caco-2 cell infected by SARS-CoV-2, including SP1, TSC22D2, POU2F1, REST, NFIC, CHD7, E2F1, CEBPA, TCF7L2, and TSC22D1. The box plot analysis indicated the significant overexpression of CEBPA in colon cancer compared to normal colon tissues, while it was in contrast with the results of stage plot. However, the overall survival analysis indicated that high expression of CEBPA has positive effect on colon cancer patient survivability, verifying the results of CEBPA stage plot. We predict that the SARS-CoV-2 GI infections may cause a serious risk in colon cancer patients. However, further experimental studies are required.
Introduction
At the end of the year 2019, coronavirus disease-2019 (COVID-19) was identified in Wuhan (Eastern China) with a SARS-like acute respiratory distress syndrome and severe lung injury in many patients (Bojkova et al., 2020).
COVID-19, which had been emerged from the third type of coronavirus in the past two decades, known as severe acute respiratory syndrome coronavirus 2 (SARS-CoV-2), rapidly spread to other nations and was declared a global pandemic on March 11, 2020 (Fathi et al., 2021; Wu et al., 2020a). The SARS-CoV-2 like its close kin, SARS-CoV and Middle East respiratory syndrome-CoV, was primarily recognized as a respiratory pathogen, spreading via droplets and aerosols. But, existence of extrapulmonary indications and other modes of transmission were regarded when the first confirmed case of COVID-19 was reported from the United States with gastrointestinal (GI) symptoms such as nausea and vomiting, which were followed later by diarrhea (Holshue et al., 2020; Samanta et al., 2020).
Initial investigations reported relatively lower rates of GI symptoms such as diarrhea (Alhazzani et al., 2020; Chen et al., 2020; Huang et al., 2020; Zhu et al., 2020) in 1%–3.8% of COVID-19 patients (Ng and Tilg, 2020), whereas with increasing reports publishing GI involvement, this rate went up to about 61.1% in some cases with even pure GI manifestations without respiratory symptoms. Also, the sheds of SARS-CoV-2 through feces was another definitive proof on GI involvement and a potential route for transmission (Huang et al., 2020). Now, about 2 years after COVID-19 pandemic, several articles report GI symptoms as well as frequent detection of the virus in stool—regardless of diarrhea (Cha et al., 2020; Liang et al., 2020; Zhang et al., 2020), suggesting the GI involvement and a potential route for transmission (Huang et al., 2020).
The SARS-CoV-2 uses spiky protein binding to its host cell receptors and releases its genome into the cell. It has been reported that this new Coronavirus apply angiotensin convertase enzyme 2 (ACE-2) as a viral receptor to enter host cells (Wan et al., 2020a, 2020b; Zhou et al., 2020). Not the ACE-2 are found in the lung alveolar and esophageal epithelial cells, but they are in the absorptive enterocytes of ileum and colon with noticeably higher expression (Zhang et al., 2020). A single-cell RNA sequencing study also demonstrated the high expression level of ACE-2 in the proximal and distal intestine (Liang et al., 2020).
The possible mechanisms of ACE-2 in SARS-CoV-2 infection includes direct entry through ACE-2 receptor contributing to malabsorption and unbalanced intestinal secretion as well as activation of enteric nervous system, direct or indirect damage of the intestinal epithelium due to inflammatory response, virus-induced disturbances of the intestinal flora, and gut–lung axis disorders; wherein respiratory flora alteration effects on the digestive system by immune regulation (Budden et al., 2017). Hence, the invasive nature of SARS-CoV-2 and the abundance of its receptors throughout the GI tract can explain the GI inflammation (Hashimoto et al., 2012; Mirmotalebisohi et al., 2020; Xu et al., 2020).
All mentioned reports, suggest the importance of molecular examination of GI tract cells due to the SARS-CoV-2 infection to reveal the viral pathogenicity and identify the potential drug targets. Hence, the present study was aimed to predict the crucial genes associated with the regulatory motifs network, which is probably responsible for the SARS-CoV-2 effect in the GI tract. We used bioinformatics tools to analyze regulatory network, obtained from limited experimental studies and public databases, to reveal crucial genes relevant for SARS-CoV-2 infection and cellular response to this virus.
Materials and Methods
Data mining for GI infection-related genes
Data were obtained from the published study by Bojkova et al. (2020), entitled “Proteomics of SARS-CoV-2-infected host cells reveals therapy targets”; in which human Caco-2 cells, derived from colon carcinoma, were applied for in vitro study model. Bojkova et al. (2020) established a human cell-culture model for inducing the infection by Caco-2 cells, infected with a clinical isolate of SARS-CoV-2. The addition of SARS-CoV-2 was performed at a multiplicity of infection, leading to a fast progression of viral infection and visibility of cytopathogenic effects after 24 hours. Using this cell-culture system and by translatome and proteome proteomics techniques, they determined the infection profile of SARS-CoV-2 at different times interval after infection (Bojkova et al., 2020). In current study, we selected their differentially expressed genes (DEGs) in Caco-2 cells due to SARS-CoV-2 infection for further analyses.
Identification of transcription factors and microRNAs related to the DEGs
In this step, four regulatory relationships in association with DEGs were identified, including the following:
Transcription factors (TFs) regulating genes: we used the free gene set enrichment analysis web-based tool, Enrichr (http://amp.pharm.mssm.edu/Enrichr/), to find TF, which regulate obtained DEGs. Enrichr renders multiple types of visualization reports of corporate functions of gene lists. It distributes a complete source for curated gene sets. Also, it is a search engine to incorporate biological science for further biological explorations (Chen et al., 2013). The different regulatory databases, linked to Enrichr tool, including TRRUST (https://www.grnpedia.org/trrust/), ARCHS (https://amp.pharm.mssm.edu/archs4/), TRANSFACT (http://genexplain.com/transfac/#section), and ENCODE (https://www.encodeproject.org/), were used to find the TF related to the DEGs genes. microRNAs (miRNAs) regulating genes: two databases, linked to Enrichr tool, including miRTarBase and TargetScan as well as mirDB database, linked to genetrail2 web tool (https://genetrail2.bioinf.uni-sb.de/), were used to find the miRNAs related to DEGs the genes. miRNAs regulating TFs: The third regulatory relationship was found using miRTarBase and TargetScan databases. TFs regulating miRNAs: The TransmiR (www.cuilab.cn/transmir) database, an open-source database for TF-miRNA regulations, was used to extract the TFs regulating miRNAs. This database identified the TFs directly interact with the miRNA precursor genes and control the expression of miRNAs (Tong et al., 2019).
Detection of motifs
The four types of relationship, obtained from the previous step, were incorporated altogether to construct a TF-miRNA-target gene network. These four extracted regulatory relationships (TF›miRNA, miRNA›Gene, TF›Gene, and miRNA›TF) can be combined in different types of 3node motifs. Hence, size-3 network motif types in the original network were detected using a network motif detection tool, FANMOD software. It finds motifs that occur significantly in the real network more often than detected in 1000 random networks under the Z-score parameter. Z-scores are also computed for all the motif types. They indicate the frequency of motifs observed in the real network minus the mean of their occurrence in the random network divided by the standard deviation (SD). Finally, the 3node motif types with Z-score >2.0 and p-value <0.05 were considered significant.
Construction of motif-specific subnetwork
We applied Cytoscape software (v 3.5.1) to construct the regulatory network based on obtained motif data. First, the subnetworks related to each kind of significantly scored motif (composed of 3nodes and 3edges) were separately visualized by Cytoscape and then merged together. All nodes with the highest degree ranks (top 10% of the nodes) and with the highest betweenness centrality (top 10% of the nodes) were selected as hubs and bottlenecks, respectively. Both hub and bottleneck nodes were considered as possible crucial nodes.
Confirmation of crucial genes using GEPIA2 and UALCAN datasets
The Gene Expression Profiling Interactive Analysis 2 (GEPIA2) is a web resource for analyzing the RNA sequencing data using a standard processing pipeline and based on TCGA (The Cancer Genome Atlas) and GTEx (Genotype-Tissue Expression) projects (http://gepia2.cancer-pku.cn). The comprehensive, user-friendly, and interactive UALCAN web resource has been designed to provide easy access to TCGA, MET500, and CPTAC as publicly available cancer OMICS data. UALCAN allows to perform pan-cancer gene expression analysis as well as in silico validation of potential genes of interest (http://ualcan.path.uab.edu). We used GEPIA2 and UALCAN datasets to evaluate the possible relationship between our crucial genes and cancer development with emphasis on colon cancer and results were demonstrated in form of heatmap, box, stage, scatter, and Kaplan–Meier plots.
Statistical analysis
All statistical analyses were performed based on defined parameters in databases. ANOVA test was used for expression of crucial genes in colon cancer versus normal samples (matched TCGA normal and GTEx data) in GEPIA2. In stage plot (generated by UALCAN), SD from the median across samples were represented by Z-values. The values of Log2 Spectral count ratio (from CPTAC) were first normalized within each sample profile and then normalized across samples. Overall survival was illustrated by Kaplan–Meier plot (generated by the GEPIA2) and results were shown along with the hazardous ratio (HR) and p-values of the log-rank test. The correlation between genes was assessed by statistical significance and Spearman's correlation. The values of p < 0.05 were considered statistically significant.
Results
Identification of genes and their related TFs and miRNAs in GI infection by SARS-CoV-2
The 164 DEGs were identified from the Bojkova et al. (2020) study, in which human Caco-2 cell line profile, infected by SARS-CoV-2, was determined by translatome and proteome proteomics after infection (Supplementary Table S1).
The TFs that regulate these DEGs were obtained by the Enrichr tool using its different database subparts, including ARCHS4 (231 TFs), ENCODE (70 TFs), TRRUST (19 TFs), TRANSFACT (32 TFs), and Enrichr gene co-occurrence (1036 TFs) (Supplementary Table S2). The shared TFs presented in at least 3 databases were selected (22 TFs); also with this manner, the TFs shared between TFs obtained from these public databases and DEGs (8 TFs) were obtained (Fig. 1A, B) and finally, the combination of these 30 TFs (22 + 8) was used for further analysis.
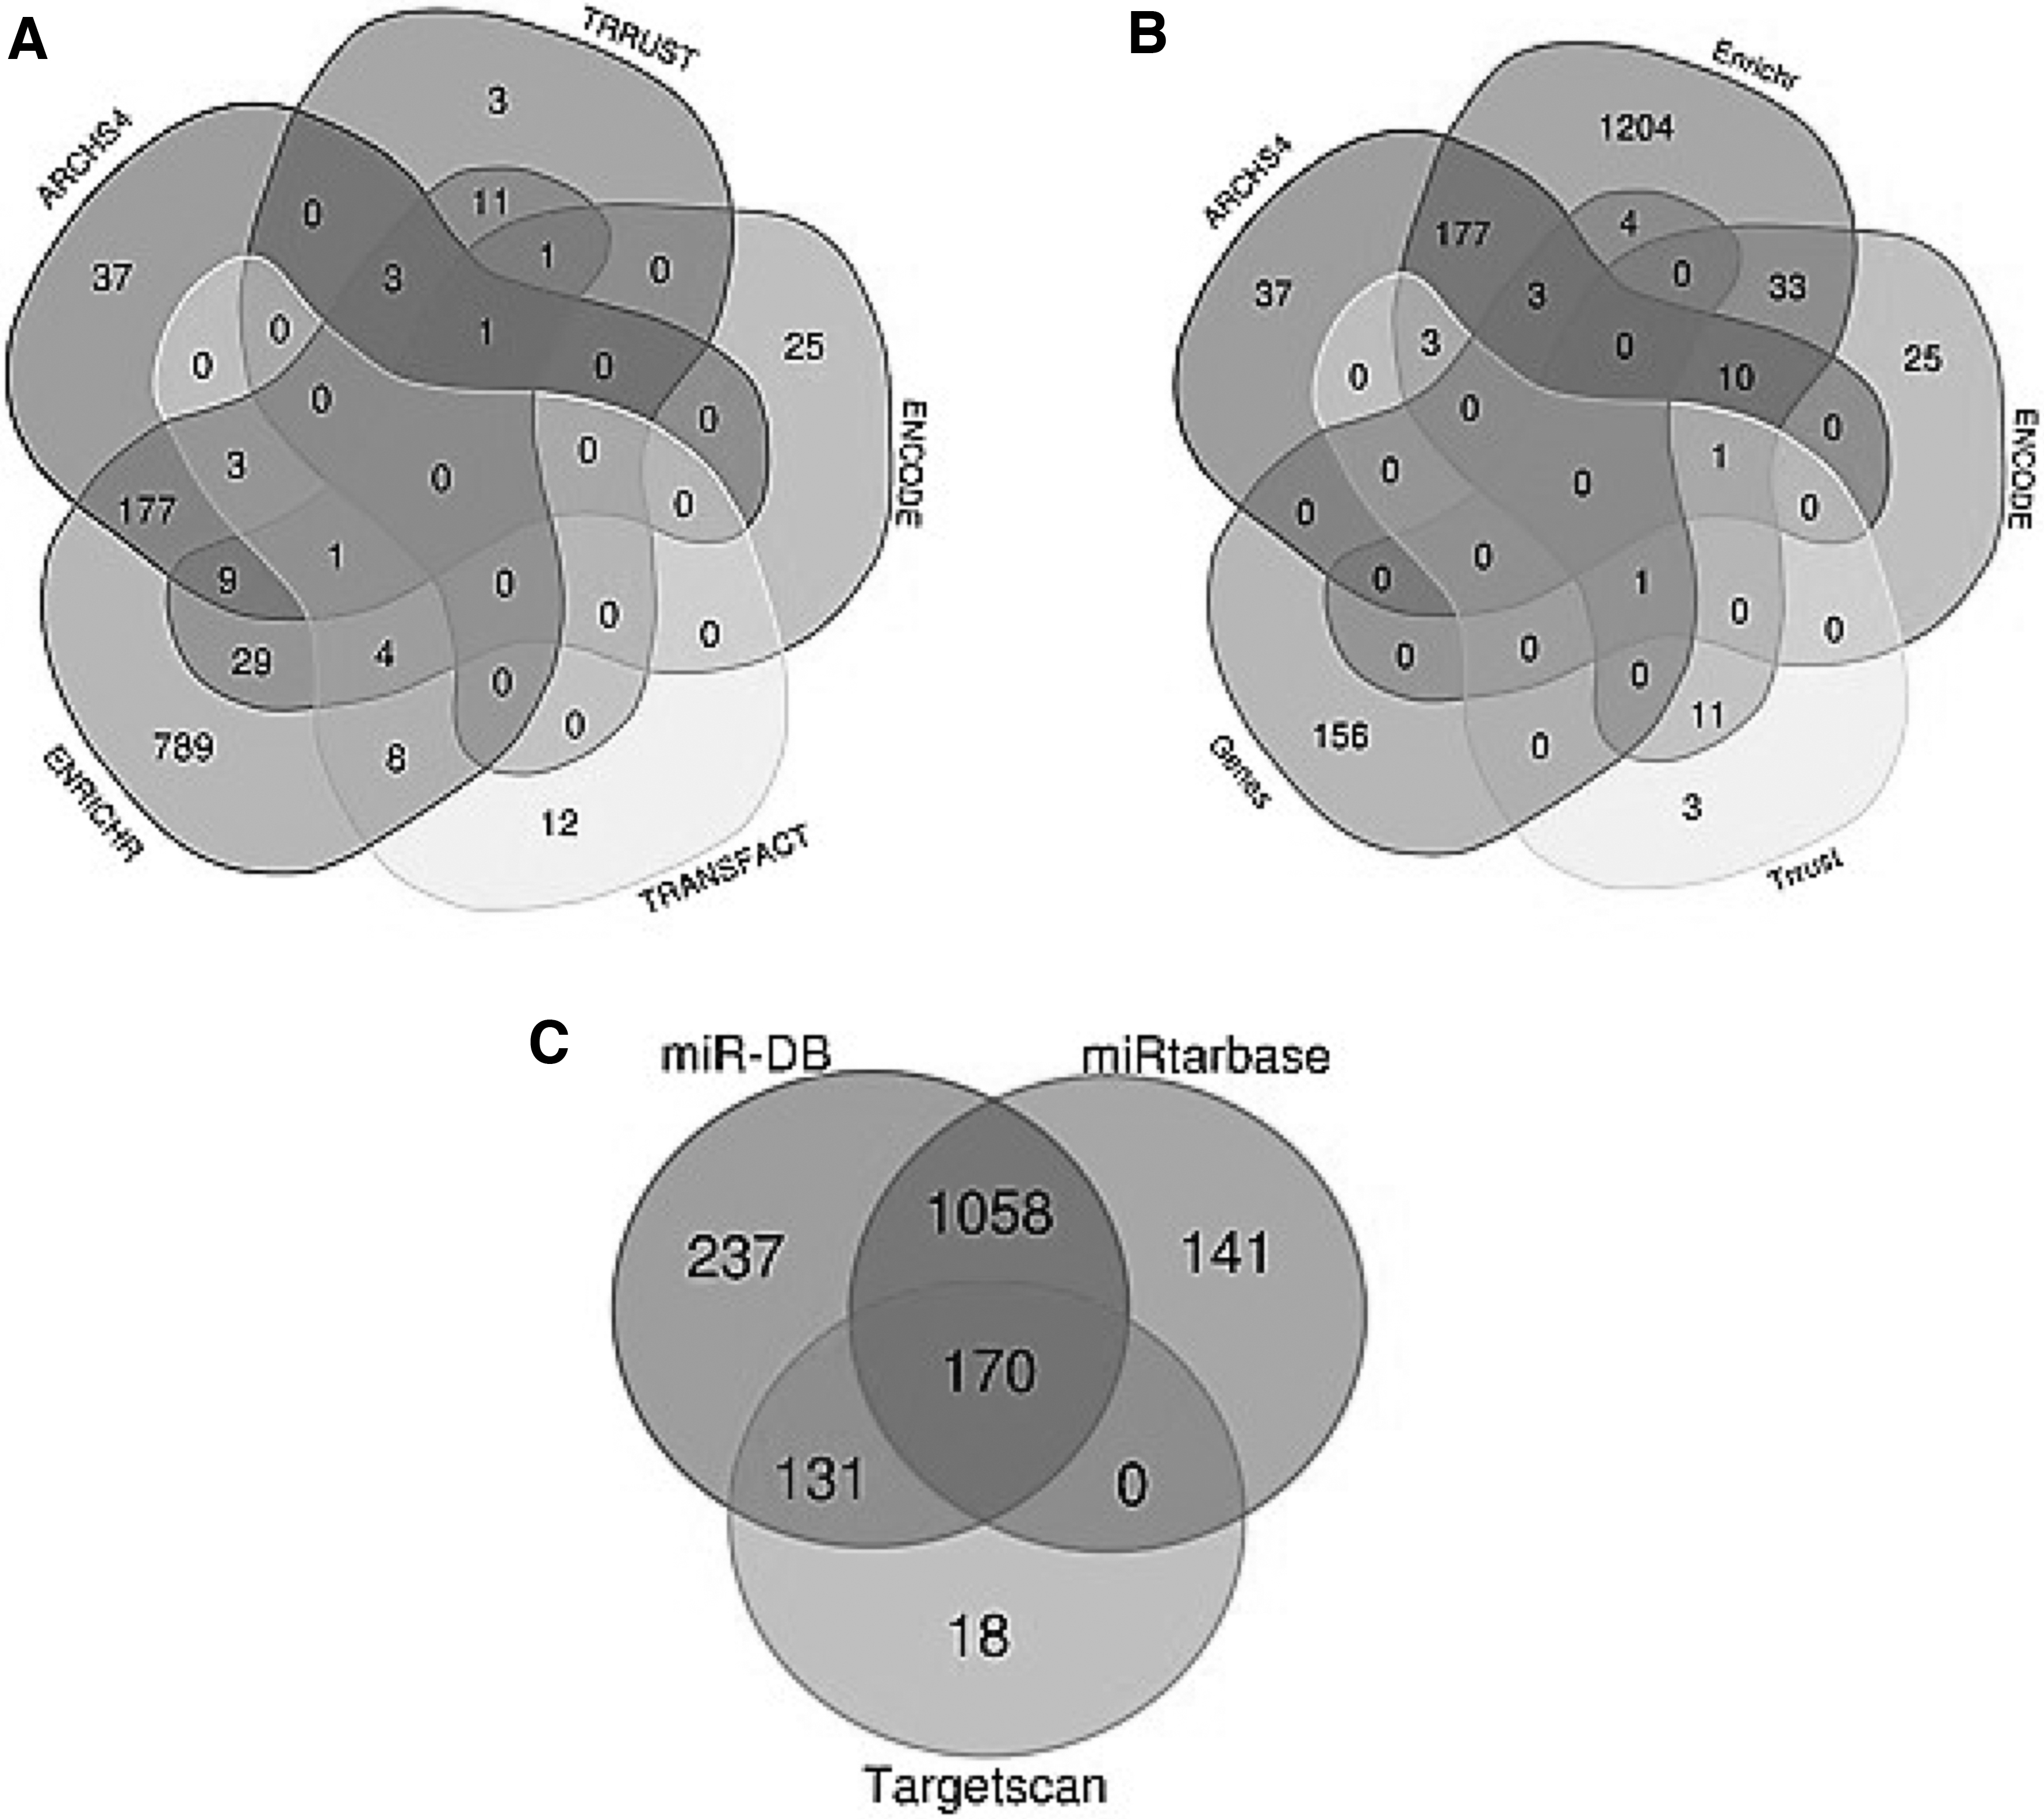
The enrichment of genes for miRNAs resulted in 1369, 1598, and 319 miRNAs from miRTarBase, miRDB, and TargetScan databases, respectively (Supplementary Table S3). The 170 shared miRNAs among these 3 databases were used for further analysis (Fig. 1C).
The miRNAs regulating obtained TFs were detected by 2 miR databases (miRTarBase and TargetScan) and finally, 266 miRNAs were detected for these TFs (Supplementary Table S4).
To identify TFs regulating miRNAs, the TRANSMIR database was used, and additionally, 116 TFs were resulted (Supplementary Table S5).
The p-value <0.05 has been considered statistically significant for enrichment in all relationships.
Detection of motif and construction of regulatory network
The four types of regulatory data were put into the FANMOD software as an incorporated list (Supplementary Table S6) for extraction of TF-miRNA-target gene motifs (Table 1). Only one significant 3node size motif (feed-forward loop [FFL]) was identified by FANMOD software analysis (Table 2) that was used to construct the new subnetwork (Fig. 2A).

The FFL motif
Summary of the Four Types of Regulatory Relationships and the Detected Feed-Forward Loops
FFL, feed-forward loop; miRNA, microRNA; TF, transcription factor.
Network Motif Obtained by FANMOD Software Analysis
Subgraph was sorted based on Z-score >2 and p-value <0.05, parameters. Each edge color specifies one special type of regulatory interaction between the two terms as follows:
(1)  miR-gene (2)
  TF-gene (3)
  miR-TF (4)
  TF-miR.
The motif-specific regulatory network was constructed and visualized by Cytoscape. The network analysis showed that it consisted of 180 nodes and 625 edges (Fig. 2B). The top 10% higher degree and betweenness were considered as cutoff criterion of the hub and bottleneck nodes and based on these cutoff levels, crucial nodes were recognized in the network. The results represented SP1, TSC22D2, POU2F1, REST, NFIC, CHD7, E2F1, CEBPA, TCF7L2, and TSC22D1 as shared hubs and bottleneck nodes (Table 3).
Top 10% Nodes, Selected as Hubs and Bottlenecks in Regulatory Network
Confirmation of SP1, TSC22D2, CHD7, CEBPA, and TSC22D1 crucial genes by GEPIA2 and UALCAN analysis
Although the results of network analysis represented SP1, TSC22D2, POU2F1, REST, NFIC, CHD7, E2F1, CEBPA, TCF7L2, and TSC22D1 as shared crucial genes, for confirmation of data using GEPIA2 and UALCAN datasets to evaluate the possible relationship between our crucial genes and colon cancer, we only focused on crucial genes, obtained from Bojkova et al. (2020) study; in which a human colon carcinoma cell line (Caco-2 cell line) had been infected by SARS-CoV-2 and differential expression genes were reported (Supplementary Table S1). Hence, heatmap, dot, box, stage, scatter, and Kaplan–Meier plots were used to demonstrate the results of SP1, TSC22D2, CHD7, CEBPA, and TSC22D1 analysis.
We initially compared the transcription levels of these five candidate genes in different types of cancers with those in normal samples. The heatmap plot showed that these five genes have different expression in almost all types of cancers compared to normal samples (Fig. 3). Using dot and box plots, we demonstrated different transcription levels of candidate genes in colon cancer that the box plot revealed a significant overexpression of CEBPA in colon cancer rather than in normal colon tissues (Figs. 4 and 5). We investigated whether SP1, TSC22D2, CHD7, CEBPA, and TSC22D1 expression levels changed in different stage of colon cancer. Stage plots of candidate genes illustrated nonsignificant expression levels of SP1, TSC22D2, and significant expression levels of CHD7, CEBPA, and TSC22D1 in different stages of colon cancer in comparison with normal colon tissues (Fig. 6).
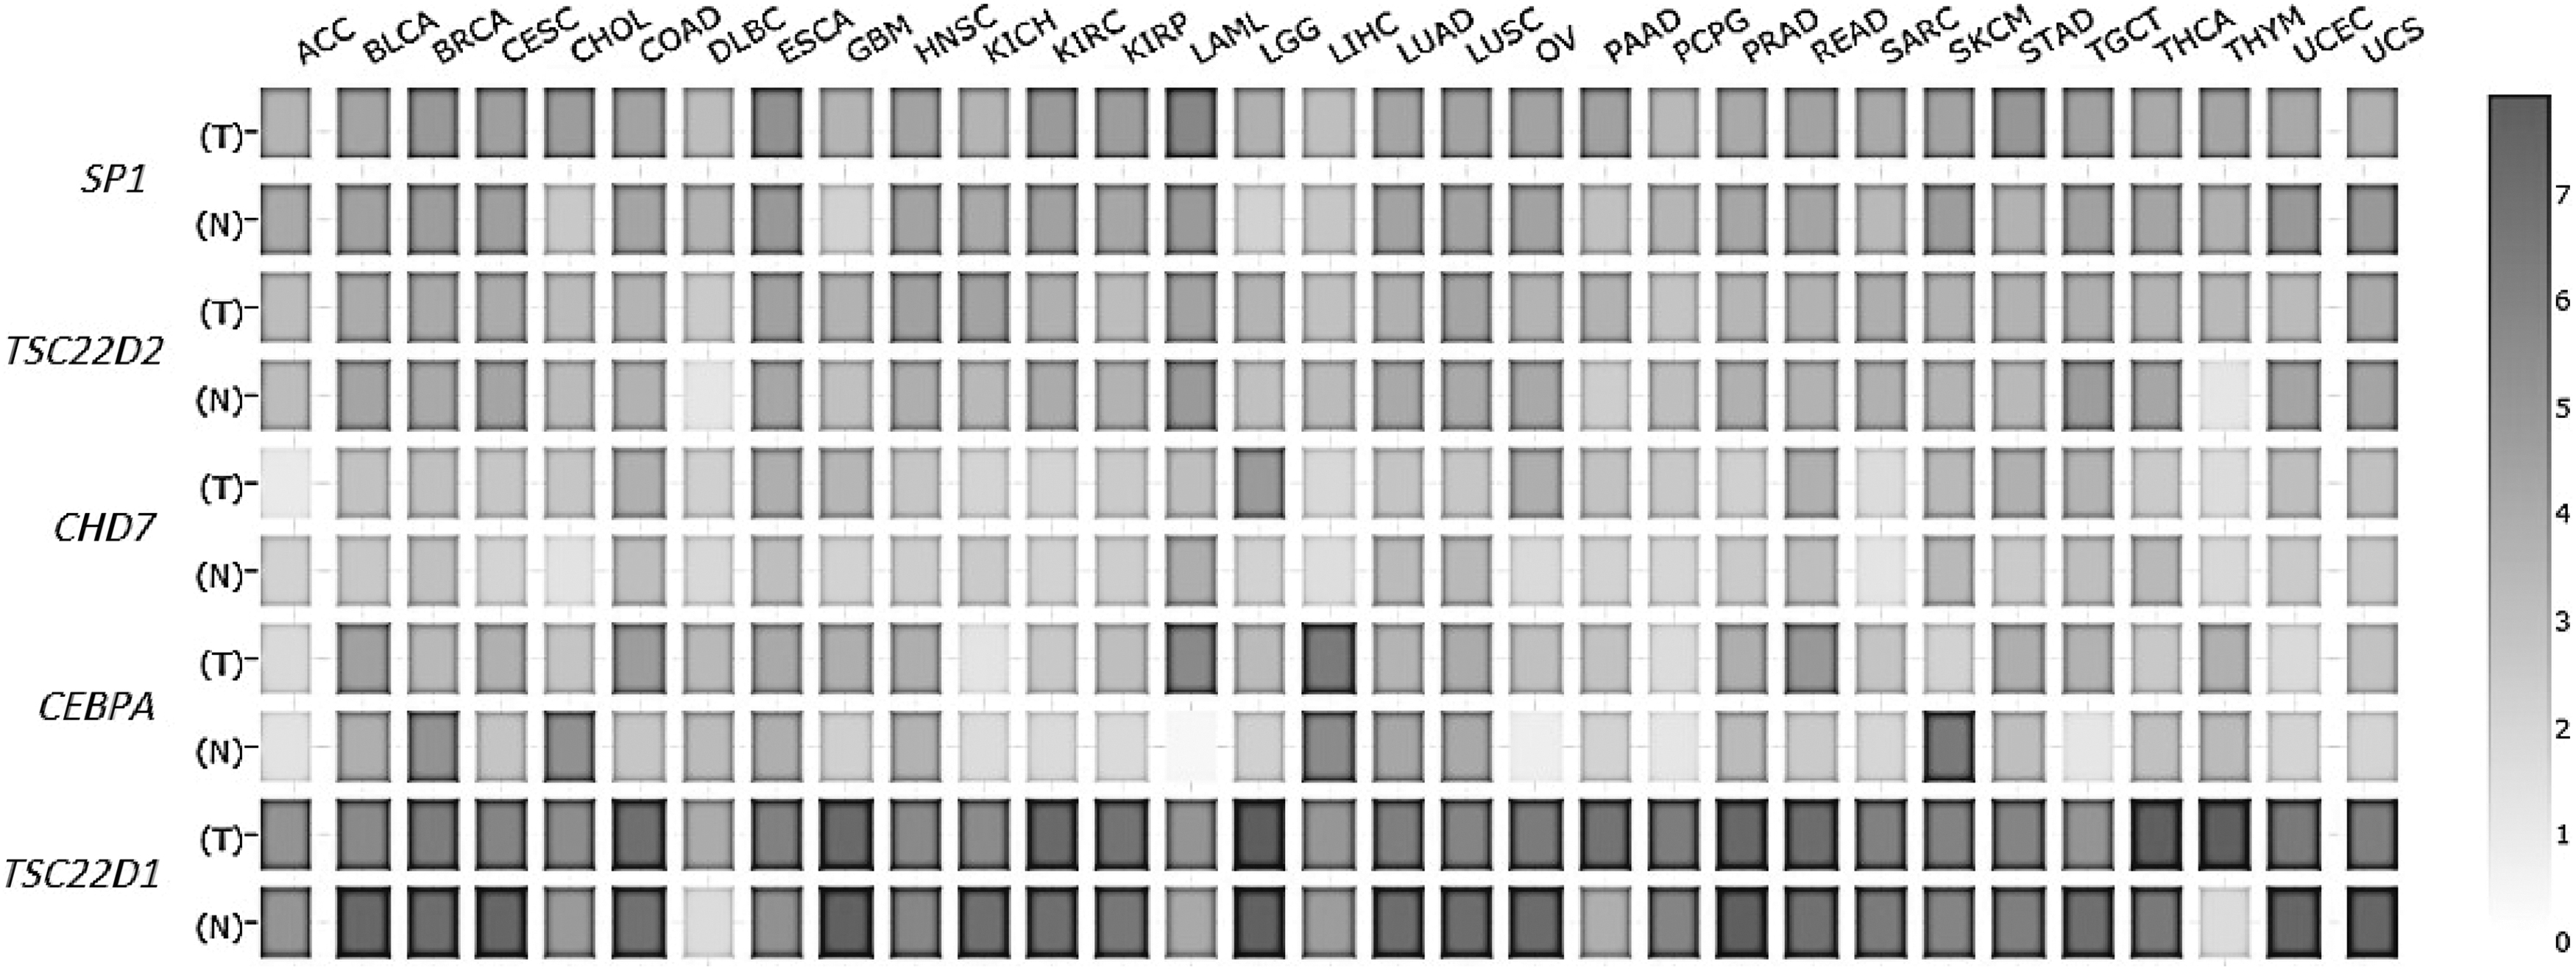
The heatmap plot represents the transcription expression levels of five candidate genes in different types of cancers compared to normal samples (by GEPIA2). For identification of the full name of the cancers, please refer to the Abbreviations at the end of article. GEPIA2, Gene Expression Profiling Interactive Analysis 2; N, normal; T, tumor.

The dot plot illustrates the transcription expression levels of five candidate genes in colon cancer compared to normal samples (by GEPIA2).

The box plot demonstrates the different transcription levels of five candidate genes in colon cancer rather than normal samples (by GEPIA2). COAD, colon adenocarcinoma.
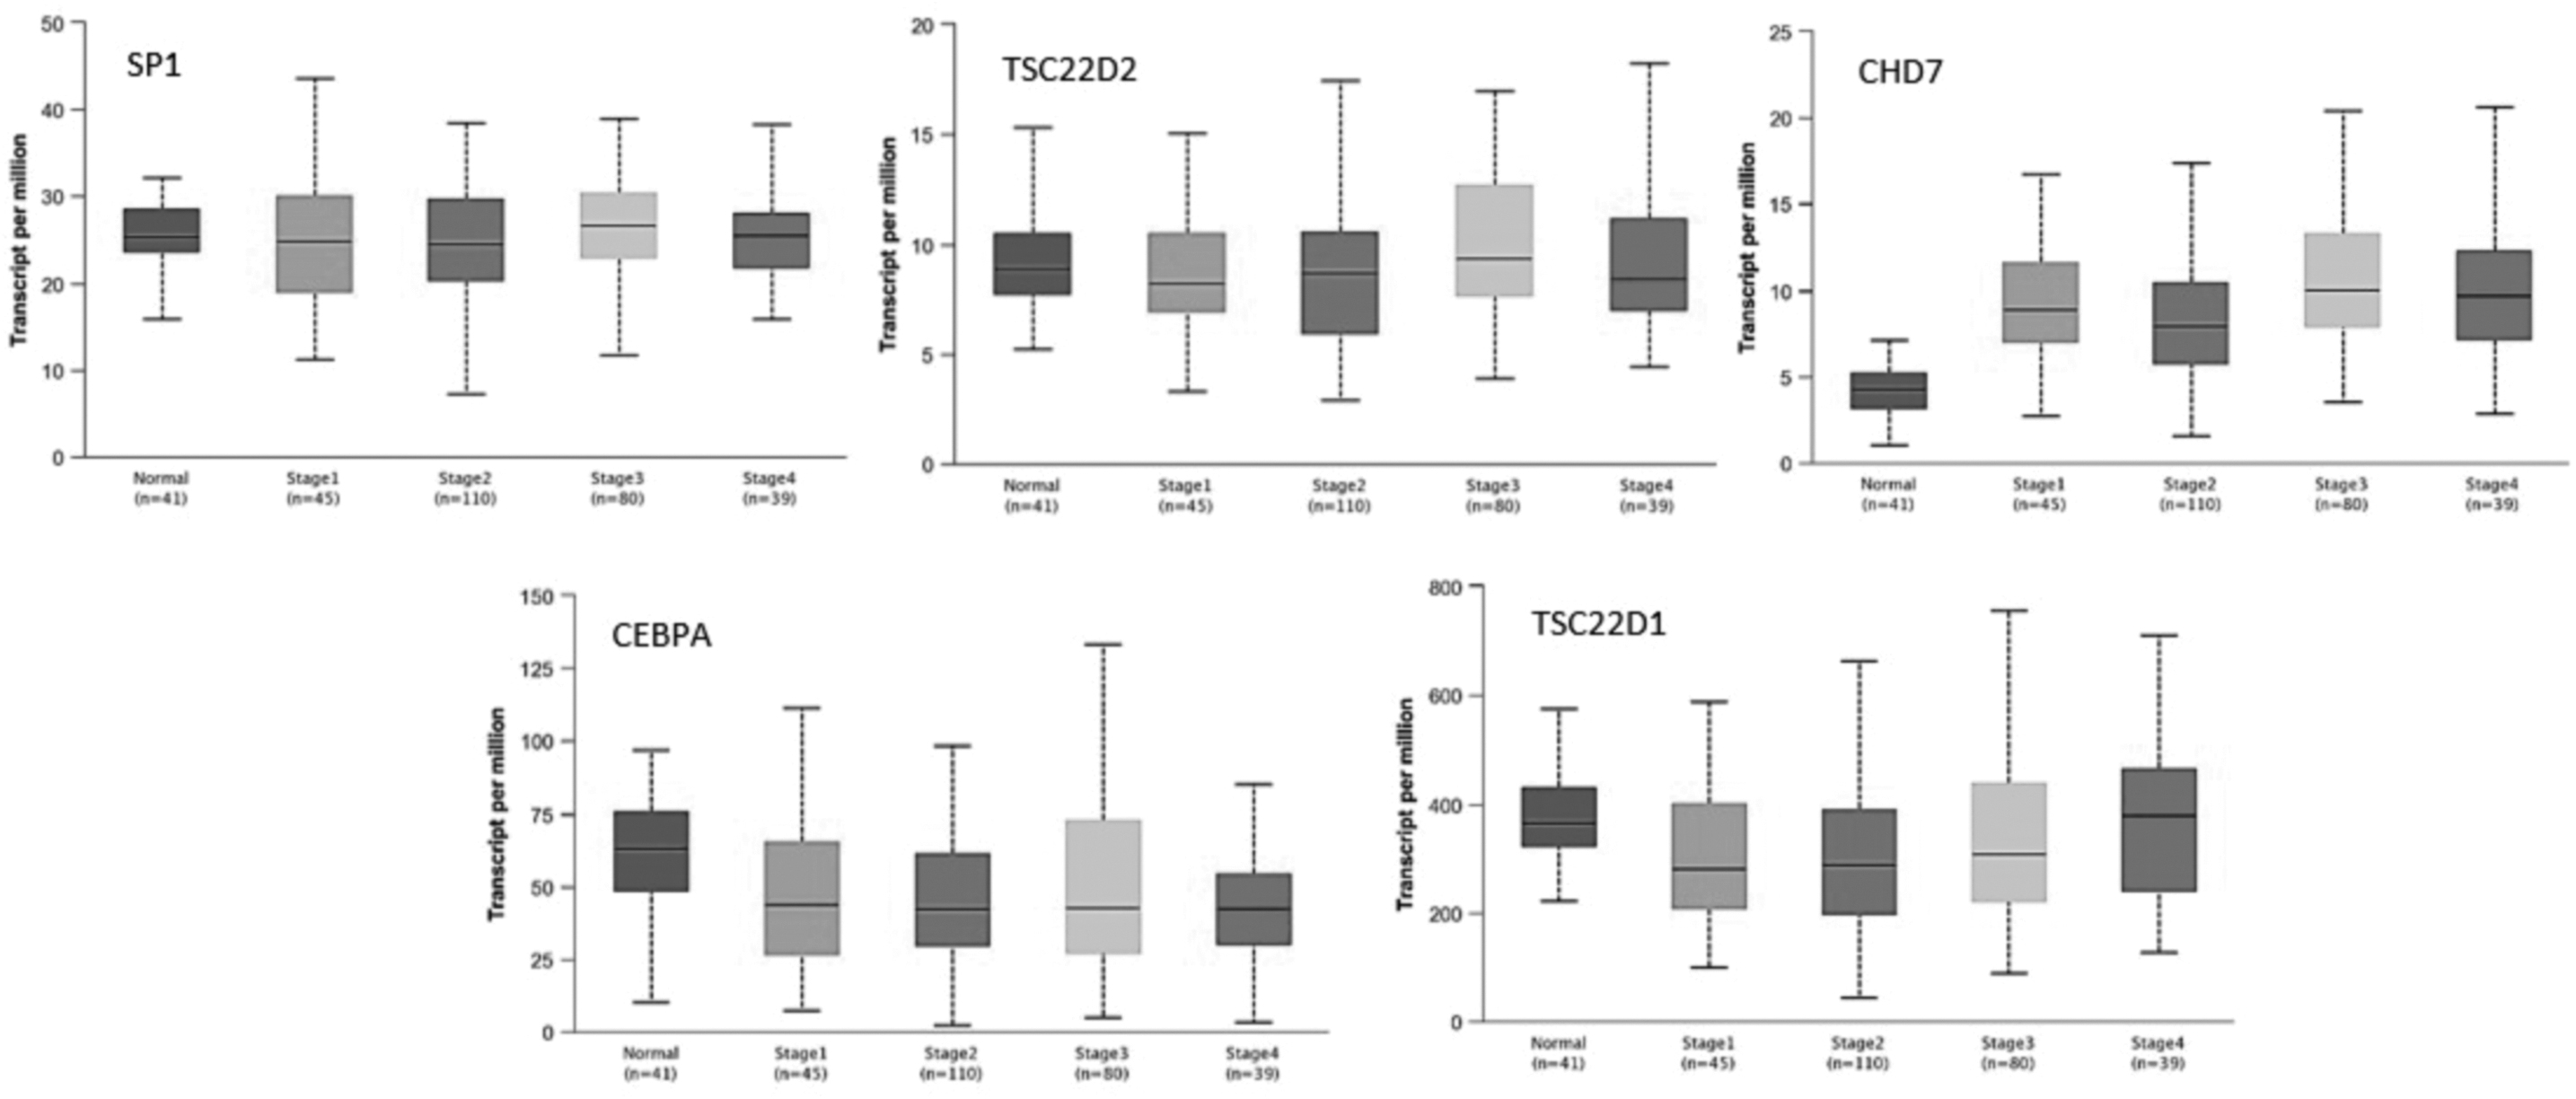
The stage plot demonstrates the expression level of five candidate genes in stages1, 2, 3, and 4 of colon cancer compared to normal samples (by UALCAN).
The observed high expression of CHD7 in stage plot verified the results of dot and box plot, while high expression of CEBPA, observed in dot and box plot, was in contrast with the results of stage plot. Moreover, we observed that expression levels of TSC22D1 in stages 1, 2, and 3 of colon cancer were lower than normal samples, whereas its overexpression in stage 4 was remarkable (Figs. 4–6). By Kaplan–Meier plots, we compared the overall survival rate of colon cancer patients due to the high and low expression of SP1, TSC22D2, CHD7, CEBPA, and TSC22D1 genes. The results indicated that among these candidate genes, high expression of CEBPA has positive effect on patient survivability (Fig. 7), verifying the results of CEBPA stage plot (Fig. 6). Finally, using scatter plots, we demonstrate the positive correlation among candidate genes in colon cancer (Supplementary Figs. S1–S5).
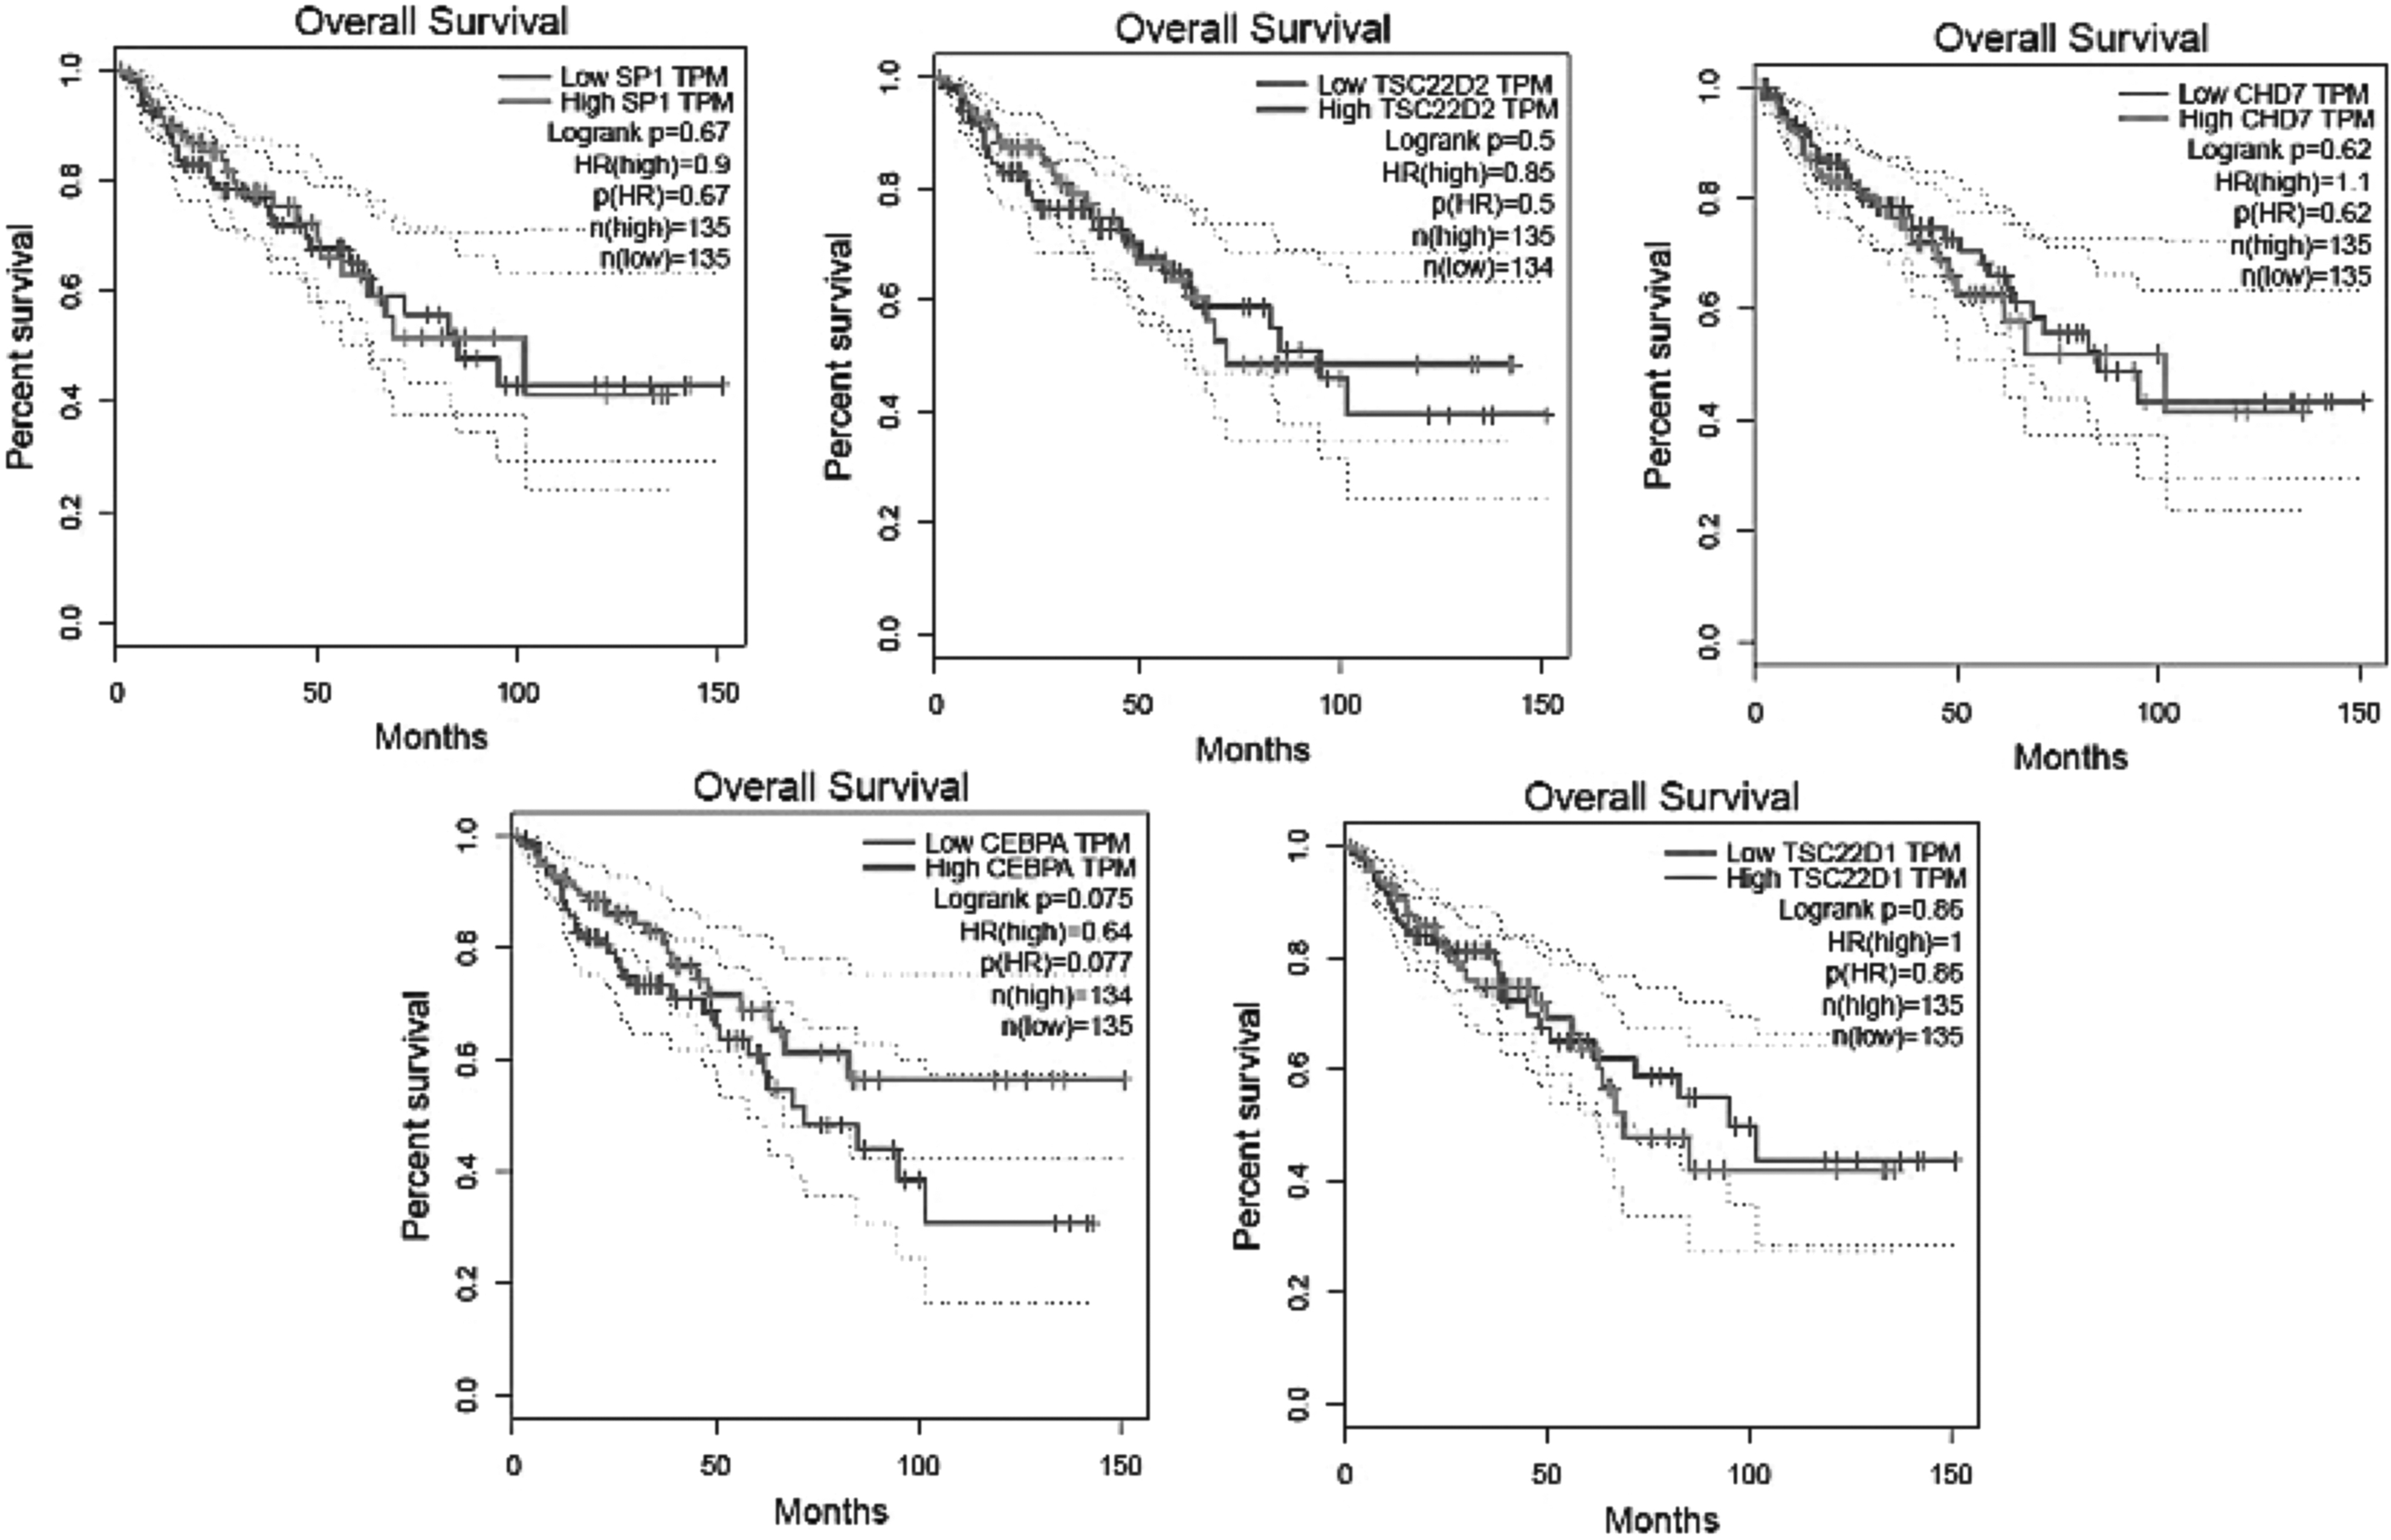
The Kaplan–Meier plot illustrates the impact of five candidate genes on overall survival rate of patient with colon cancer (by GEPIA2). Low and high TPM are demonstrated in all graphs.
Discussion
The availability of cell-culture models that are amenable to virus infection is required to reveal pathways that are relevant for viral pathogenicity. The considerable SARS-CoV-2 replication has been observed in Calu3 (pulmonary) and Caco-2 (intestinal) cell lines, indicating these anatomical sites (respiratory and GI tracts) as the suitable place for viral replication in humans (Wu et al., 2020b). Caco-2 is a human colon carcinoma cell line that exhibits a phenotype similar to the enterocytes of the small intestine (Hoehl et al., 2020). This cell line was extensively used to study infection with SARS-CoV and can be studied for SARS-CoV-2 infection (Bojkova et al., 2020).
In the study conducted by Bojkova et al. (2020) and reported in May 2020, a human cell-culture model of COVID-19 was established by infection of Caco-2 cells with a clinical isolate of SARS-CoV-2. They used translatome and proteome proteomics techniques to determine the infection profile of SARS-CoV-2 at different time points after infection and identified the host cell pathways that are modulated by SARS-CoV-2; they also showed that inhibition of these pathways prevents viral replication in human cells (Bojkova et al., 2020).
In the current study, DEGs in Caco-2 cells due to SARS-CoV-2 infection obtained from Bojkova's et al. (2020) study were used as a cell-culture model of the GI tract to analyze regulatory motifs network using bioinformatics tools. We hypothesized that a set of FFL motifs, contain two regulatory elements (TFs and miRNAs), are involved in gene expression pattern of the GI tract cells, infected by SARS-CoV-2, that finally contributes to GI damage. TFs involve gene expression at the transcription level, while miRNAs play roles at the posttranscriptional level (Qin et al., 2015). The TFs and miRNAs usually play roles in different biological processes and consequently in the progress of various diseases (Qin et al., 2015). In recent years, different miRNAs have been considered as promising diagnostic cancer biomarkers (Hayes et al., 2014; Kim et al., 2011; Yang et al., 2015).
Bastaminejad et al. (2020) investigated the diagnostic potential of miR-135b in serum and stool of colorectal cancer (CRC) patients and showed that the sensitivity/specificity of this miRNA in serum and stool of CRC samples were 92.7%/89.7% (AUC: 0.929) and 92.7%/87.2% (AUC: 0.919), respectively. Their study suggested that the expression levels of miR-135b in serum and stool can be potentially applied as a CRC diagnostic biomarker (Bastaminejad et al., 2020). Other study, performed on the correlation between expression levels of DCLK1 (Doublecortin-like kinase 1) and miR-15a and miR-137 in CRC, indicated the co-occurrence of DCLK1 and miR-15a and miR-137 in this cancer. This study suggested the DCLK1 gene as a promising CRC stem cell marker, dependent to miR-15a and miR-137, regulating tumor progression and invasion (Razi et al., 2021).
We used FANMOD software to detect the TF-miRNA-target gene motif (Table 2) and Cytoscape software to construct and then analyze the regulatory network based on this motif (Fig. 2B). We identified SP1, TSC22D2, POU2F1, REST, NFIC, CHD7, E2F1, CEBPA, TCF7L2, and TSC22D1 as crucial genes of motif, which among them SP1, TSC22D2, and POU2F1 had the most degree and betweenness (Table 3). Gartel et al. (2000) indicated that transcription of p21 in Caco-2 cells is controlled primarily by the TFs Sp1 and Sp3 through the p21 promoter.
Their study suggested that induction of p21 transcription is modulated by Sp1/Sp3 interactions with the p21 promoter during Caco-2 differentiation (Gartel et al., 2000). TSC22D2 is a cancer-associated gene in a rare multicancer family, significantly downregulated in CRC. Overexpression of TSC22D2 reduces the level of nuclear PKM2 (pyruvate kinase isoform M2) and suppresses cyclin D1 expression that finally inhibits cell growth (Liang et al., 2016).
The TF Pou2f1 that expresses at higher protein levels in stem cells, including intestinal stem cells, promotes mitotic stability, glycolytic metabolism, as well as other characteristics of stem cell potency. In a chemical model of colon cancer, loss of Pou2f1 in the colon highly restricted the tumorigenicity. Pou2f1 is required for recovery after colon damage, also it has a potential effects in colon malignancy, with the outcome (pro-oncogenic or tumor-suppressive) dictated by tumor etiology (Vázquez-Arreguín et al., 2019).
The effective roles of viruses (oncogenic: EBV, HBV, HCV, HIV, and HPV and oncolytic: adenovirus, reovirus, vaccinia virus, and coxsackievirus) in different types of cancer has been proven and different mechanisms to justify the tumorigenesis of viruses have been proposed (Jyotsana and King, 2020). All these mentioned viruses play their tumorigenesis role by induction of genomic instability and alteration of the expression levels of vital cell regulatory elements such as miRNAs (Sadrabadi et al., 2021). A study from china reported that the high expression of ACE-2 in CRC patients increases their susceptibility to SARSCoV-2 infection rather than normal people (Dai et al., 2020). Besides, Bojkova et al. (2020) demonstrated differential expression gene profile of human colon carcinoma (Caco-2) cell line due to the SARS-CoV-2 infection.
Hence, in the last part of study, we focused on our crucial genes, which were identified in experimental study of Bojkova et al. (2020) (SP1, TSC22D2, CHD7, CEBPA, and TSC22D1). We evaluated the possible relationship between these five candidate crucial genes and colon cancer using GEPIA2 and UALCAN datasets. Both these datasets are web resource for analyzing the RNA sequencing data based on standard processing pipeline with easy access to TCGA as publicly available cancer OMICS data. Using scatter plots, we demonstrated the positive correlation among five candidate genes in colon cancer (Supplementary Figs. S1–S5). We compared the transcription levels of these five candidate genes in colon cancer using dot and box plots and demonstrated significant overexpression of CEBPA in colon cancer compared to normal colon tissues (Figs. 4 and 5).
While this was observed, overexpression of CEBPA was in contrast with the results of stage plot. Moreover, we observed low expression levels of TSC22D1 in stages 1, 2, and 3, whereas its overexpression was observed in stage 4 of colon cancer compared to normal samples (Fig. 6). The overall survival analysis indicated that among these candidate genes, higher expression of CEBPA has positive effect on colon cancer patient survivability (Fig. 7), verifying the results of CEBPA stage plot (Fig. 6).
Conclusion
A combination of data that represent various aspects of COVID-19 infection generates a unique resource, covering a wide spectrum of knowledge about SARS-CoV-2 and its interactions with the human host, which would guide researchers and physicians to find the most effective treatment options. Our study used bioinformatics tools to predict crucial genes associated with the regulatory network motifs, probably responsible for the SARS-CoV-2 effects on the GI tract. By analysis of regulatory elements obtained from limited experimental studies and public databases, we reached some crucial hub genes in association with the colon cancer. Therefore, our results predict that the SARS-CoV-2 GI infections may cause a serious risk in patients with colon cancer. Hence, further studies on these genes and their pathways relevant to SARS-CoV-2 infection are recommended.
Footnotes
References
Supplementary Material
Please find the following supplemental material available below.
For Open Access articles published under a Creative Commons License, all supplemental material carries the same license as the article it is associated with.
For non-Open Access articles published, all supplemental material carries a non-exclusive license, and permission requests for re-use of supplemental material or any part of supplemental material shall be sent directly to the copyright owner as specified in the copyright notice associated with the article.