
Abstract
Dental pulp stem cells (DPSCs) and stem cells from human exfoliated deciduous teeth (SHED) are a source of mesenchymal stem cells with the potential to differentiate into several cell types. We initially isolated SHED cells and compared their osteogenic capacity with commercially available DPSCs. Both cells exhibited similar capacities of growth and osteogenic differentiation. A fourfold to sixfold increase in endogenous microRNA26a (miR26a) expression during osteogenic differentiation of preosteoblasts and a similar but attenuated increase (twofold to fourfold) in differentiating SHED was observed, suggesting a role in the process. We, therefore, overexpressed miR26a in SHED to determine if the osteogenic differentiation capacity can be potentiated in vitro. SHED with a threefold increase in miR26a expression showed increased growth rate when compared with parent cells. When exposed to an osteogenic differentiating promoting medium, the miR26a overexpressing cells showed 100-fold increases in the expression of bone marker genes such as type 1 collagen, alkaline phosphatase, and Runx2. The mineralization capacity of these cells was also increased 15-fold. As miR26a targets regulate several bone-specific genes, we evaluated the effect of miR26a overexpression on established targets. We found a moderate decrease in SMAD1 and a profound decrease in PTEN expression. miR26a could potentiate its effect on osteoblast differentiation by its ability to inhibit PTEN and increase the viability of cells and their numbers, a process essential in osteoblast differentiation. Our studies suggest that the upregulation of miR26a can increase bone formation and may serve as an important target to further investigate its potential in tissue engineering applications.
Introduction
Bone marrow and embryonic stem cells have been touted for their pluripotent capacity to differentiate into many tissues, and in recent times easily isolatable dental stem cells have been studied for their abilities to differentiate to other cell types (Kolios and Moodley, 2013). Dental pulp stem cells (DPSCs) are isolated from the pulp of adult teeth, and are the most researched dental mesenchymal stem cells (Morsczeck and Reichert, 2018). Stem cells from human exfoliated deciduous teeth (SHED) are similar to DPSCs but are isolated from deciduous teeth of children.
Bone remodels throughout life and is a tightly regulated process requiring sequential osteoblast-mediated bone formation coupled to osteoclast resorption. Osteoblasts are derived from mesenchymal stem cells, which proliferate into preosteoblasts that differentiate further into matrix producing osteoblasts. These cells express several matrix proteins such as collagen type 1a, alkaline phosphatase (ALP), osteopontin, osteocalcin (OCN), and other proteins that eventually undergo mineralization due to hydroxyapatite formation. This process is aided by several transcription factors, the chief among them being runx2 (Cbfa1) and osterix (Sp7) (Chan et al., 2021). While regulation of bone formation is mediated through such classical mechanisms, microRNAs have been shown to be important especially in bone tissue to maintain bone mass (van Wijnen et al., 2013).
MicroRNAs are short single-stranded, noncoding RNA sequences that range from 18 to 22 nucleotides in length that regulate protein encoding genes (Hensley and McAlinden, 2021). MicroRNAs can repress gene expression by directly inhibiting or degrading their target genes. Several microRNAs have proven capable of inducing osteoblast differentiation of mesenchymal stem cells (Hensley and McAlinden, 2021). The microRNAs repress the activation of multiple genetic pathways and lead to the increased ability of certain mesenchymal stem cells to differentiate into osteoblast-like cells.
Among the microRNAs, microRNA26a (miR26a) is highly conserved and ubiquitously expressed with important roles in several osteoblast growth and differentiation pathways (Hensley and McAlinden, 2021; Li et al., 2021; Zhang et al., 2019). This miRNA has also been detected in different tumor tissues and several roles in proliferation, differentiation, and apoptosis have been attributed to it (Huse et al., 2009; Sahu et al., 2017; Wang et al., 2019; Ye et al., 2020). In mesenchymal stem cells, miR26a behaves as an anabolic osteogenic factor by regulating several bone-specific genes during differentiation (Li et al., 2015). In an investigation of p53-related miRNA during osteoblast differentiation, we found differentiation-related robust changes in miR26a (Shah et al., 2021 and unpublished observations). The effect of miR26a has not been extensively studied in dental mesenchymal stem cells.
As it is well known that microRNAs have the potential to regulate specific genes, these targets appear to vary depending on the type of stem cell studied (Su et al., 2015). In this work, we demonstrate that not only does miR26a promote osteogenesis in SHED, but targets that aid osteoblast differentiation are also different from that seen in other tissue-derived stem cells (Li et al., 2021).
Materials and Methods
Sample collection and cell isolation
Human dental pulp tissue from deciduous teeth of 7–8-year-old children was obtained from the Midwestern University Multispecialty clinic from healthy patients who required extractions. Tooth collection followed a protocol approved by the Institutional Review Board of Midwestern University. Following extraction and isolation, the teeth and dental pulp were transported from the multispecialty clinic to the laboratory in Hank's balanced salt solution media, where stem cells were isolated from the dental pulp tissue. For studies comparing the isolated SHED, we used commercially available human DPSCs from Lonza Biosciences (Cat No. PT5025) and grew them according to the manufacturer's recommendations.
Cell culture
Using aseptic techniques, the dental pulp tissue from deciduous teeth was digested with collagenase type 1 for 60 minutes at 37°C. Single-cell suspensions were prepared and washed with sterile phosphate-buffered saline (PBS) and cultured. The cells were placed in α-minimum essential media (α-MEM) with 20% fetal bovine serum (FBS), amphotericin B (Gibco), and incubated at 37°C in 5% CO2/95% air. The media were replaced every 5–7 days, after initial culturing. Once cells were 75% confluent, they were enzymatically digested by trypsin, centrifuged, and split at a ratio of 1:10. The passage of each cell type was recorded and did not exceed past 10 passages.
DPSCs were used to compare our isolated SHED and were obtained from Lonza (Lonza No. PT-5025). These cells were maintained in media similar to SHED. MC3T3-E1 is a preosteoblast cell line (ATCC No. CRL 2594), which was used to compare miRNA expression in osteoblast cells. These cells were grown in α-MEM with 10% FBS.
Fluorescence-activated cell sorting
SHED were expanded in regular growth media and subjected to cell sorting. Antibodies specific for mesenchymal stem cell surface markers were incubated with cells followed by several washes and resuspension in PBS/Bovine Serum Albumin (PBS/BSA) for flow analysis. The following antibodies were used: CD44-FITC (Life Technologies), CD166-PE and CD34-FITC (Sino Biological), and CD11b-FITC (eBioscience). Antibodies were used at a 1:500 dilution. Data were acquired within 24 hours of suspension using the CytoFLEX flow cytometer according to the manufacturer's protocol.
Cell proliferation assay and cell cycle analysis
The growth rate of isolated SHED was compared with commercially available DPSCs. Each line was plated in triplicate. For cell proliferation analysis, cells were exposed to serum-free media for 24 hours after they reached 70% confluency followed by serum stimulation for 24, 48, and 72 hours. Cells were grown to 70% confluency and subjected to cell cycle analysis after staining with propidium iodide followed by analysis using a CytoFLEX flow cytometer.
Osteogenic differentiation and alizarin red S assay
To induce osteogenic differentiation, dental stem cells were initially cultured in α-MEM with 10% FBS at 1.5 × 10⁵ cells/plate in standard six-well plates (9.6 cm2). When the cells were 80%–90% confluent, they were exposed to differentiation promoting (DP) media. DP media contained basal media (10% FBS with α-MEM), 50 μg/mL ascorbic acid, and 10 mM β-glycerophosphate, which is the media we routinely use to study osteogenic differentiation with preosteoblast cells such as MC3T3E1 (Couture et al., 2013). The cells were incubated for a maximum of 28 days. DP media were replaced every 2 days.
Osteogenic differentiation and mineralization were measured using alizarin red S staining assays (Millipore In Vitro Osteogenesis Assay Kit). The manufacturer's recommended protocol was followed. Alizarin red S (pH 4.3) staining was followed by several rinses to reduce nonspecific staining. Stained cells were visualized using a Nikon Eclipse Ti2-E Inverted Fluorescence Microscope.
Quantification of alizarin red stain was done using the manufacturer's recommended protocol. Absorbance was measured using a NanoDrop 2000 (Cat. No. ND-2000; Thermo Scientific) for the alizarin red S standards, samples, and blanks. Standard curves were generated after reading at 405 nm absorbance as a function of dye concentration. The concentration of alizarin red S and occurrence of mineralization were determined using these standard curves.
RNA extraction, purification, and quantification
Total RNA was extracted using the TRI Reagent. The resultant RNA pellet was washed and resuspended in RNase-free water and quantified. The quality of the RNA was monitored using NanoDrop and only RNA with a 260/280 ratio above 1.8 was used. For miRNA analyses, total RNA was purified using miRNeasy mini kits (Qiagen, Valencia, CA, USA).
Transfection and detection of SHED with miRNA26a
SHED were electroporated with the miR26a plasmid using the Amaxa Nucleofector® II device. Resuspended cells in a Nucleofector solution were mixed with DNA containing miR26a. The plasmid containing miR26a with GFP tag was a gift from Dr. Joshua Mendell and was obtained from the repository Addgene (Plasmid No. 21894) (Kota et al., 2009). Control cells received the empty plasmid containing the green fluorescent protein cDNA. For generation of stable clones overexpressing miR26a, we included a vector carrying a neomycin resistance gene (pCIneo) with the plasmids mentioned above. After transfection, cells were initially sorted for the presence of GFP and then placed on a selection media containing G418. Resistant cells were collected and expanded. Confirmation of overexpression of miR26a was done by real-time PCR.
Several single-cell clones were created and tested for the level of overexpression using the quantitative real-time PCR method. The level of overexpression was periodically confirmed before use in all experiments.
Quantitative real-time PCR for mir26a
This was done after conversion to cDNA using the Mir-X miRNA first-strand synthesis kit (TaKaRa Biotechnology, USA). Real-time quantitative PCR was performed with an miR 26a-5p-specific forward primer TTCAAGTAATCCAGGATAGGCT), and a universal reverse primer (supplied with the miR-X miRNA First-Strand synthesis and TB Green Advantage qPCR Premix kit (TaKaRa). We used U6 as an endogenous control miRNA. The fold change of miRNA expression when compared with control was determined using the ΔΔCt method.
Treatment with miR26a antagomir
Knockdown of miR26a was accomplished using a commercially available synthetic inhibitor (anti-miR26a-5p) or miRNA inhibitor scrambled control (Genecopoeia, Guangzhou, China). Fifty nanometers of miR26a-5p inhibitor or scrambled control was transfected using Effectene (Qiagen) according to the manufacturer's protocol. After transfection, samples were transferred to 10 cm2 plates placed in a humidified 37°C/5% CO2 incubator. Protein and/or RNA were isolated from the cells 48–72 hours after transfection.
Quantitative real-time PCR for detection of gene expression
Cells were exposed to DP media for 0, 2, 4, 6, and 8 days as described above. Each dental stem cell line was compared in triplicate. Equal amounts of RNA were then taken from each sample and reverse transcribed to generate cDNA using the EasyScript Plus cDNA Synthesis Kit (Lamda Biotech). cDNA was then combined with PowerSYBR® Green 2 × Master and primers. The following gene primers were used: ALP, ALP (H) F: CCACGTCTTCACATTTGGTG R: ATGGCAGTGAAGGGCTTCTT, collagen type-I alpha-I (COL1A1), COL1A1 (H) F GTG CTA AAG GTG CCA ATG GT R: CTC CTC GCT TTC CTT CCT CT, OCN OCN(H) F: GGCAGCGAGGTAGTGAAGAG R: GCCGATAGGCCTCCTGAAAG, and runt-related transcription factor (RUNX2), RUNX2 (H) F: CAG ACC AGC AGC ACT CCA TA R CAG CGT CAA CAC CAT CAT TC, glyceraldehyde-3-phosphate dehydrogenase (GAPDH) GAPDH (H) F: CATCATCCCTGCCTCTACTG R: GCCTGCTTCACCACCTTC.
Primers for stem cell markers are as follows. Oct4(H) F: GTGGAGAGCAACTCCGATG, R: TGCTCCAGCTTCTCCTTCTC; Nanog(H) F: ATTCAGGACAGCCCTGATTCTTC, R: TTTTTGCGACACTCTTCTCTGC; Sox2(H) F: GACTTCACATGTCCCAGCACTA R: CTCTTTTGCACCCCTCCCATT.
Real-time PCR included a 10-minute activation step at 95°C. Forty cycles then occurred at 95°C for 15 seconds and then at 60°C for 60 seconds. The plate was analyzed on Step One Plus Real Time PCR System (Life Technology, USA). Fold changes of RNA expression levels were calculated by the ΔΔCt method and transcript levels were normalized to GAPDH as an internal control. Melt curves were done on all primers, and primers that only produced one peak were utilized.
Western blotting and protein analysis
Cells were lysed with buffer, containing 50 mM DTT, 2% sodium dodecyl sulfate (SDS), 10% glycerol, 65 mM tris–HCl pH 6.8, with protease inhibitor cocktail (cOmplete ULTRA Tablets Mini Roche protease inhibitor). The lysate was collected and sonicated with a Bioruptor 300 (Diagenode, NJ, USA). Protein concentrations were measured, and a standard curve was generated using a Pierce BCA Protein Assay Kit (Thermo Scientific). We obtained the following antibodies from Cell Signaling: anti-beta catenin (#198075), SMAD1 (#69445), GSK beta (#9832), pGSKBeta (#5558), PTEN (#9552) Runx2 (#125565) Coll1A1 (#720265) Oct 4 Proteintech #60242), Nanog (CPTCNanog1 -DSHB, Iowa city), and Sox2 (Proteintech #11064-1). GAPDH was obtained from Proteintech (#60004).
SuperSignal® West Pico Chemiluminescent Substrate (Thermo Scientific) was used to visualize the membrane using the Bio-Rad ChemiDoc MP Imaging System (Bio-Rad, CA, USA). Primary and secondary antibodies were used at 1:1000 and 1:10,000 dilutions, respectively.
Luciferase assays
Luciferase assay for Wnt and SMAD1 activity was conducted with TOPFLASH and SMAD1 luciferase construct, respectively (a kind gift of Dr. B. Vogelstein, (Addgene Plasmid No. 16495) using Bright-Glo (Promega, WI, USA) and measured with a GLOMAX 20/20 Luminometer. Transfections were carried out on SHED (control) or SHED26a using SuperFect (Qiagen) according to the manufacturer's recommendations. Transfected cells were maintained in regular media. Forty-eight hours after transfection, cells were trypsinized, pelleted, and then resuspended in serum-free media. An aliquot was used to count cells for normalization, and the rest assayed using the Promega Bright-GloTM Luciferase Assay Kit (Cat. No. E2610; Promega). Equal volumes of the resuspended cells and Bright-GloTM were mixed and incubated for 2 minutes. Samples were read for 10 seconds, each after a 2-second delay. Luciferase readings for each of the samples were then normalized according to the number of cells per milliliter.
All measurements were carried out on triplicate samples, and experiments were repeated at least thrice.
Statistical analyses
All experiments were conducted three times and data were presented as mean ± standard deviation (SD) of triplicate samples. Statistical analyses were done using GraphPad Prism 8.00 (GraphPad Software, Inc., CA, USA). Comparisons between groups were made using the Student's t-test or one-way multivariate analysis of variance (ANOVA) followed by Tukey's multiple comparison test. p < 0.05 was considered to indicate a statistically significant difference.
Results
Isolation and characterization of SHED
The expression of stem cell markers on SHED was analyzed by flow cytometry. Some of the mesenchymal surface markers known to be present on SHED (Al Madhoun et al., 2021; Nowwarote et al., 2020; Sukarawan et al., 2016) are expressed in a low percentage of cells, while some of them have been shown to be consistently expressed (Al Madhoun et al., 2021; Nowwarote et al., 2020; Sukarawan et al., 2016). We found SHED to show a high degree of expression of CD44 and CD166 (98% and 56%) These cells are also known to lack CD34 and CD11b (Al Madhoun et al., 2021) and our results were consistent with this observation (Fig. 1A).

To determine if these cells were undifferentiated and had “stemness,” we tested this population of SHED and compared them with a commercially obtained DPSC line as a control. Quantitative real-time PCR demonstrated that both cells expressed the markers Sox, Nanog, and Oct4 (Fig. 1B). SHED expressed Nanog and Oct4 at a higher level than DPSCs, while Sox expression was 50% of that seen in DPSCs (Fig. 1B). These results were confirmed when the protein levels of these proteins were analyzed in these cells (Fig. 1C).
Cell cycle kinetics was undertaken for both cells and, as shown in the figure, SHED cells had a comparable cell cycle distribution profile as DPSCs (Fig. 1D).
Osteogenic capacity of SHED cells
DPSCs and SHED were exposed to an osteogenic DP media for 1, 2, 3, and 4 weeks for calcium deposits using alizarin red S staining, as described under the Materials and Methods section. Both cell types exhibited a robust ability to mineralize as seen by an increasing red stain on the mineralized matrix (Fig. 1E).
Expression of miR26a is increased during osteogenic differentiation
In an attempt to determine if we could potentiate the osteogenic capacity of SHED cells, we chose to study miR26a as several observations have suggested a bone-specific, positive regulatory role for this miRNA (Li et al., 2013; Luzi et al., 2012; Shah et al., 2021; Yu et al., 2019; Zhang et al., 2019). To first determine if endogenous miR26a expression is modulated during differentiation, we used MC3T3 E1 preosteoblasts, which are the model murine cells that are used for in vitro osteoblast-specific differentiation and comparable with human osteoblasts in their gene expression profiles (Quarles et al., 1992). MC3T3 E1 cells were exposed to DP media for different lengths of time, and expression of miR26a was monitored by quantitative PCR. As shown in Figure 2, there was a sixfold-to-tenfold increase in miR26a expression that persisted for the length of time the cells were exposed to DP.
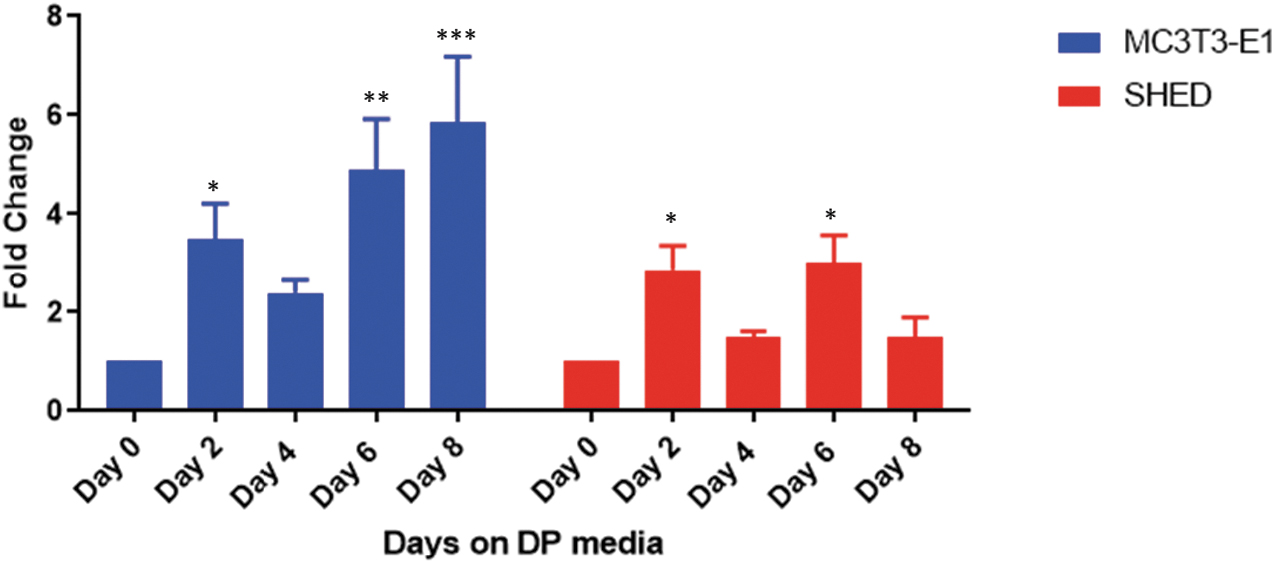
Comparison of miR26a expression during in vitro osteoblast differentiation. To determine how miR26a expression changes with osteoblast differentiation, we exposed MC3T3E1, an established osteoblast-like cell line to DP media and the isolated microRNA at the different time intervals and compared them to SHED treated similarly. The experiment represents the average of three separate measurements. ***p < 0.001, **p < 0.01, *p < 0.0.05 compared with day 0. DP, differentiation promoting; miR26a, microRNA26a.
A similar treatment of SHED produced a fourfold significant increase within 2 days and sustained at twofold-to-fourfold levels during the rest of the treatment period. This suggested that miR26a is likely to be important during differentiation and an increase in expression to levels seen in preosteoblasts might aid in the differentiation capacity. Based on this evidence, we stably expressed miR26a in SHED for further analysis and characterization.
Overexpression of miR26a in SHED cells
SHED were transfected with an empty vector or miR26a plasmid as described under Materials and Methods section, and antibiotic-resistant cells were pooled and tested for their level of miR26a expression. As shown in Figure 3A, cells with introduction of miR26a showed a threefold increase in their expression (SHED26a) when compared with cells receiving the empty vector sequence (represented as SHED). Growth rates were also different with SHED26a showing a significant increase in growth potential (Fig. 3B). This was also mirrored when we studied their cell cycle distribution. A larger population of SHED26a were in the S and M phase when compared with control cells (48% vs. 26%), suggesting that the introduction of miR26a has provided them with a distinct growth advantage (Fig. 3C).

Increased expression of bone markers with upregulation of miR26a
The original SHED and SHED26a were compared for their osteoblast differentiation-specific gene expression after exposing them to the DP media for 2, 4, 6, and 8 days (Fig. 3D). Runx2 (Cbfa1) is an important bone-specific transcription factor critical for formation of mineralized tissue. While SHED showed a gradual increase with differentiation to a maximum of threefold elevation, introduction of miR26a produced a dramatic increase of about 100-fold elevation on day 8. Collagen 1A1 is an early marker as it is the predominant matrix protein that is deposited during the matrix development phase of differentiation. As seen in Figure 3D, SHED showed a moderate increase in this marker that ranged over time to be in a onefold-to-fourfold range.
However, in miR26a overexpressing cells, the levels reached were much higher with a 23-fold increase on day 2 and a less dramatic increase that ranged from 4- to 14-fold during the rest of the treatment period. ALP activity is important for the formation of hydroxyapatite and necessary for generation of inorganic phosphate to facilitate the mineralization of the matrix. As expected, there was a twofold-to-fourfold moderate increase during differentiation in SHED. In SHED26a, this activity ranged from 10 to 70 fold. OCN is the most abundant noncollagenous protein in bone and is only expressed in osteoblasts. It is also a bone-specific matrix protein made late during the differentiation process and functions as a calcium binding protein.
We have shown in previous studies that the absence of OCN expression prevents mineralization of the matrix (Chandar et al., 2005). As seen in Figure 3D, a fourfold increase is seen in control cells on day 8 of differentiation. The profile seen in SHED26a indicates that there is a twofold increase early during differentiation that is sustained for 8 days, but no substantial changes when compared with control are seen. It is likely that the short treatment period may not reflect additional changes to expression as this protein is secreted late during the differentiation process coinciding with the matrix mineralization phase. Our results below with matrix mineralization indicate that this is a likely possibility. A Western blot showing increased expression of some of the markers (runx2 and collagen1A1) demonstrates the ability of miR26 to produce quantitative changes in the proteins tested (Fig. 3E).
Inhibition of miR26a reduces expression of bone markers
Inhibition of miRNA expression was monitored after transfection with an expression vector containing the miR26a inhibitor (antagomir). Total miRNA was isolated after treatment. A 40% decrease in miR26a was observed (Fig. 3F inset), which was accompanied by a significant decrease in the expression of three of the four bone markers tested (Fig. 3F), showing that a reduction in miR26a reduced the ability of these cells to express bone markers. For comparison, we included a transient overexpression using miR26a vector that was previously used to create cells stably expressing miR26a. To differentiate this transient transfection of miR26a from other data with overexpressing clones (SHED26a), these cells are indicated as SHED26aOE in Figure 3F.
Increased bone mineralization of SHED26a cells
Bone mineralization capacity of SHED 26a was compared with the parent SHED using alizarin red S staining. Extraction and quantitation of the stain showed that SHED26a demonstrated a steady increase in the mineralization capacity when compared with the parent line, and this pattern was seen during the entire treatment period (Fig. 3G). At the end of the treatment period (4 weeks), a 15-fold increase over the parent line in their mineralization capacity. This demonstrates that miR26a is able to improve mineralization of the osteoblast matrix, the final step in the process of differentiation.
miR26a targets in osteoblast differentiation
To investigate the molecular basis of miR26a's ability to increase the osteoblast differentiation capacity, we tested three well-established targets of miR26a. SMAD1, GSK beta, and PTEN (Li et al., 2021; Luzi et al., 2012). The involvement of these genes has been experimentally tested, and they are bona fide targets especially in osteoblast differentiation. Other studies that have looked at stem cells from adipose-derived versus bone marrow-derived sources have shown activation of distinctly different pathways, suggesting tissue-specific differences in the derived stem cells (Luzi et al., 2008; Su et al., 2015). We looked at the Wnt pathway as this pathway is targeted by several microRNAs in the regulation of differentiation (Hensley and McAlinden, 2021). If GSK beta is targeted by miR26a, it would increase active beta catenin levels and their signaling through the canonical Wnt pathway.
To detect activation of the Wnt pathway, we used a promoter reporter construct that contained sequences specific for TCF/LEF binding sites upstream of a modified firefly luciferase gene (Chandar et al., 2005). As seen in Figure 4A, there was no difference in the endogenous Wnt pathway activity in miR26a overexpressing cells. Addition of exogenous beta catenin increased TCF/LEF activity twofold in both cell types. Analysis of the protein players of the Wnt pathway showed no difference with overexpression of miR26a. In fact, if miR26a targeted GSK-beta expression, we would have expected to see an increase in active beta catenin expression and a reduction in total GSK-beta expression.

Analysis of targets of miR26a:
This suggested that at least in dental stem cells, GSK-beta is not targeted by miR26a, and an increased beta catenin expression may not be the mediator of the osteogenic potential seen with miR26a overexpression. SMAD1 is known to be a positive regulator of osteoblast differentiation (Chan et al., 2021) and miR26a is known to target SMAD1 expression to inhibit osteoblast differentiation. We did notice a 30% reduction in SMAD1 DNA binding activity as measured using a reporter construct containing the SMAD1 binding sites and a similar reduction in protein levels when measured by Western blotting (Fig. 4C, D). This suggests that SMAD1 is targeted by miR26a in dental stem cells and this observation cannot explain the increased osteogenic capacity of miR26a we see in our studies.
There was a much more profound (70%) decrease in PTEN expression in SHED26a showing that PTEN is likely targeted by miR26a in our cells. PTEN is a tumor suppressor gene that has been shown to be an important regulator of bone growth and differentiation (Liu et al., 2007). A loss PTEN expression if targeted by miR26a can potentiate osteoblast viability and their proliferation (Zou et al., 2022). Taken together, our data suggest that miR26a activation may result in a net positive effect on osteoblast differentiation by having differing effects on multiple targets (Fig. 4F).
Discussion
Stem cells from teeth represent an easy source of stem cells that can differentiate into multiple lineages (Morsczeck and Reichert, 2018). Since they can be made available by minimally invasive procedures such as teeth extraction and other orthodontic reasons, it has served as an attractive source of highly proliferative cells. In this study, we describe isolation of stem cells from deciduous teeth, which show a high proliferative rate, population doubling, and osteoblast differentiation capacity when compared with adult DPSCs. Attempts were made to further improve the osteogenic induction capacity of these cells using a specific miRNA.
While it is well known that microRNAs play a significant role in several aspects of tissue physiology, they are especially important in bone where remodeling happens throughout life and miRNAs have been well established to exert their epigenetic influence in the remodeling process (Hensley and McAlinden, 2021; Hong et al., 2021). In the case of miR26a, it has been suggested to be a positive regulator of bone differentiation in several studies (de Vasconcellos et al., 2020; Li et al., 2013; Luzi et al., 2012; Wang et al., 2015). However, our study combines the inherent differentiation potential of SHED with the stable overexpression of miR26a to demonstrate the feasibility of this approach to improve bone function. To do this, we have first characterized changes in endogenous miR26a in an in vitro bone model and extended this analysis to SHED exposed to a DP media.
We show a similar trend although a quantitatively smaller effect on miR26a with the selective media alone. To improve and create a therapeutic model for improving bone mass, we stably overexpressed the miRNA and characterized the effect. These observations provide additional insight into the contribution of miR26a as a potential vehicle to improve the osteogenic capacity.
When the genetic changes to miR26a overexpression were analyzed, it was interesting to note that it produced a dramatic increase in Runx2 transcription factor which is known to be a master regulator of osteoblast differentiation (Chan et al., 2021). Other markers of bone differentiation also showed profound changes in expression showing that miR26a has mostly anabolic actions in bone. The mineralization capacity of SHED was comparable with adult dental pulp cells without enhancement with miR26a, but addition of miR26a profoundly affected the formation of the mineralized matrix.
To understand potential targets of miR26a in SHED, we tested specific targets that have been established in prior studies.12,19,24 Targeted degradation of GSK-3Beta increases Wnt/beta catenin activity, a pathway important for osteoblast differentiation. Surprisingly, while GSK-Beta is a valid target, we did not find increased beta catenin activity in these cells. However, we found expected changes to targets SMAD1 and PTEN with overexpression of miR26a. SMAD1 is a positive regulator of osteoblast function and therefore a decrease in expression does not explain the positive effect on differentiation. The reduction in SMAD1 expression and function, however, was moderate, suggesting that this was sufficient to maintain a higher osteoblast function in these cells. This observation is also consistent with other reports where miR26a does not completely negate SMAD1 expression (Liu et al., 2016), suggesting that regulation of SMAD1 is complex.
It is also likely that SMAD1 activity undergoes modulation during the differentiation process and the steady-state levels seen may not accurately reproduce stage-specific changes that are potentially possible. The reduction in PTEN expression seen in SHED26a, however, is significant and is consistent with previous studies that have shown increased osteoblast proliferation and dense bones in PTEN-deficient mice (Liu et al., 2007). It is also important to note that our studies reflect the effect of stable overexpression of miR26a, which is likely to have altered the local environment in the cells to some extent, and would be distinct from transient overexpression. We have observed this to be true for other genes studied in the past (Couture et al., 2013). While the anabolic action of miR26a in osteoblasts is clear, the effect on targets appears to be specific to the tissue from which the stem cells were derived.
The miR26a target most affected in SHED appears to be PTEN, which is distinct from that noted for adipose-derived stem cells and bone marrow-derived stem cells, where GSK-beta and SMAD1 are the main players (Luzi et al., 2008; Su et al., 2015).
Our studies support the overall importance of miR26a in optimizing osteoblast function. MiRNA-based therapeutics for skeletal repair are an excellent option in principle. However, the question remains whether miR26a behavior may be considered oncogenic under certain conditions (Huse et al., 2009; Yu et al., 2019). These questions must be resolved before manipulations with microRNAs can serve as a therapeutic approach.
Footnotes
Acknowledgments
Some part of this represents work that was done in partial fulfillment of SK's Master's thesis. We are thankful to the Midwestern Core Facility for their help in the use of the Flow Cytometer.
Authors' Contributions
S.K. performed a part of the work described here in partial fulfillment of his Master's thesis. P.C. contributed reagents/materials. E.P. performed the experiments and analyzed the data. N.C. conceived, designed, and wrote the article.
Author Disclosure Statement
The authors declare they have no conflicting financial interests.
Funding Information
Research funds from Midwestern University to S.K. and N.C. are gratefully acknowledged.