
Abstract
Compared with mesenchymal stem cells (MSCs) obtained from other tissue sources, those derived from umbilical cord (UC) tissue exhibit numerous advantages and vast potential for therapeutic applications. However, MSCs from different tissue sources are heterogeneous, and therefore, the therapeutic efficacy of UC-derived MSCs as a replacement for other tissue-derived MSCs needs to be studied. To better understand the distinctions between UC-derived MSCs and MSCs derived from other tissues, we conducted a transcriptome analysis of MSCs obtained from UC and three other tissues. Correlation analysis revealed the strongest correlation between UC-MSCs (UC-MSCs) and bone marrow-MSCs (BM-MSCs). Compared with UC-MSCs, the lower differentially expressed genes of BM-MSCs, dental pulp-MSCs (DP-MSCs), and adipose tissue-MSCs (AP-MSCs) were predominantly enriched in actin-related terms, while higher differentially expressed genes were predominantly enriched in immunological processes. We also analyzed the distribution of 34 frequently or highly expressed cell characterization molecules in BM-MSCs, DP-MSCs, AP-MSCs, and UC-MSCs. CD200 (FPKM >10) was only detected in UC-MSCs, while CD106 was detected in AD-MSCs and DP-MSCs (FPKM >10). The reliability of transcriptomic data analysis was verified by quantitative real-time PCR. Finally, we recommend the use of CD200, CD106, and other similar markers with unstable expression as benchmark molecules to monitor the proliferation and differentiation potential of MSCs. This study provides comprehensive insights into the heterogeneity between UC-MSCs and MSCs derived from other tissues, which can guide the therapeutic application of UC-MSCs.
Introduction
Cell therapy with stem cell technology at its core is at the forefront of the medical revolution, emerging as a new treatment after drugs and surgery, and offering hope for the treatment of cancer, diabetes, hypertension, heart disease, Alzheimer's disease, and other diseases that are difficult to treat with conventional methods (Yamanaka, 2020). In recent years, mesenchymal stem cells (MSCs) have been the subject of the greatest research and clinical application. MSCs are essential adult stem cells and crucial members of the stem cell family. It is derived from the early mesoderm and has the ability to proliferate in vitro and differentiate in several directions. Under the control of the body, MSCs are able to migrate continually from the original tissue sites to new tissue sites and engage in tissue renewal and repair (Aggarwal and Pittenger, 2005; Lukomska et al., 2019).
In the 1970s, Friedenstein et al. discovered MSCs in bone marrow (BM) and described them as a group of adherent growth cells with fibroblast-like shape and clonal proliferation. Subsequently, Pittenger independently demonstrated the MSCs' capacity for multidirectional differentiation (Le Blanc and Pittenger, 2005; Pittenger, 2013). In 2006, the International Society for Cell Therapy (ISCT) provided the most fundamental description of MSCs, as well as the least stringent identification criteria: First, MSCs grow autonomously under standard culture conditions; Second, MSCs express CD105, CD73, and CD90, but not CD45, CD34, CD14, CD11b, CD79, CD19, or HLA-DR surface markers. Third, MSCs are capable of in vitro differentiation into osteoblasts, adipocytes, and chondroblasts (Dominici et al., 2006).
Blood vessels are associated with MSCs (da Silva Meirelles et al., 2009). As a type of trophoblast cells, they can exist in various tissues and promote the survival and development of several cell types. In addition to BM, fat, dental pulp (DP), and umbilical cord (UC) have been used to collect and prepare MSCs (Marquez-Curtis et al., 2015). However, the surface molecular features of MSCs derived from various sources vary substantially (Najar et al., 2012). Some investigations comparing MSCs from BM, UC, and adipose tissue (AP) reported that CD106 could not be detected in MSCs obtained from UC and AP, but existed in BM-derived MSCs (De Ugarte et al., 2003; Shafiee et al., 2011). Despite the fact that MSCs from different tissues can meet the minimum standards established by the ISCT, the results of numerous studies indicate that MSCs from different tissues are various, particularly in terms of cell size, proliferation potential, secreted cytokine type and quantity, and immunosuppressive capacity (Hass et al., 2011; Kozlowska et al., 2019; Raicevic et al., 2011).
Compared with BM, DP, or fat-derived MSCs, UC-derived MSCs have a greater capacity for expansion, even the frequency of MSC progenitor cells in the UC is comparable to or even lower than that observed in the BM, and the basic properties of MSCs do not change after amplification, allowing a large number of MSCs to be obtained from the same sample to meet the needs of clinical cell therapy. Furthermore, UC-derived MSCs have unique benefits compared with adult stem cells. It is mostly evident in the following aspects: UC-derived MSCs are more primitive progenitor cells with enhanced proliferation and differentiation capabilities; the UC contains a substantial number of stem cells that have a high in vitro proliferative capacity, low immunogenicity, are simple to isolate, and free of tumor cell contamination. It can be isolated from the UC of newborns to prevent the transmission of pathogenic germs such as bacteria and viruses, as well as the influence of acquired disorders.
Latent virus and pathogenic microorganism infection and transmission rates are relatively low. There shall be no harm or injury to the mother or newborn during collection. Its ethical implications are less problematic (Friedman et al., 2007; Nagamura-Inoue and He, 2014; Qiao et al., 2008).
Therefore, UC-MSCs are increasingly becoming the optimal replacement for BM and other sources of MSCs, have better application potential, and are garnering increasing interest (Chen et al., 2021; El Omar et al., 2014). Due to substantial changes in the internal milieu of MSCs from different tissues, there are also substantial differences between MSCs originating from distinct tissues. The objective of this study was to conduct comparative studies on the transcriptomes between UC-MSCs and AD-MSCs, DP-MSCs or BM-MSCs, to gain a better understanding of the heterogeneity between UC-MSCs and other tissue-derived MSCs and to explore the potential problems of UC-MSCs replacing other tissue-derived MSCs for clinical treatment.
Materials and Methods
RNA-seq data collection
Three available raw RNA sequencing datasets for UC-MSCs (SRR14203514, SRR14203515, SRR14203517), DP-MSCs (SRR6189574, SRR6189575, SRR6189576), BM-MSCs (SRR14879973, SRR14879974, SRR14879975), and AP-MSCs (ERR5037658, ERR5037659, ERR5037660) at passage 3 were retrieved from Sequence Read Archive in National Center for Biotechnology Information server.
Reads mapping and differently expressed gene analysis
Reads were quality filtered using FastQC, and then aligned to the Homo sapiens reference genome (version UCSC hg19) using HISAT (with default parameters). StringTie, which employs normalized RNA-seq read counts to estimate the relative abundances of transcripts as Reads Per Kilobase of exon per Million reads mapped, was used to assemble the aligned reads into transcripts (FPKM). FPKM estimates were determined by DEseq2 using a Generalized Linear Model assuming a negative binomial distribution, and differentially expressed genes were detected by pairwise comparisons with at least a twofold change (false discovery rate 0.05).
Differently expressed gene enrichment analysis
Based on GO (Gene Ontology) and KEGG (Kyoto Encyclopedia of Genes and Genomes) Pathway analyses, functional groups and pathways comprising the differently expressed genes (DEGs) were assayed. The GO enrichment analysis of DEGs was implemented using the clusterProfiler R package. To identify enriched biological processes (BPs), we performed an overrepresentation analysis based on a right-sided hypergeometric test with Bonferroni step-down as multiple testing correction (padj <0.05). The volcano plot was used to visualize differentially expressed genes between groups and was generated by the ggplot packages.
Cell culture
DP-MSCs (PT-5025) were purchased from Lonza (Switzerland) and then cultivated with DP Stem Cell BulletKit™ Medium (PT-3005; Lonza). The remaining tissue-derived MSCs were acquired from ATCC (Manassas, VA). In Minimum Essential Medium alpha GlutaMAX (Thermo Fisher Scientific) containing 10% fetal bovine serum (FBS), BM-MSCs (PCS-500-012) were cultivated (FBS). Cultured with MSC Growth Kit for Adipose and Umbilical-derived MSCs low-serum components (2% FBS) were UC-MSCs (PCS-500-010) and AD-MSCs (PCS-500-011). At 37°C and 5% CO2, cells were maintained in an incubator containing CO2.
All experiments in this study were approved by the committee of Xuzhou Central Hospital, approval no. 62021022128.
RNA isolation and cDNA library construction
Total RNA samples were isolated from BM-MSCs, AP-MSCs, DP-MSCs, and UC-MSCs using TRIzol reagent (Thermo Fisher Scientific) and then purified using the RNeasy Mini Kit (Omega). Genomic DNA contamination was removed from purified RNA by using DNase I (New England Biolabs, Ipswich, MA). Using a NanoDrop 2000 spectrophotometer, the RNA sample concentration was determined (Thermo Fisher Scientific).
For cDNA library creation, 1 μg of total RNA was employed. cDNA was generated with random and oligo d(T) primers using a First-Strand cDNA Synthesis Kit (TaKaRa) as per the manufacturer's instructions.
Quantitative real-time PCR validation
The RNA-Seq results were confirmed through analysis. The expression level of mRNA was quantified using the THUNDERBIRD SYBR qPCR Mix (TOYOBO, Japan) and primers specified in Table 1. Each experiment was carried out twice. The expression levels were computed using the 2−ΔΔCt technique and normalized to the housekeeping gene β-actin.
Designations and Nucleotide Sequences of the Primers Were Used in This Study
EPDR1, ependymin-related 1; MYRF, Myelin Regulatory Factor.
Using GraphPad Prism 8.0.2, data are displayed as the mean relative fold change standard deviation (GraphPad Software, Inc., San Diego, CA). Two-way ANOVA or Student's t-test was used to determine statistical significance, and p < 0.05 was regarded statistically significant.
Results
General transcriptomic differences among different MSCs
A principal components analysis (PCA) loading map revealed that samples from the same tissue formed four clusters: BM-MSCs, AD-MSCs, DP-MSCs, and UC-MSCs (Fig. 1A). There was a distinct geographical boundary between the four clusters, indicating that tissue origin was the primary source of transcriptome variation. Correlations between samples from BM-MSCs and UC-MSCs were the strongest (ranging from 0.612 to 0.964) (Fig. 1B).
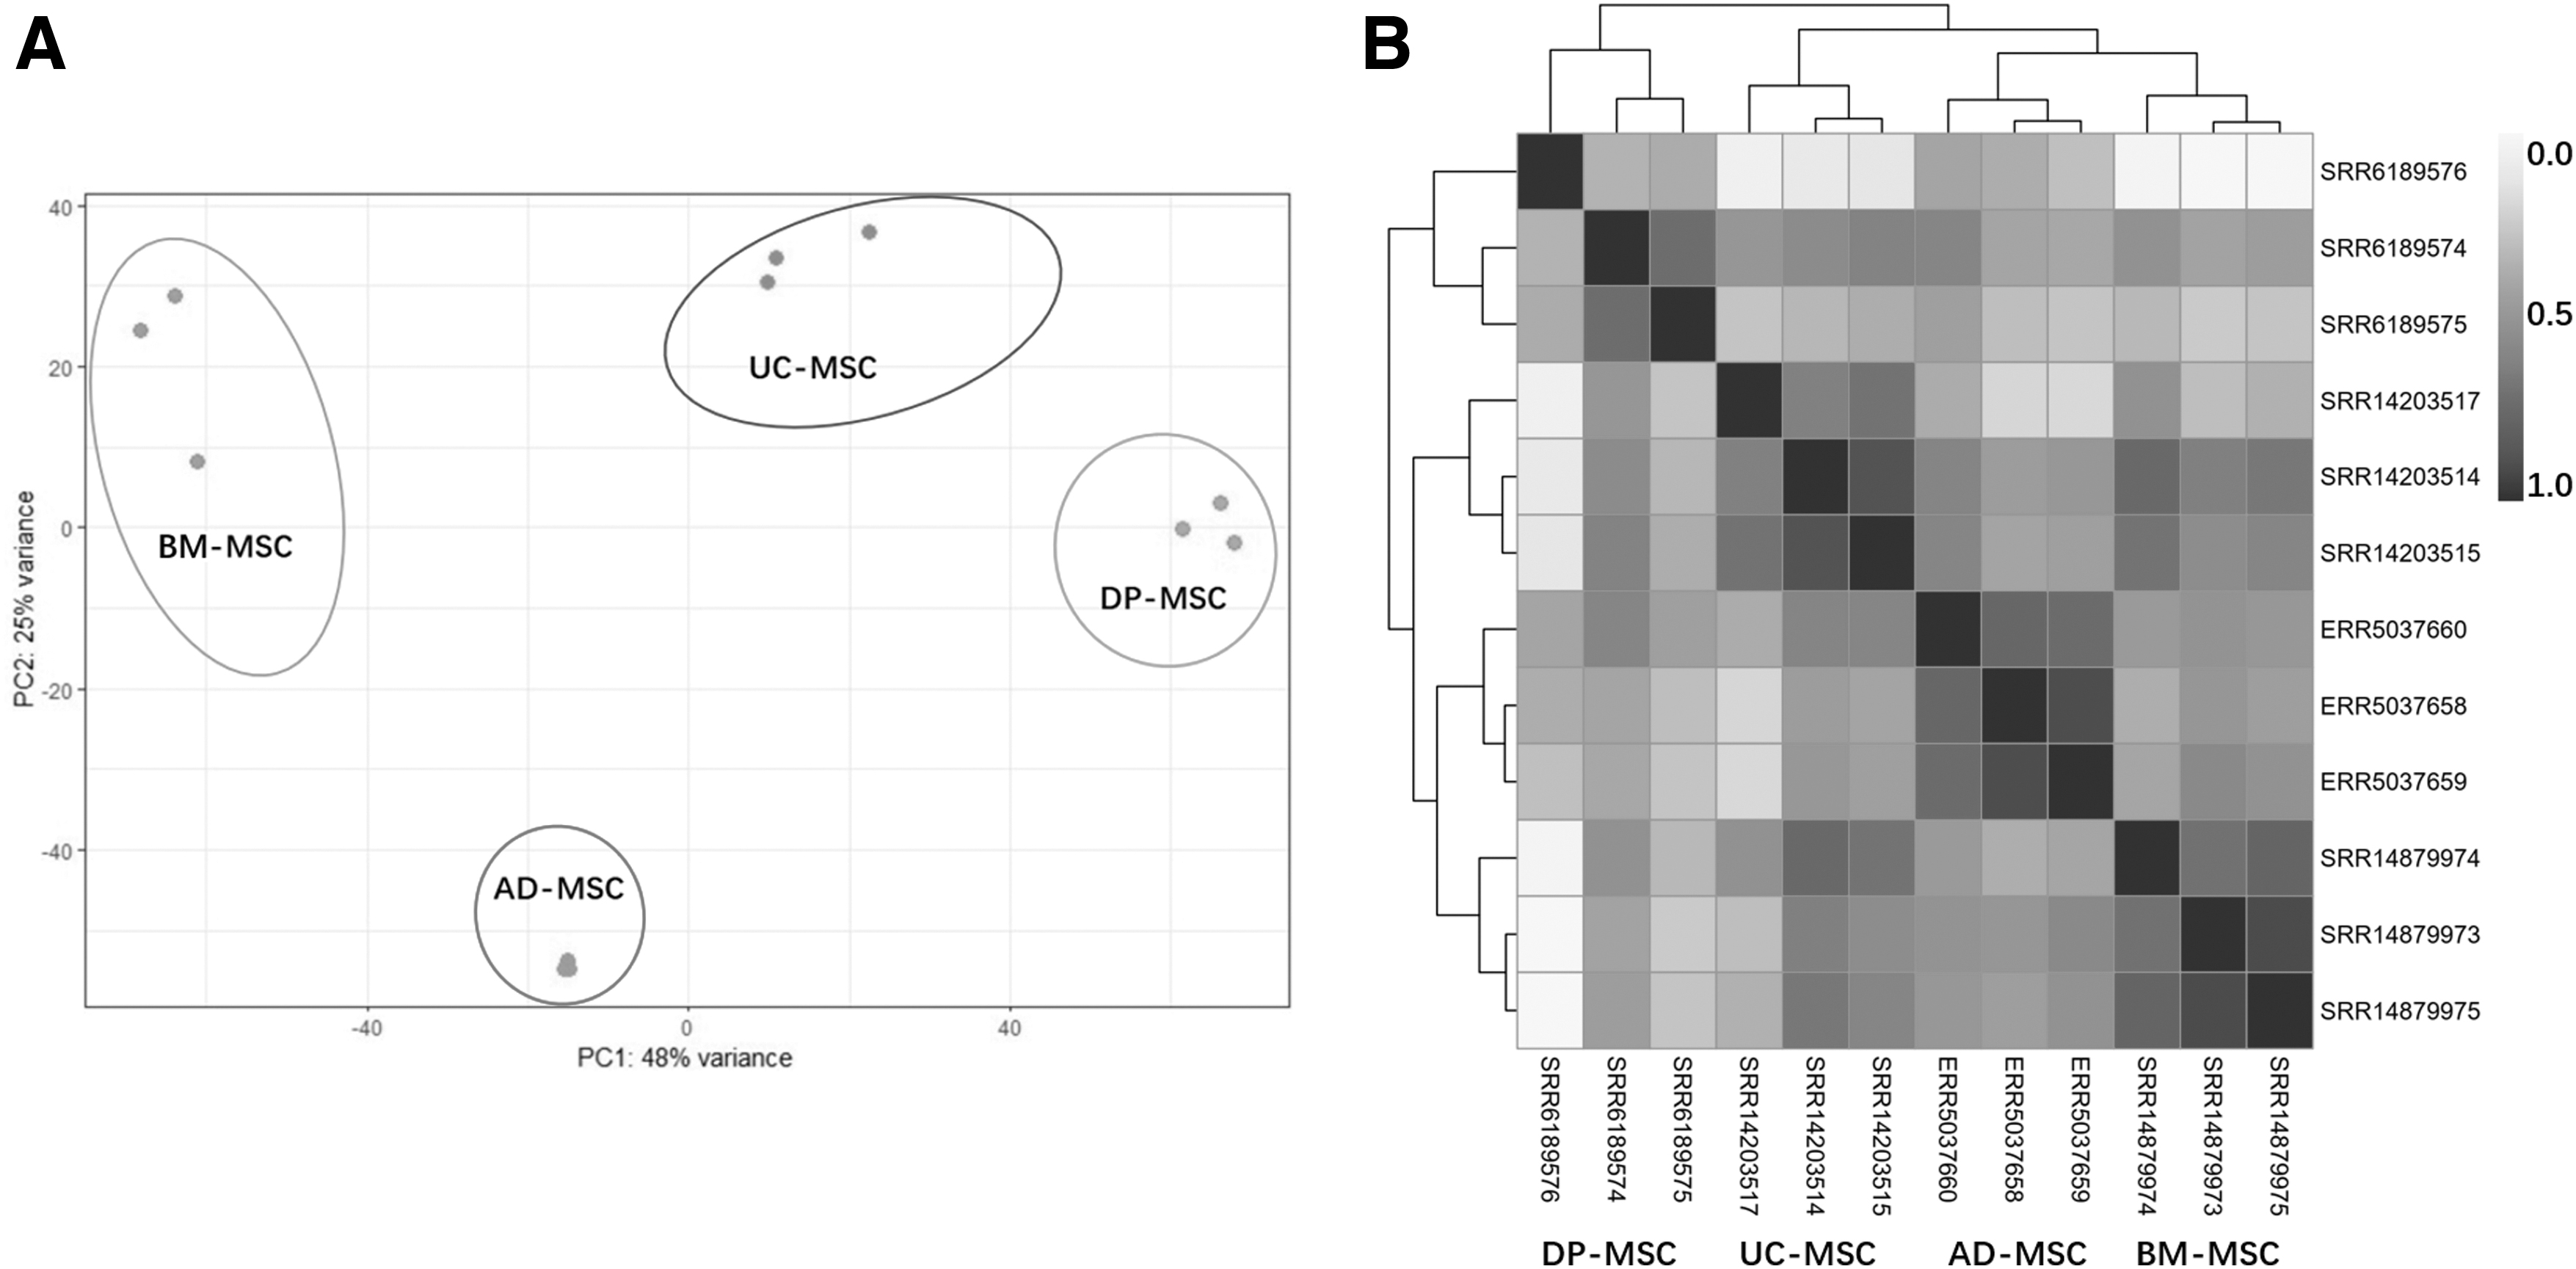
Global transcript expression profiles of different tissue-derived MSCs.
DEGs and functional enrichment
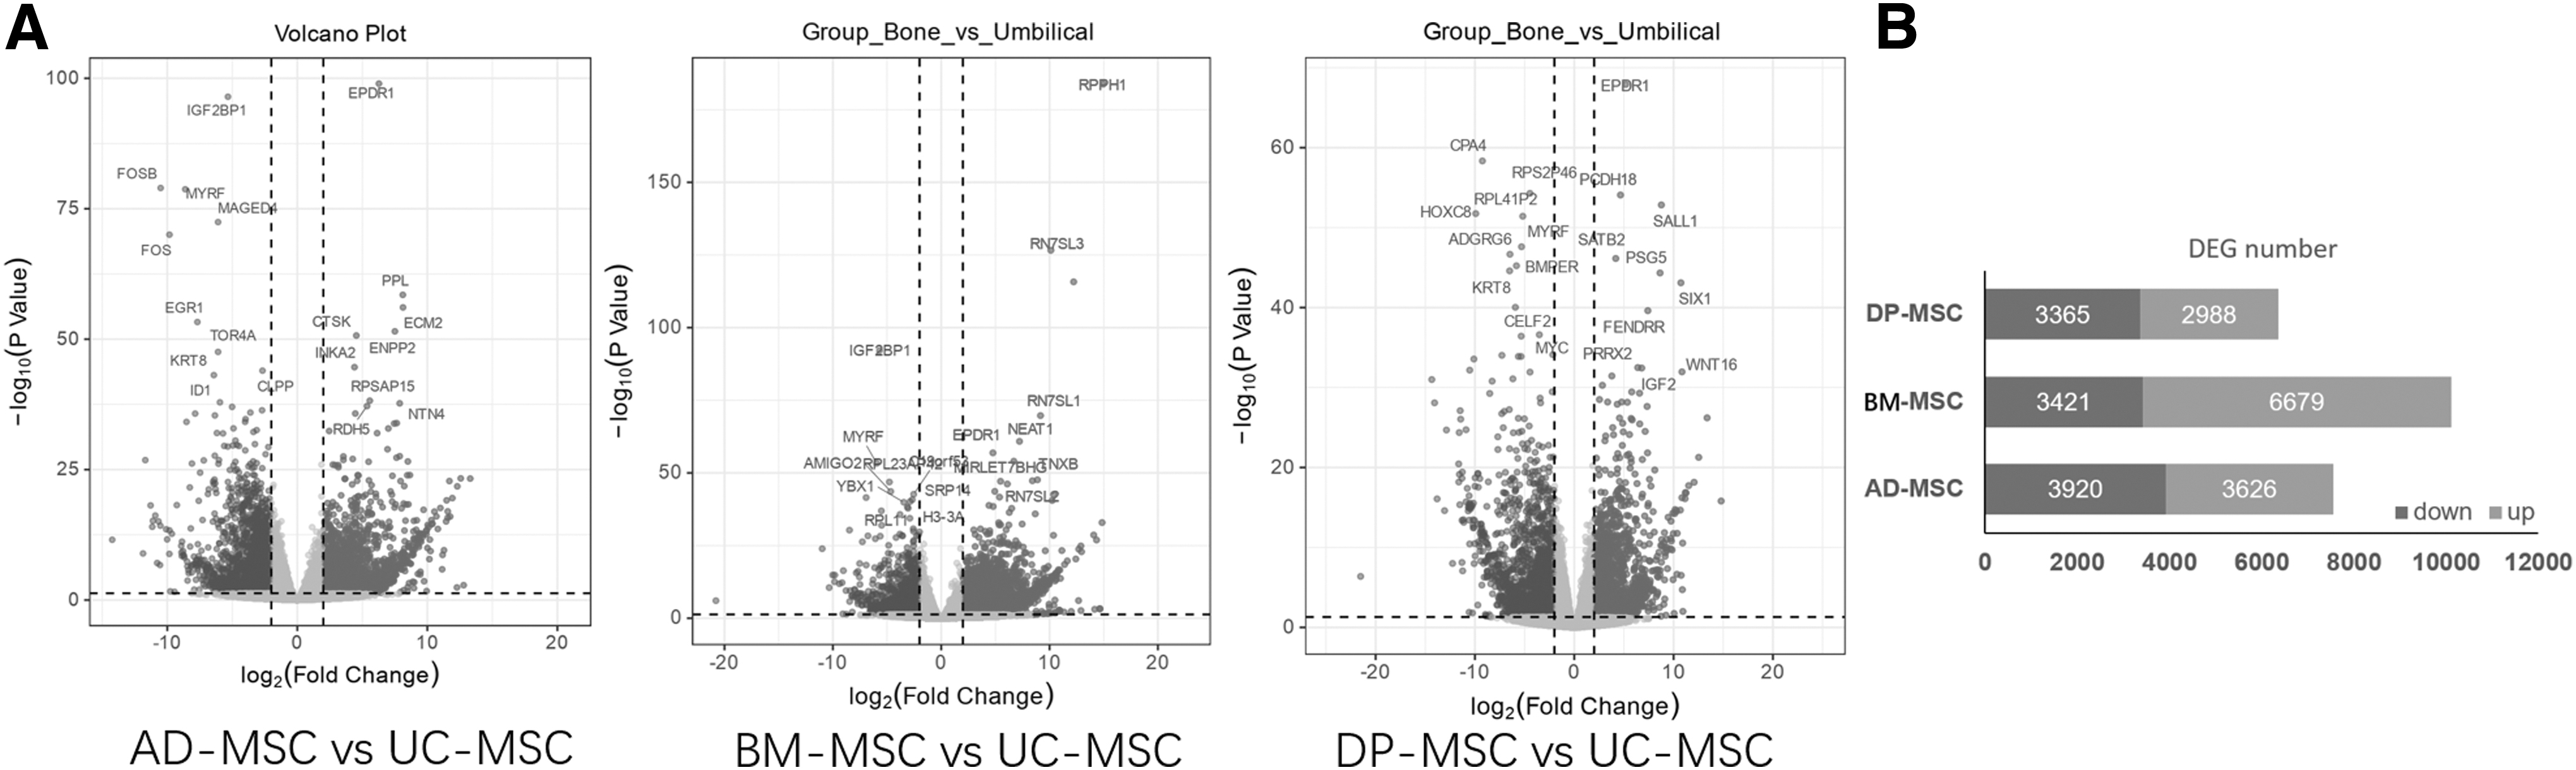
BM-MSCs, DP-MSCs, and AP-MSCs were found to express significantly different genes (p-value ≤0.05 and |log2FC| ≤ −1) in comparison to UC-MSCs, a more primitive progenitor cell type. The number of upregulated genes was greater than that of downregulated genes in BM-MSCs relative to UC-MSCs. Comparing DP-MSCs to UC-MSCs, only 2988 genes were significantly upregulated and 3365 were significantly downregulated (Fig. 2B). The global distribution of all genes was depicted by the volcano plot in BM-MSCs, DP-MSCs, and AP-MSCs versus UC-MSCs (Fig. 2A), and the names of the top 10 DEGs according to their respective log fold changes and p-values were displayed. Ependymin-related 1 (EPDR1) as the significantly upregulated gene and Myelin Regulatory Factor (MYRF) as the significantly downregulated gene were present in each of the three comparison pairs.
GO analysis was then used to classify the 10,100 DEGs between BM-MSCs and UC-MSCs into enriched clusters (Fig. 3A). The top 10 clusters that were significantly enriched (p < 0.01) were classified into 3 categories: BP, cellular component (CC), and molecular function (MF). The majority of DEGs in BP were associated with nonmembrane-bound organelle assembly, energy derivation by oxidation of organic compounds, and RNA splicing through transesterification. DEGs primarily accumulated in the CC section's mitochondrial protein-containing complex, ribosome, and ribosomal subunit. The highest frequency of DEGs linked with actin binding, cadherin binding, and protein heterodimerization activity were observed in MF. When the 6353 DEGs between DP-MSCs and UC-MSCs were enriched (Fig. 3B), the top three categories in BP were urogenital system development, extracellular matrix organization, and extracellular structure organization. Highly abundant DEGs involved in cell-substrate junction, focal adhesion, and collagen-containing extracellular matrix were identified in CC. The top three DEGs in MF were connected with DNA-binding transcription activator activity, RNA polymerase II-specificity, and actin binding.

GO enrichment analysis of DEGs between UC-MSC and BM-MSC
Concerning the enrichment of the 7546 DEGs between AP-MSCs and UC-MSCs (Fig. 3C), the three most enriched clusters were actin filament organization, regulation of neuron projection development, and regulation of actin filament-based process in BP; cell–substrate junction, focal adhesion, and collagen-containing extracellular matrix in CC; and actin binding, DNA-binding transcription activator activity, and RNA polymerase II-specific in MF.
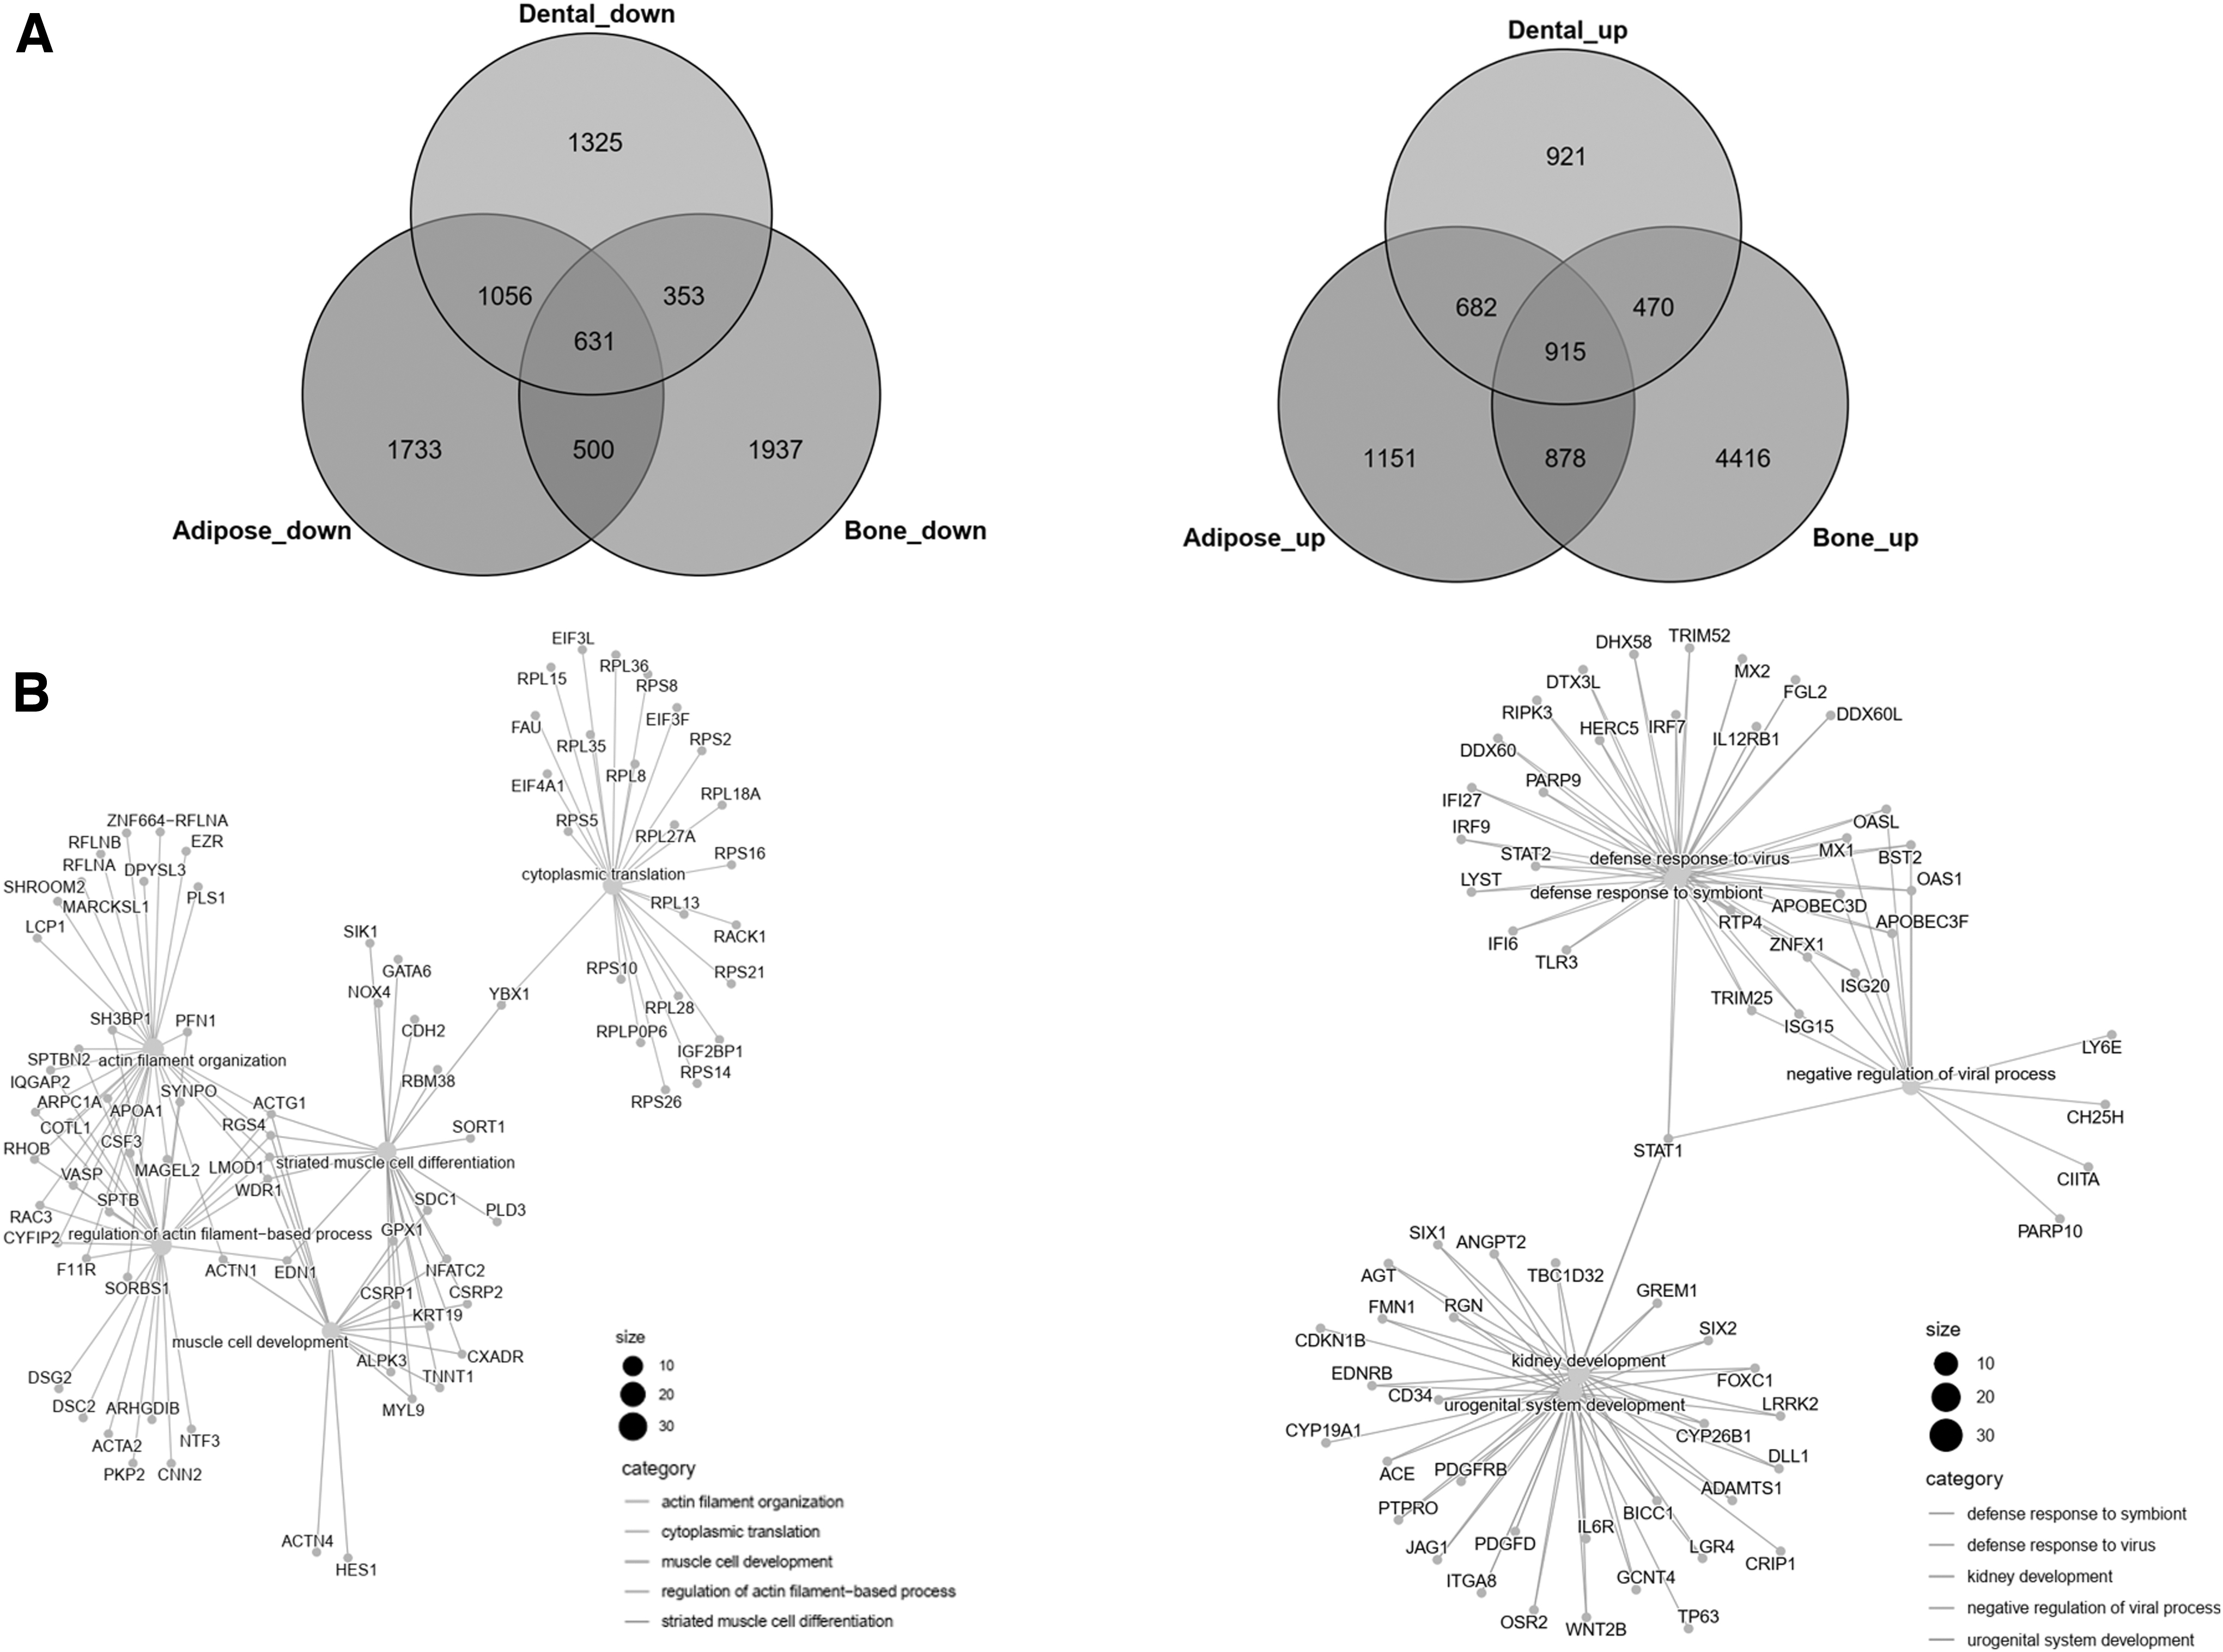
For a better understanding of the specificity and overlap of DEGs in BM-MSCs, DP-MSCs, or AP-MSCs against UC-MSCs, the DEGs were divided into up- and downregulated groups, and then two Venn diagrams were used to display the distribution of up- or downregulated DEGs among three paired comparison groups (Fig. 4A). By GO assay, 631 DEGs were found to be downregulated in all three paired comparison groups, and were primarily enriched in actin filament organization, regulation of actin filament-based process, and muscle tissue development in BP (Fig. 4B), whereas 915 DEGs were found to be upregulated in all three paired comparison groups, and were primarily enriched in urogenital system development, response to virus, and cell junction assembly (Fig. 4B).
Cellular surface molecules differentiation
To provide a more thorough perspective of the unique and overlapping cellular surface molecule patterns among various cell groups, 34 common and highly expressed cellular surface molecules were selected from the RNA-seq data. On the basis of cellular surface molecules with high expression (FPKM >10) discovered in each tissue-derived MSC, a Venn diagram was built (Fig. 5A). Shared by BM-MSCs, DP-MSCs, AP-MSCs, and UC-MSCs were 19 genes. CD200 was discovered to be uniquely strongly expressed in UC-MSCs; CD9, CD146, and CD302 were found to be uniquely expressed in DP-MSCs; and none was detected in AD-MSCs and BM-MSCs.

As indicated by the heatmap of CD expression levels (Fig. 5B), well-known MSC surface markers such as CD44, CD73, CD90, and CD105 are expressed in all cell types. However, the expression of negative markers such as CD34, CD11b, and CD45 revealed very low read counts.
Quantitative real-time PCR validation
To validate the results of RNA-Sequencing analysis, seven molecules (CD73, CD105, CD90, CD34, CD45, CD11b, CD200, MYRF, EPDR1) were chosen for quantitative real-time PCR (qRT-PCR) (Fig. 6). Thereinto, CD73, CD105, and CD90 mRNA expression could be observed in AD-MSCs, UC-MSCs, BM-MSCs, and DP-MSCs, however CD34, CD45, and CD11b mRNA expression could not be detected. CD200 expression was highest in UC-MSCs and lowest in the other three MSCs. MYRF likewise showed the highest expression level in UC-MSCs, whereas EPDR1 demonstrated the lowest. All identified gene expression profiles were consistent with the RNA-Seq data.

qRT-PCR validation. The mRNA expression levels of the selected DEGs (CD73, CD105, CD90, CD200, CD34, CD45, CD11b, MYRF, and EPDR1) were all normalized by the expression levels of the β-actin gene. CD45 and CD11b could not be detected (data not shown). The mRNA expression levels of CD73, CD105, and CD90 in four MSCs were normalized to that of AD-MSC, while the mRNA expression levels of CD200 in four MSCs were normalized to that of UC-MSC, MYRF normalized to DP-MSC, and EPDR1 normalized to BM-MSC. Distinct letter presents significant difference (p < 0.05). Error bars represent SD, n = 6. One-way ANOVA followed by Student's t test was used for comparisons between groups. EPDR1, ependymin-related 1; MYRF, Myelin Regulatory Factor; qRT-PCR, quantitative real-time PCR; SD, standard deviation.
Discussion
In this study, the RNA-seq data of MSCs obtained from BM, APs, DP, and UC were compared. Initially, we evaluated the correlation between MSCs derived from various tissue sources; BM-MSCs and UC-MSCs exhibited the highest correlation. The significant differential genes of the comparison between UC-MSCs and BM-MSCs, DP-MSCs or AP-MSCs were screened, and their function was assessed using GO enrichment. The results showed that DEGs from three different pairwise comparisons could all be enriched with actin-related terms, implying that changes in cell configuration were a major feature of differentiation of different tissue-derived MSCs. UC-MSC expressed lower or lack of some costimulatory molecules, leading to the low immunogenicity of UC-MSCs. On the other side, for improved immunophenotypic characterization of MSCs, we screened well-known or highly expressed cell surface molecules in the four tissue-derived MSCs.
Although there are more differentially expressed gene data between UC-MSCs and BM-MSCs, the correlation between UC-MSCs and BM-MSCs from the global transcripts is significantly greater than that of other tissue-derived MSCs. In addition, the tested cell surface molecules of UC-MSCs include those of BM-MSCs. Therefore, easier-to-obtain UC-MSCs are the optimized option to BM-MSCs. However, the association between UC-MSCs and DP-MSCs is rather weak, and DP-MSCs exhibit a greater number of tested cell surface molecules other than UC-MSCs. Therefore, we should exercise greater caution when contemplating the use of UC-MSCs to substitute DP-derived stem cells in treatment.
GO analysis revealed a significant enrichment of downregulated DEGs associated with actin in BM-MSC, DP-MSC, and AP-MSC compared with UC-MSC. Actin remodeling influences the lineage commitment of MSCs, according to a growing body of research. In addition, actin has a role in regulating cell shape, nuclear shape, cell spreading, and cell stiffness, all of which influence cell differentiation (McBeath et al., 2004). Aged MSCs were hypothesized to be less receptive to biological and mechanical inputs due to a less dynamic actin cytoskeleton (Kasper et al., 2009). This may be consistent with the reduced capacity of these three adults' tissue-derived MSCs to differentiate in comparison to UC. UC-MSC are primitive cells falling in the developmental map between human embryonic stem cells (hESC) and adult stem cells. They share biological characteristics with both stem cell types; however, they do not combine them with attributes that pose as safety risks for cytotherapy (Christodoulou et al., 2018).
Overlapping upregulated DEGs in BM-MSC, DP-MSC, and AP-MSC could be enriched in immune processes, especially DP-MSC and AP-MSC expressing more DEGs related to antigen processing and presentation of antigen through major histocompatibility complex (MHC) class I. The results further confirmed that UC-MSC with less expressed MHC were more suited for allogeneic delivery.
MYRF was downregulated in BM-MSC, DP-MSC, and AP-MSC compared with UC-MSC. MYRF is a major transcriptional regulator of the terminal differentiation process in oligodendrocytes and is needed for central nervous system (CNS) myelination. Oligodendrocytes create myelin in the central nervous system of vertebrates, thereby facilitating the rapid propagation of neuronal activity (Aprato et al., 2020; Bujalka et al., 2013). The downregulation of critical regulatory factors would reduce the efficacy of BM-MSCs, AP-MSCs, and DP-MSCs in regenerating CNS myelination, and UC-MSCs may be more advantageous in this context. The EPDR1 was upregulated in BM-MSCs, DP-MSCs, and AP-MSCs relative to UC-MSCs. Similar to ependymins, EPDR1 is a protein that may play a function in calcium-dependent cell adhesion (Gimeno-Valiente et al., 2020; Yang et al., 2021). The glycosylation of this protein in human colorectal cancer, the upregulation of EPDR1 has been shown to increase cell growth, proliferation, and invasiveness (Gimeno-Valiente et al., 2020).
EPDR1 was substantially expressed in BM-MSC, AP-MSC, and DP-MSC, suggesting that these cell types may have a greater capacity for tissue invasion. They might be more likely to directly reach the target tissue. Further research is required to determine whether the expression levels of MYRF and EPDR1 in MSCs generated from UCs are altered when triggered by a particular environment.
BM-MSCs, AD-MSCs, DP-MSCs, and UC-MSCs all displayed well-known MSC markers in the studied RNA-seq data. CD200 was strongly expressed in UC-MSCs, whereas the expression level was low (FPKM 10) in the other three tissue-derived MSCs. Studies have demonstrated that overexpressing CD200, a new MSC-specific protein with cell surface expression, enhanced MSC differentiation potential and immunoregulatory capabilities. In addition (Kim et al., 2018), another study revealed that CD200-positive MSC had a greater osteogenic differentiation capacity than MSC without CD200 (Bühring et al., 2009). Thus, UC-MSCs with high CD200 expression in our study were hypothesized to have a greater capacity for proliferation, differentiation, and immunological modulation than MSCs obtained from other tissues. There are two types of MSCs (CD106 positive and negative) produced from BM (Zhu et al., 2012). CD106-positive BM-MSCS was discovered to have more robust biological capabilities than CD106-negative BM-MSCS. The level of CD106 expression in our selected BM-MSCs is extremely low.
It is inappropriate to employ molecules such as CD200 and CD106 as markers to identify MSCs, but they can be used as a standard to monitor the status of isolated MSCs, which can better guide and support clinical therapeutic applications.
However, a major limitation of this study was that our data analysis was limited to a mere four tissues of interest and the scope of the data analyzed was restricted. Further sequencing results are necessary to affirm the validity of our findings.
Conclusions
In conclusion, we exhaustively investigated the differences in transcriptome expression between UC-MSCs and other three tissue-derived MSCs. UC-MSCs had the strongest relationship with BM-MSCs and the weakest relationship with DP-MSCs. DEGs screen and GO enrichment revealed that the abundance of actin and its related genes in adult tissue-derived MSCs was much lower than that in UC-MSCs, which may be associated with the gradual deterioration of differentiation capacity in adult tissue-derived MSCs. MYRF was highly upregulated and EPDR1 was dramatically downregulated in three adult tissue-derived MSCs other than UC-MSCs. The final recommendation is to categorize CD200 and CD106 as a type of benchmark molecules for the identification of MSC status to better direct clinical use.
Footnotes
Acknowledgment
The authors are grateful to all the project members for their hard work and helpful suggestions.
Authors' Contributions
X.Z.: Methodology, Software, and Writing—Original draft preparation. X.X.: Methodology, Data curation, and Writing—Original draft preparation. M.S., Y.W.: Software and Validation. T.Z., H.L.: Software and Supervision. X.W., J.M.: Conceptualization and Writing—Reviewing and Editing.
Author Disclosure Statement
The authors declare they have no conflicting financial interests.
Funding Information
This research was financially supported by the Xuzhou Youth Science and Technology Talent Program (KC21052), and the National Oral Disease Clinical Medical Research Center Open Pro (NCRCO-202101).
References
Supplementary Material
Please find the following supplemental material available below.
For Open Access articles published under a Creative Commons License, all supplemental material carries the same license as the article it is associated with.
For non-Open Access articles published, all supplemental material carries a non-exclusive license, and permission requests for re-use of supplemental material or any part of supplemental material shall be sent directly to the copyright owner as specified in the copyright notice associated with the article.