
Abstract
In mammals, differentiated cells generally do not de-differentiate nor undergo cell fate alterations. However, they can be experimentally guided toward a different lineage. Cell fusion involving two different cell types has long been used to study this process, as this method induces cell fate alterations within hours to days in a subpopulation of fused cells, as evidenced by changes in gene-expression profiles. Despite the robustness of this system, its use has been restricted by low fusion rates and difficulty in eliminating unfused populations, thereby compromising resolution. In this study, we address these limitations by isolating fused cells using antibody-conjugated beads. This approach enables the microscopic tracking of fused cells starting as early as 5 hours after fusion. By taking advantage of species-specific FISH probes, we show that a small population of fused cells resulting from the fusion of mouse ES and human B cells, expresses OCT4 from human nuclei at levels comparable to human induced pluripotent stem cells (iPSCs) as early as 25 hours after fusion. We also show that this response can vary depending on the fusion partner. Our study broadens the usage of the cell fusion system for comprehending the mechanisms underlying cell fate alterations. These findings hold promise for diverse fields, including regenerative medicine and cancer.
Introduction
Ahuman body is composed of several hundred cell types, each with defined features and functions. Among all the cell types in our body, the terminally differentiated cells do not undergo cell fate alterations in mammals, but it is now well established that cell fates can be manipulated through the forced-expression of transcription factors (Hanna et al., 2010; Stadtfeld and Hochedlinger, 2010; Takahashi and Yamanaka, 2006), or with chemicals (Hou et al., 2013; Lin et al., 2009) and non-coding RNAs (Luginbuhl et al., 2017).
The success rate for differentiated cells to be reprogrammed to pluripotency is generally low, in the range of a few percent at maximum (Brumbaugh et al., 2019; Hockemeyer et al., 2008; Maherali et al., 2008; Plath and Lowry, 2011; Polo et al., 2010). Moreover, cell fate alterations appear to disturb properly regulated cell cycle control, as forced expression of Yamanaka factors in mice causes cancer (Ohnishi et al., 2014). Similarly, factors involved in lineage maintenance are often misregulated in certain types of cancer (Boumahdi et al., 2014; Hart et al., 2005; Peng et al., 2010; Wainwright and Scaffidi, 2017). Nonetheless, paramount evidence shows that differentiated cells can be successfully reprogrammed to another cell type with the quality to be used in the fields of regenerative medicine (Pane et al., 2016). Thus, understanding the process of cell fate alterations is crucial for both advancing the field of regenerative medicine and understanding the etiology of cancer development.
Despite decades of work, the molecular mechanism underlying cell fate conversion (reprogramming) is not fully understood. One major obstacle for studying the reprogramming process is the low reprogramming efficiency. Moreover, the first sign of reprogramming generally takes at least a few days to be detected. While the expression of a handful of reprogramming factors is the widely used method for reprogramming, an alternative way to induce cellular reprogramming is through cell fusion (Foshay et al., 2012; Pereira et al., 2008b; Tada et al., 2001). Cell fusion has long been used to investigate the quick and robust reprogramming of the gene-network. Moreover, accumulating evidence shows that certain cell types can spontaneously fuse in vivo and reprogram toward a less differentiated state (Alvarez-Dolado et al., 2003; Pesaresi et al., 2018; Weimann et al., 2003a; Weimann et al., 2003b), indicating that cell fusion-induced reprogramming can be relevant to events in vivo. Because the technique allows us to use different combinations of cell types and precondition these cells separately, one can explore effects of cell cycle, dominance of the gene-network of different cell types (Cowan et al., 2005; Foshay et al., 2012; Piccolo et al., 2011; Tsubouchi and Fisher, 2013; Tsubouchi et al., 2013).
Despite such advantages, the critical problem has been the low fusion rate. To date cells fused with desired combinations have been either collected by fluorescence activated cell sorting (FACS) or selected with combinations of drugs. However, sorting a reasonable number of cells takes time and most cells die after sorting, limiting downstream assays. Drug selection is also effective in eliminating unfused cells, but takes a day or so to be effective. In addition, the use of drugs could impact cells in a manner that is not anticipated.
Here, we enriched for fused cells without having to use drugs to enable microscopic studies as early as 5 hours after fusion. This allowed us to track the reprogramming process at the single-cell level during the first cell cycle after fusion, even in the fast-cycling cells used in this study. In contrast to previous reports, we show that most fused cells undergo their first division within 25 hours. Using single-molecule RNA FISH, we show that a small population of the human B (hB) cells fused to mouse ES (mES) cells displayed a low level of OCT4 expression by 10 hours after cell fusion. Expression levels in a small subpopulation then reach the level comparable to induced pluripotent stem cells (iPSCs) as early as 25 hours after fusion. The protocol presented here broadens the usage of the cell fusion system in understanding mechanisms underlying cell fate alterations, which may benefit multiple important fields including regenerative medicine and cancer.
Materials and Methods
Cell line handling
E14tg2A mES cells and their derivatives were cultured in KO-DMEM (Thermo Fisher 10829018) with 10% fetal bovine serum (FBS) supplemented with L-Glutamine (Wako 073-05391), nonessential amino acids (Gibco 11140050), and Penicillin/Streptomycin (Wako 161-23201) as suggested by the supplier and 100 μM beta-mercaptoethanol and LIF. TK6 hB lymphoblastoid cells (JCRB1435 from JCRB Cell Bank) were cultured in RPMI1640 (nacalai tesque 30264-85) supplemented with 5% horse sera (Life Technologies RO-26050088), Penicillin/Streptomycin, and 2mM Sodium Pyruvate (Gibco 11360070). iPS cells (REPROCELL, PChiPS771 cat no RCRP001N) established by mRNA reprogramming were cultured in StemFit® AK02N (REPROCELL). Neuro2A (N2A) cells were cultured in DMEM (Sigma-Aldrich D6546) supplemented with 10% heat-inactivated FBS and L-Glutamine. mES cells carrying LaminB1-mClover were established using CRISPR/Cas9 technology by inserting the Puro-mClover cassette at the N-terminus of Lamin B1, using the following guide sequence: CTGCTGCTGCACGGGGGTCG. TK6 genetically engineered to express H2B-mCherry was a gift from Dr. Hiroyuki Sasanuma (Tokyo Metropolitan Institute of Medical Science).
Cell fusion and isolation
Cell fusion with polyethylene glycol (PEG) (Roche 10783641001) was performed as described previously (Pereira and Fisher, 2009). 3–10 × 106 mES or N2A cells were fused to the same number of hB cells. Two hours after plating, plates were carefully washed with phosphate-buffered saline (PBS) three times; adhered cells were collected and re-suspended in 1 × Dead Cell Removal Buffer (Miltenyi Biotec 130-090-101). Dead cell removal and CD45-positive cell isolation using anti-CD45 beads (Miltenyi Biotec 130-045-801) were carried out following the manufacturer's protocol. Collected cells were resuspended in 100 μL media and were plated out on a film-bottom dish (Matsunami FD10300) coated with iMatrix511 (Matrixome 892011) at desired concentrations. Flow cytometry was carried out using the SONY SH800 with standard procedures.
smFISH
smFISH was carried out using the ViewRNA ISH system (Thermo Fisher Scientific QVC001) using probes for hGAPDH (VA4-10641-VC), hOCT4 (VA1-11760-VC or VA4-19390-VC), and mOct4 (VB4-14493-VC) following the manufacturer's protocol. Samples were fixed with 4% formaldehyde for 30 minutes at room temperature (RT) and were either processed immediately or were dehydrated with a series of ethanol with different dilutions following the manufacturer's protocol until ready for FISH. DNA was stained with Sir-DNA Kit (Spirochrome CY-SC007).
Quantitative RT-polymerase chain reaction
For quantitative polymerase chain reaction (PCR), RNA was isolated using Qiagen RNeasy kits (74104) and 1 ng RNA was reverse transcribed using the QuantAccuracy RT-RamDA cDNA synthesis kit (TOYOBO RMQ-101) (Hayashi et al., 2018), and PCR was carried out using Qiagen QuantiTect SYBR Green PCR kits (204143) and the Roche Lightcycler 96 system. Primers used for human-specific detection of GAPDH are Fwd 5′-GCATCCTGGGCTACACTGA-3′ and Rev 5′-CCAGCGTCAAAGGTGGAG-3′; OCT4 Fwd 5′-TCGAGAACCGAGTGAGAGGC-3′ and Rev 5′-CACA
Imaging
All the imaging was carried out using the laser confocal microscope CellVoyager CV1000 (YOKOGAWA) equipped with an EMCCD camera and 40 × UPLSAPO40X2 (NA0.95) or 60 × UPLSAPO60XS (NA1.3), with the following settings: laser power 7%, exposure time 100 mseconds and gain setting at 80% for 488 and 561 nm excitation, and laser power 5%, exposure 150 mseconds and gain setting at 80% for 633 nm excitation. For live imaging, laser power was reduced to 1%. When acquiring smFISH images, 40 z-stacks were imaged at a 0.3 μm interval (stack range 12 μm). For live imaging, 8 z-stacks at a 3.0 μm interval (stack range 21 μm) were imaged every 5–10 minutes. For live-snap imaging, 13 z-stacks at a 1.2 μm interval (stack range 14 μm) were imaged.
Image analysis
All image analyses were carried out using FIJI (Schindelin et al., 2012). smFISH foci detection, and quantification were performed using the ComDet v.0.5.5 plugin for ImageJ (https://github.com/UU-cellbiology/ComDet). ROI was drawn manually, and smFISH foci were automatically detected and counted using a particle size of 2 pixels with an intensity threshold (in standard deviation) of 8–12. Each image was checked by eye for adequate detection of smFISH signals. Statistical analyses were carried out using Prism8 or 9.
Results and Discussion
To identify fused cells, we took advantage of mES cells carrying endogenously tagged LaminB1-mClover and hB lymphoblastoid cells carrying endogenously tagged H2B-mCherry (Fig. 1A). The cell fusion rate between mES and hB cells using PEG was estimated to be ∼0.3% within the total population (Fig. 1Bi)]. To enrich for fused cells, we allowed cells to adhere for 2 hours. This allowed cells to recover from PEG treatment and allowed mES and fused cells to adhere to the dish. Nonadherent unfused hB cells were carefully washed away with PBS and adhered cells (primarily unfused mES cells and fused cells) were collected and were subjected to isolation using beads conjugated with antibodies against the lymphocyte-specific surface antigen (CD45). Although this procedure did not eliminate all unfused hB and mES cells, we achieved a 15.5-fold enrichment of the fused cells among the live population without the necessity of drug-based selection (Fig. 1Bii). Since dead cells and unfused hB cells do not adhere to the dish, they do not interfere with imaging. By excluding these populations, we found that 22.2% were fused cells (double positive for mClover and mCherry) (Fig. 1B). With this improved rate, imaging of fused cells on the day of fusion became more feasible. Presumably because some fused cells failed to adhere to the dish, microscopic analysis identified less percentage (12%) of fused cells among the total cells identified (Fig. 2A, B), but still within the range to carry out microscopic analysis.

Isolation of fused cells for microscopic analyses.

Identification of heterokaryons and hybrids under microscope.
At earlier times after fusion, fused cells exist as either in the form of heterokaryons or hybrids (Pereira et al., 2008a). Heterokaryons denote fused cells that have not yet undergone cell division after fusion (Cantone et al., 2016), and within them, two nuclei coexist within a single cell. Upon the first cell division, these cells appear in the form of hybrids, wherein they are positive both for H2B-mCherry and LaminB1-mClover.
Since most hB cells are washed away, cells with mCherry signal are only sparsely present (Fig. 2A). Occasionally, we identified nuclei of unfused hB cells, distinguishable from those within fused cells, due to their smaller size (Fig. 2E). We also noticed that H2B-mCherry from hB nuclei tend to migrate into mES nuclei after fusion; thus, heterokaryons contain a mES nucleus with low-level of mCherry signal and LaminB1-mClover signal (Fig. 2C, D). By observing the DNA staining pattern (SirDNA), it is possible to differentiate between mouse and human nuclei; mouse nuclei display patches of more intense staining corresponding to the chromocenter, while human nuclei exhibit homogeneous staining. In heterokaryons, the two nuclei are often in close proximity compared to the nucleus of other cells. By tracking them with a 5-minute interval acquisition, we could confirm that these cells are indeed heterokaryons as the two nuclei move together in close proximity and eventually divide to generate hybrids (data not shown). The utilization of single-molecule RNA FISH (smRNA FISH) with a human GAPDH mRNA probe facilitated the identification of fused cells. In unfused hB cells, GAPDH mRNA clusters in smaller area (Fig. 3A). In contrast to previous reports using mES cells (Bhutani et al., 2010; Foshay et al., 2012; Han et al., 2008), our findings suggest that the majority of fused cells undergo their first division within 25 hours after fusion (Fig. 2F).
Species-specific mRNA detection with smFISH probes.
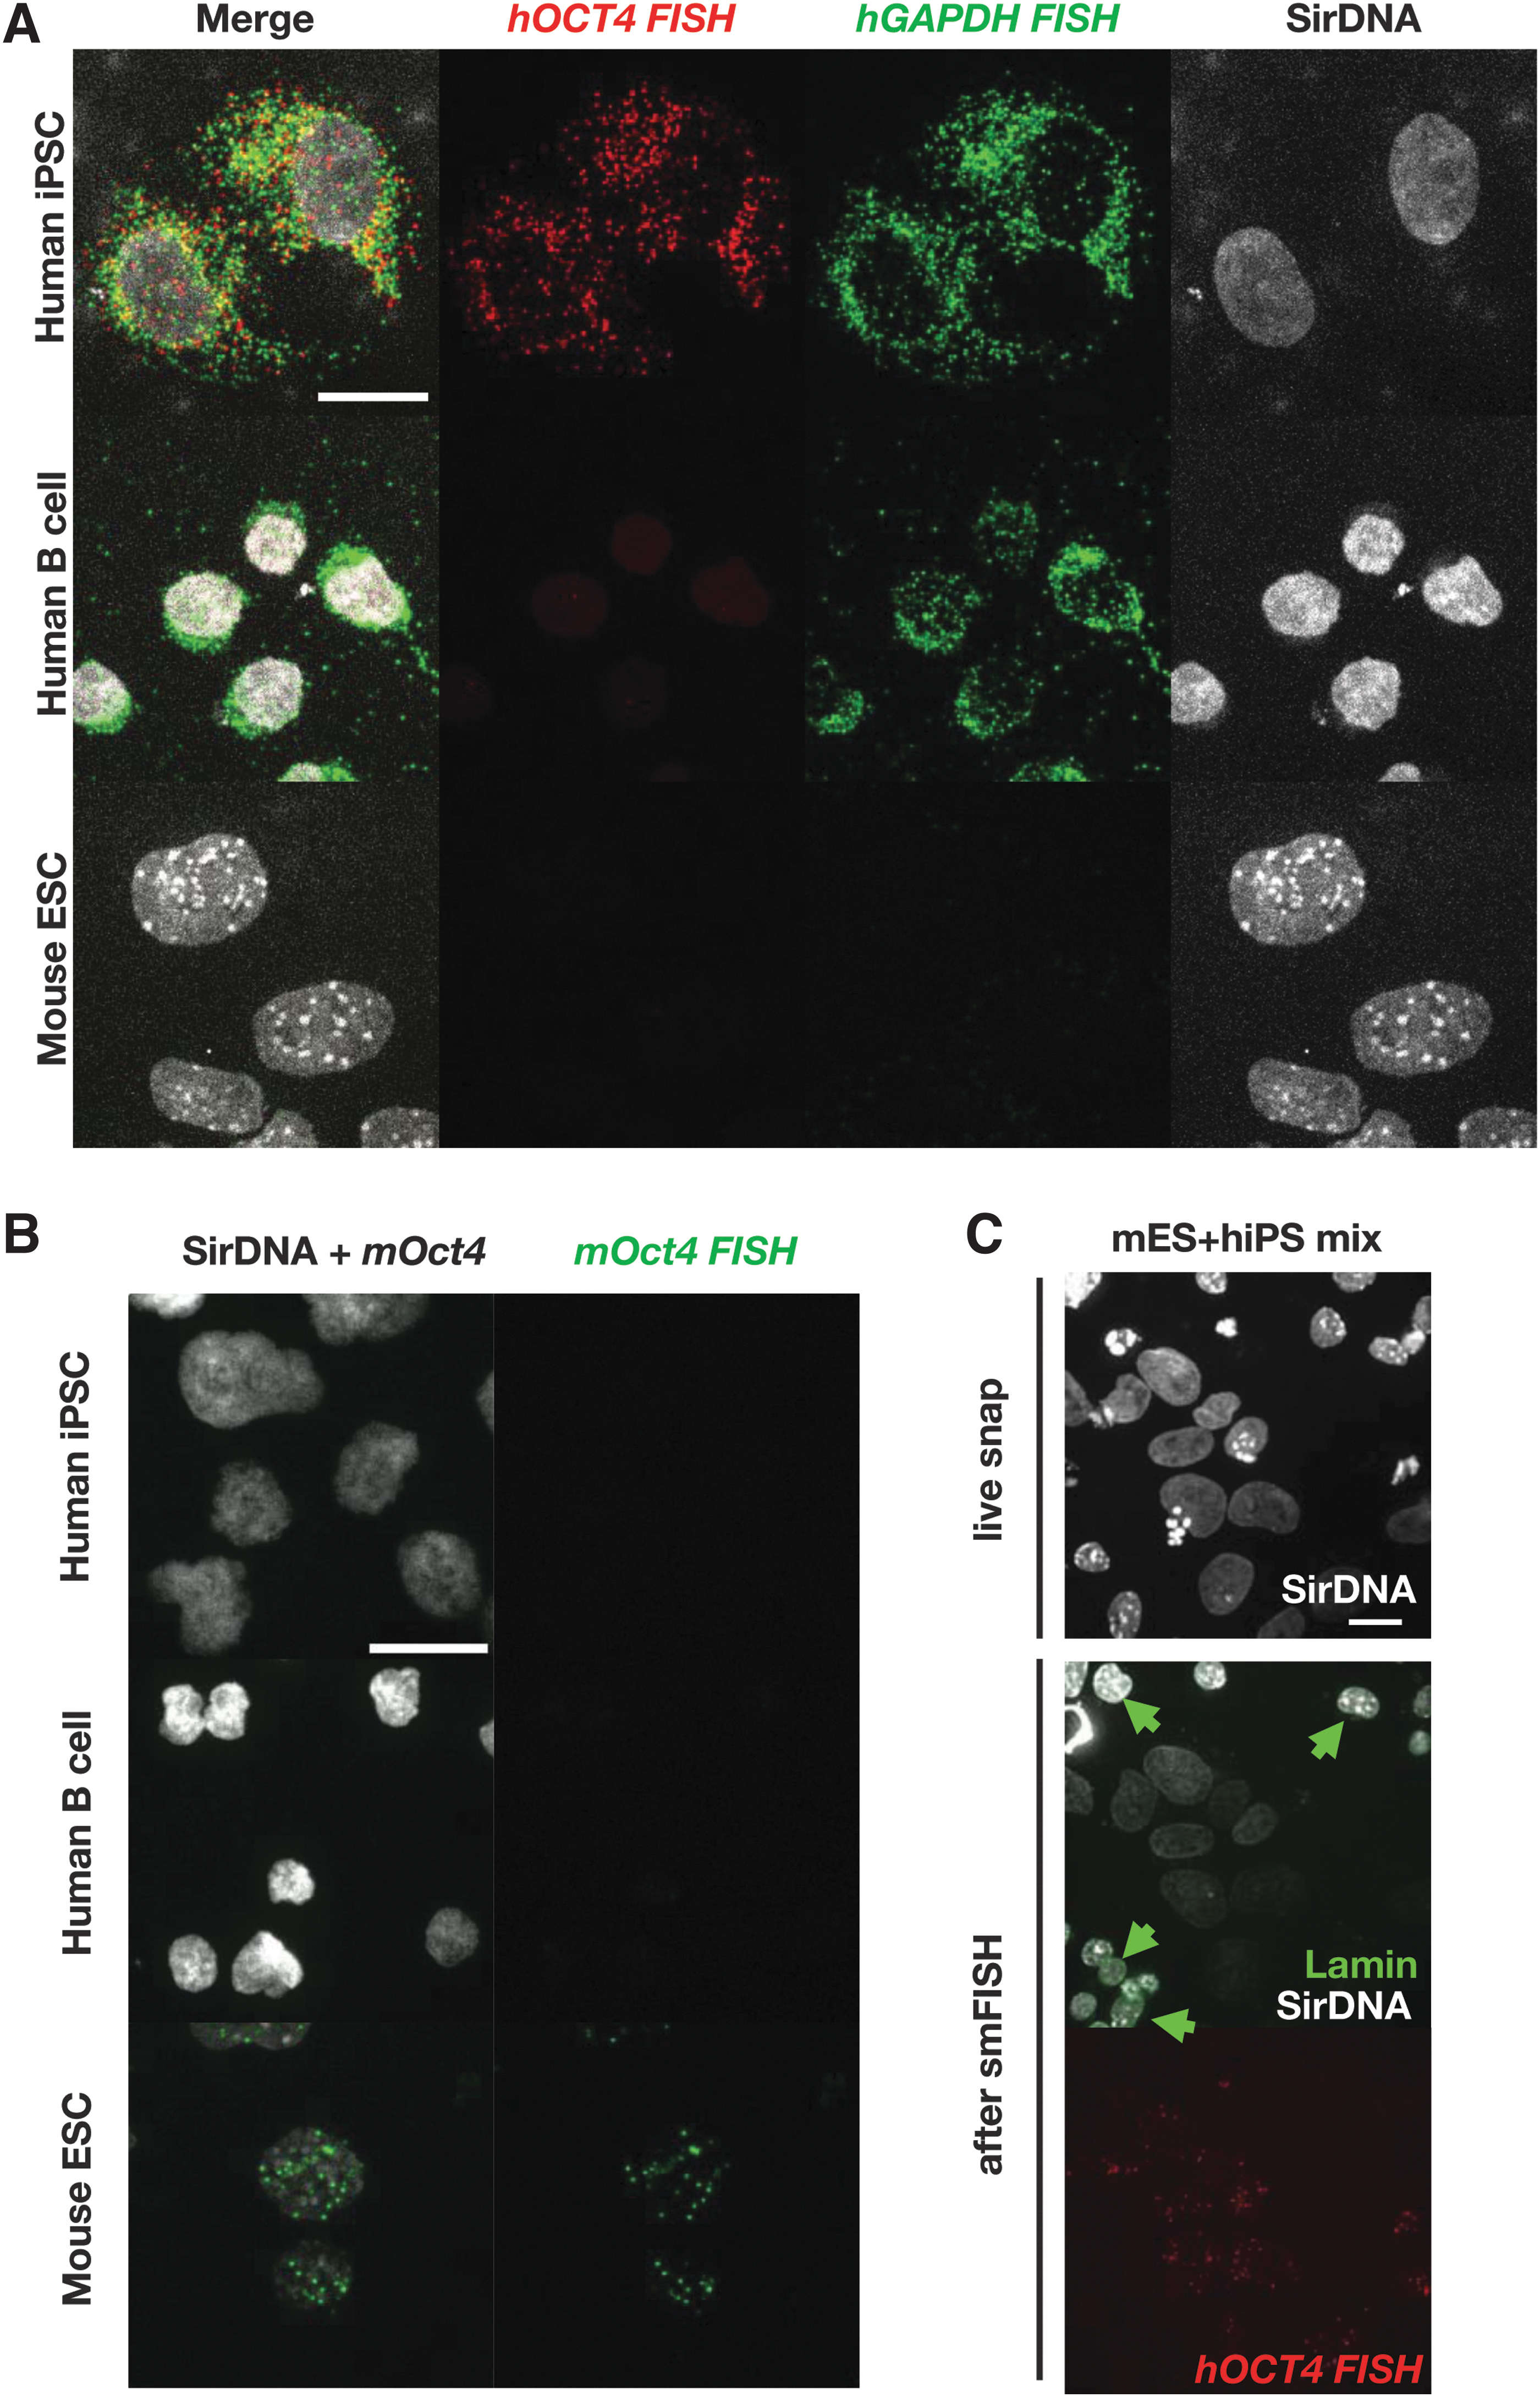
To assess gene expression levels from two fused cells independently from the two fused cell types, we pursued species-specific smRNA FISH probes (Fig. 3A–C). Among the tested probes, those specific for human GAPDH, human OCT4, and mouse Oct4 worked well with minimum background. The hybridization temperature was precisely set to 40° using thermometers with 0.1°C increments.
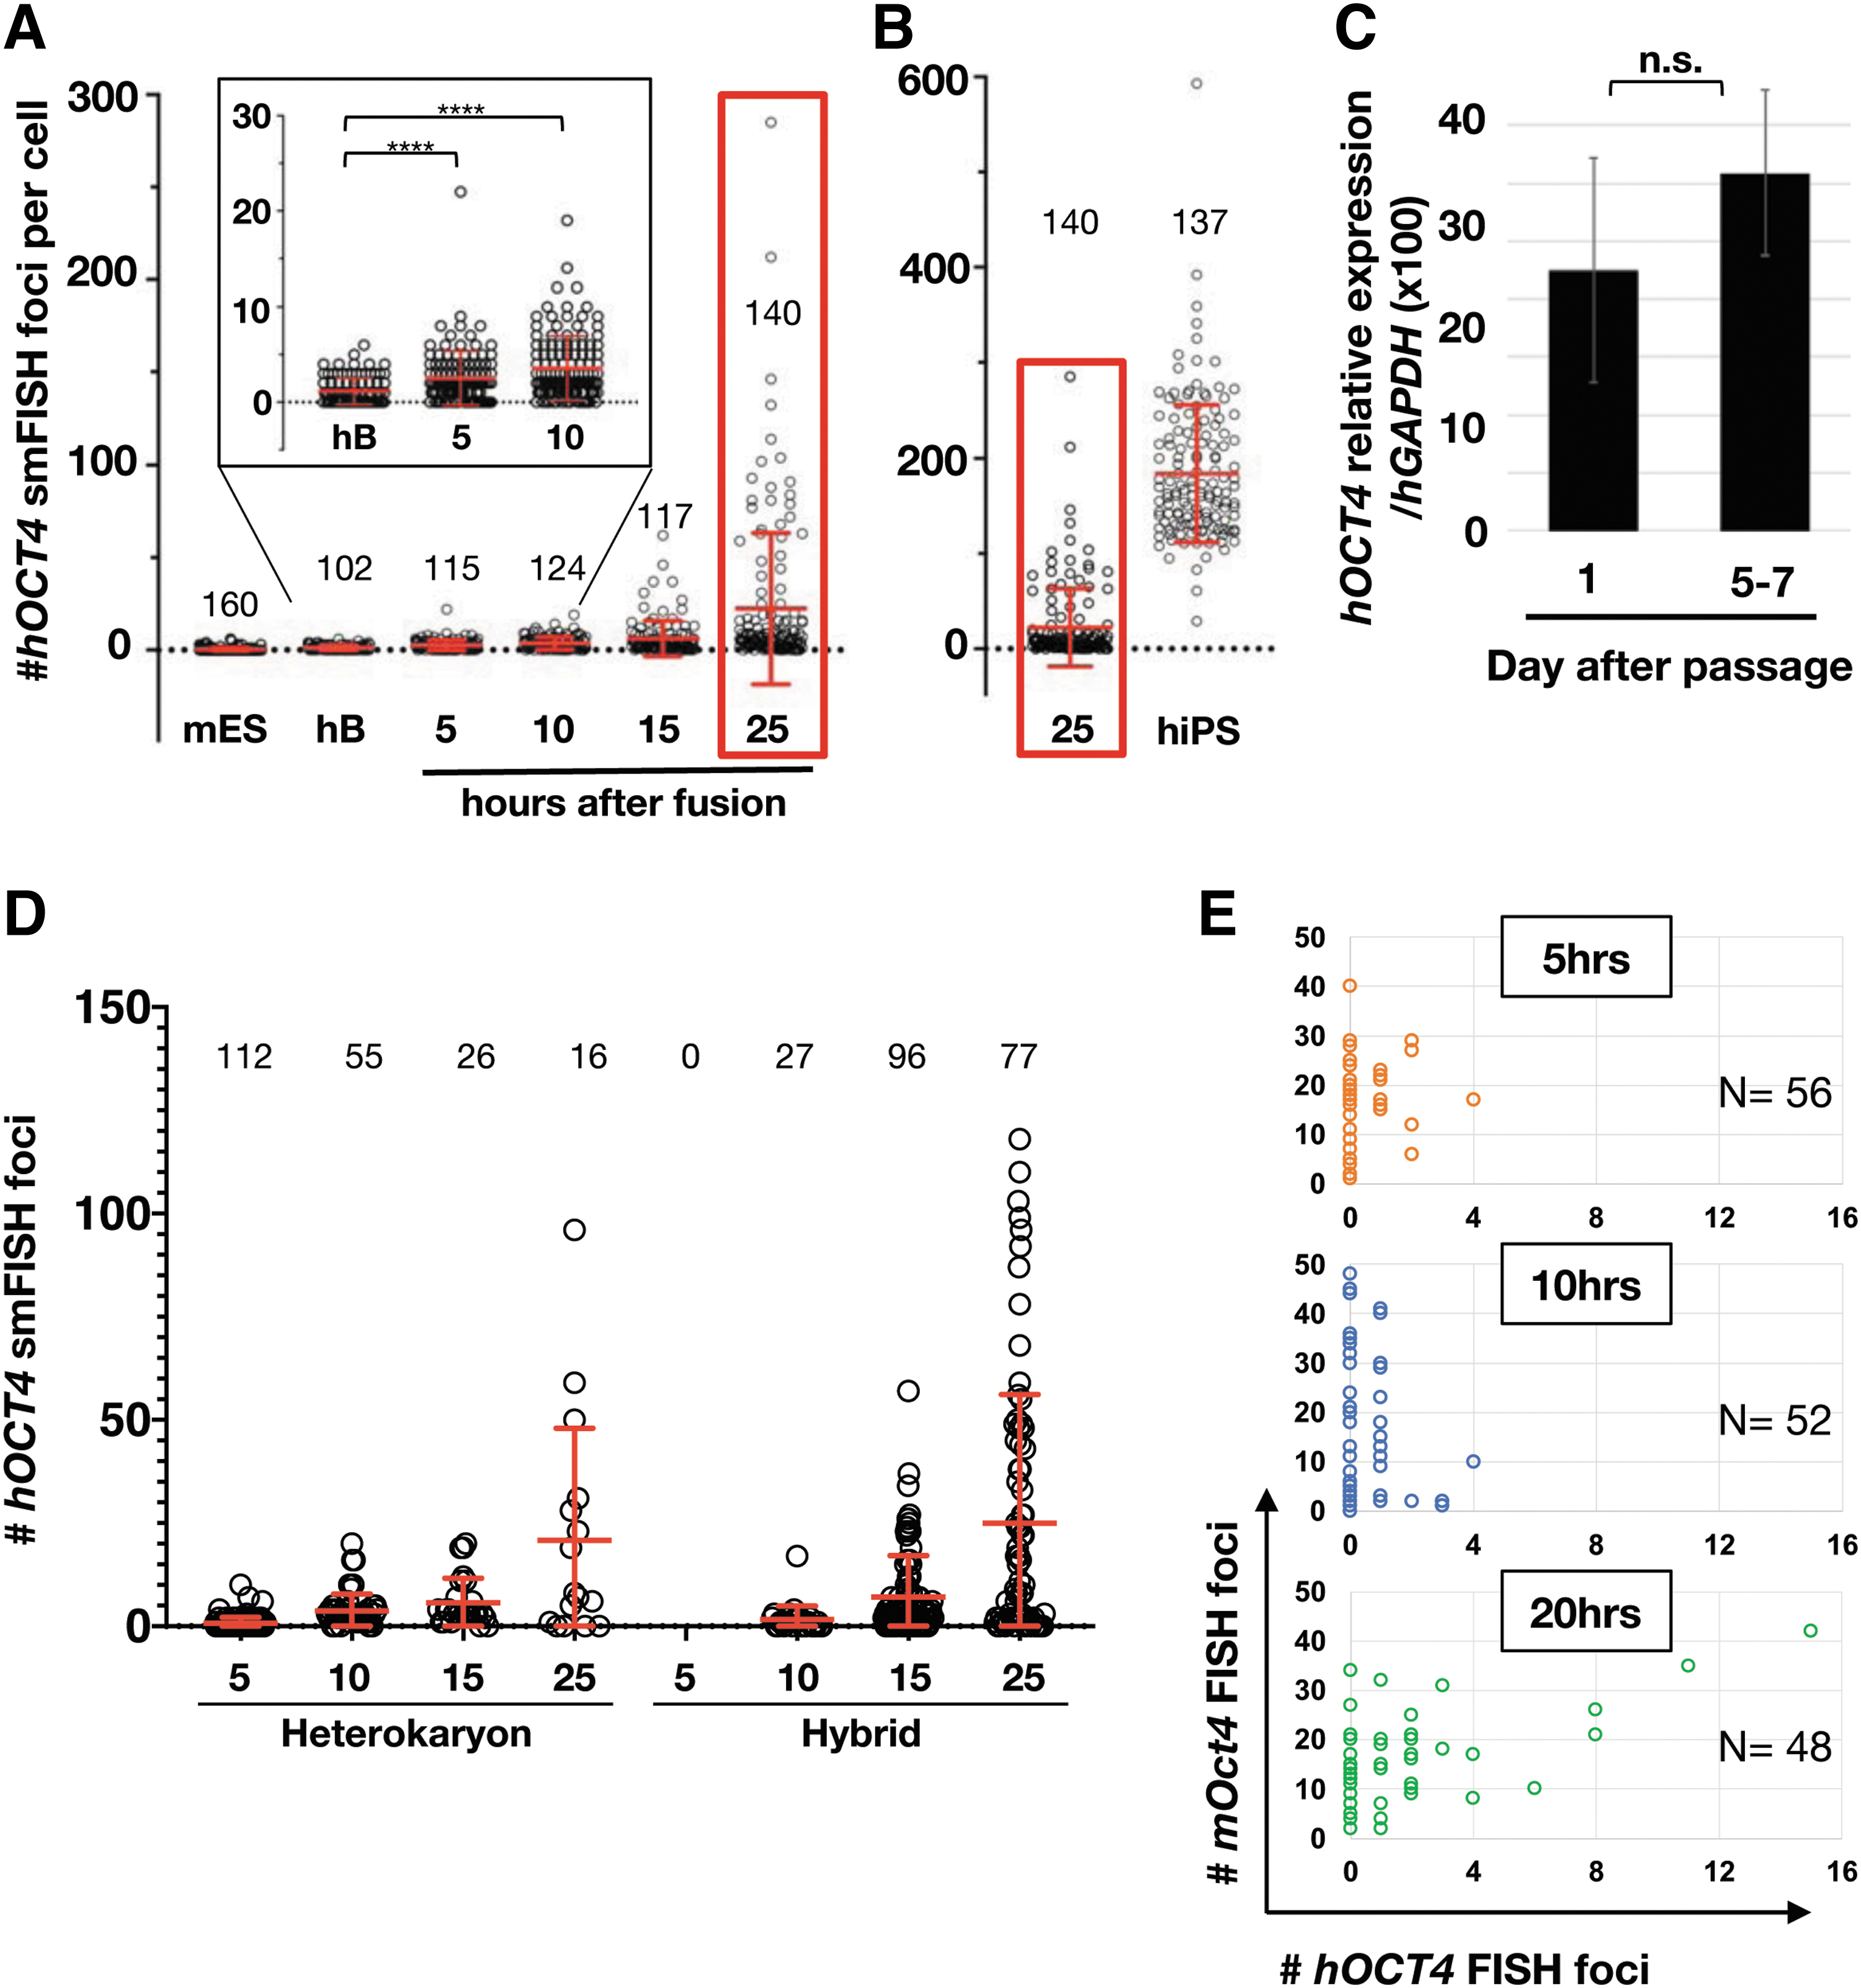
To monitor the kinetics of human OCT4 expression after cell fusion at the single-cell level, beads-sorted fused cells were plated in film-bottom dishes and were fixed at 5, 10, 15, and 25 hours after fusion (Fig. 4A). A small subset of fused cells started to express hOCT4 by 10 hours postfusion. As expected, we saw a wide range of hOCT4 expression levels between 10 and 25 hours after fusion. Interestingly, some cells exhibited hOCT4 expression levels within the range detected in human iPS (hiPS) cells at 25 hours after fusion (Fig. 4B). Because we use iPS cells fixed 24–25 hours after dissociation, we worried that we were underestimating hOCT4 expression levels by using semioptimal conditions for iPS cells. However, comparing hOCT4 levels between day 1 after dissociation and days 5–7 when tight colonies are formed, did not significantly affect hOCT4 expression (Fig. 4C). Previous reports suggested that OCT4 expression initiate before (Bhutani et al., 2010; Cantone et al., 2016; Pereira et al., 2008b) or after (Foshay et al., 2012) cell division. Since only fused cells that have not undergone cell division appear in the form of heterokaryons, we asked which type of fused cell express OCT4 (Fig. 4D). We found that within the same time point, average hOCT4 foci numbers exhibit no significant difference between heterokaryon and hybrids (Fig. 4D). The variation in hOCT4 levels was not attributable to differential Oct4 expression levels from mES nuclei (Fig. 4E).
De novo gene expression kinetics from hB lymphocyte after cell fusion.
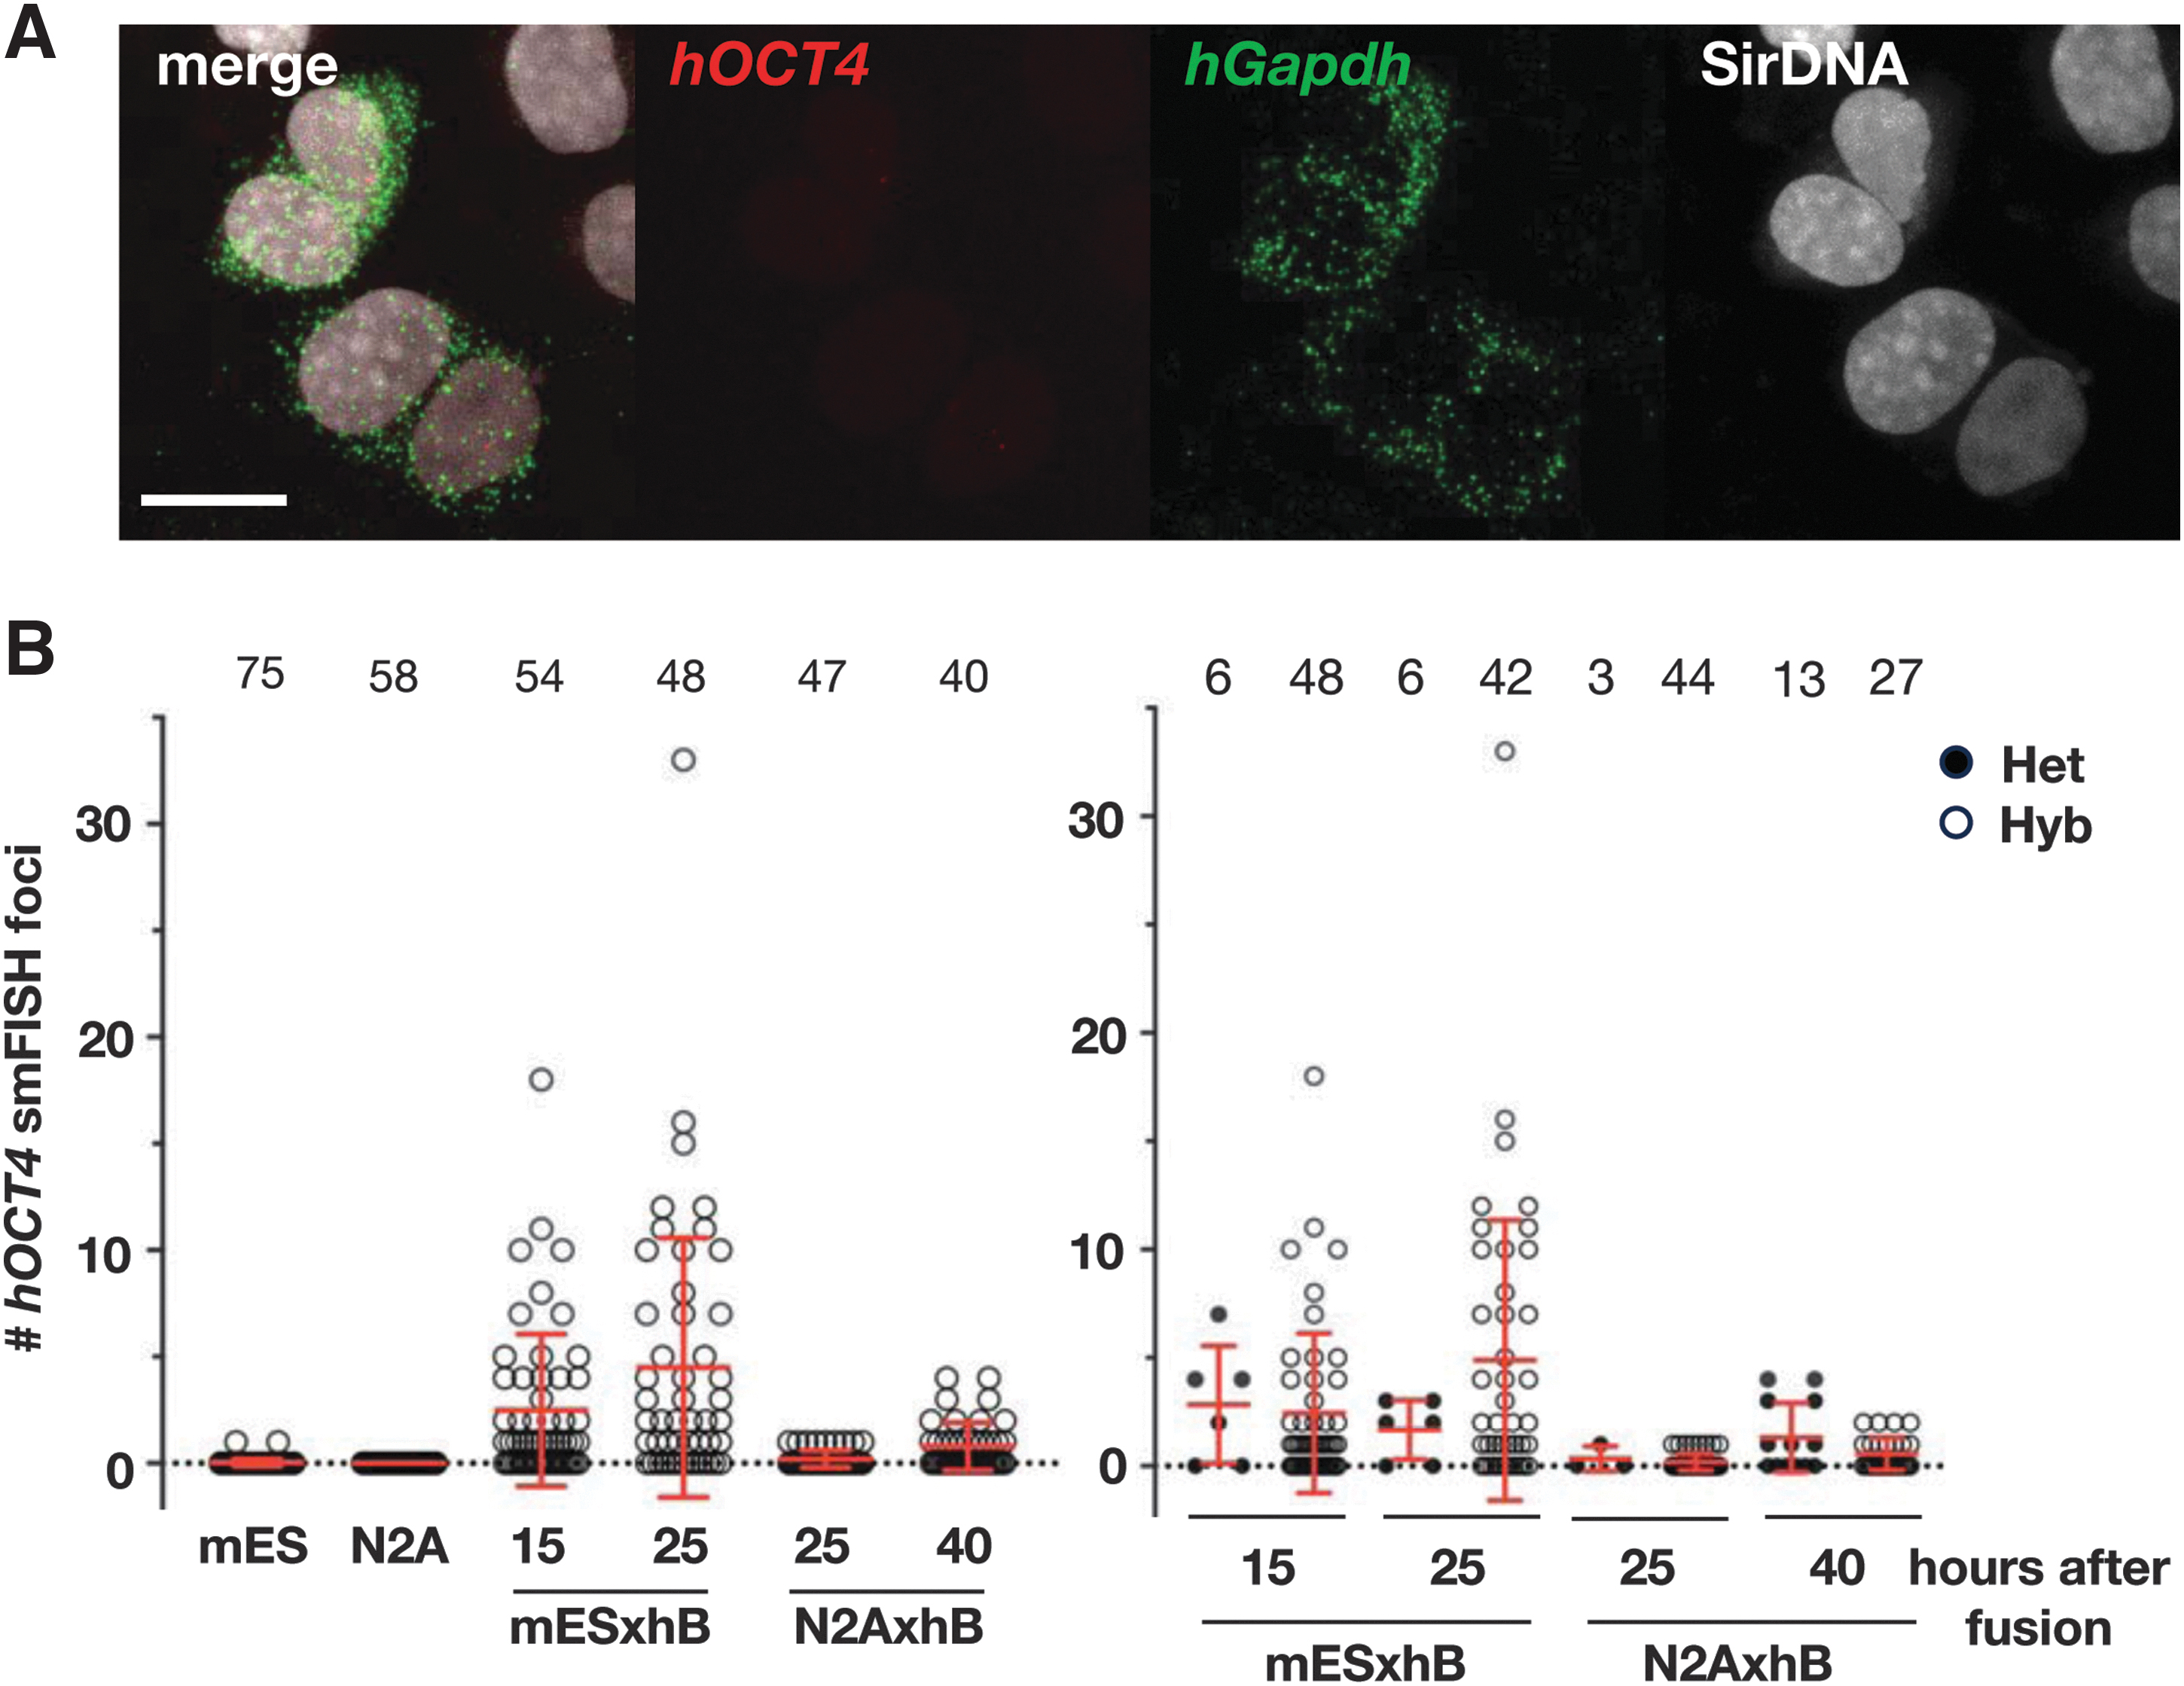
We then wanted to test whether alterations in gene-expression profiles could differ when hB cells were fused to nonpluripotent cells. To address this, we turned to the N2A cell line, which is derived from mouse neuroblasts, which could be fused with hB at a similar rate as with mES cells. We noticed that there were more heterokaryons at 25 hours after fusion compared to mES-hB fusion, when N2A was used instead of mES (Fig. 5A, B). Thus, we took a later time point (40 hours after fusion), but robust hOCT4 expression was not evident. These findings underscore that hOCT4 expression is not solely induced through the stress caused by the fusion procedure, nor solely through genome duplication. Although exceedingly faint, hOCT4 foci were detected on occasion, but the frequency and trend lacked reproducibility.
Cell fusion between N2A does not induce de novo expression of OCT4 gene at a level induced by fusion with mES cells.
Here we aimed to establish a protocol to carry out microscopic studies, without the need for drug-based selection or FACS sorting of fused cells. Through smFISH studies, we have shown that reprogramming initiates by 10 hours after fusion, with some cells expressing the OCT4 gene at levels comparable to hiPS cells as early as 25 hours after fusion. This is intriguing considering that commonly used reprogramming methods to establish hiPS lines generally take weeks to complete, and OCT4 is usually considered one of the mid- to late-stage markers for reprogramming.
More recently, the whole genome duplication induced by drugs that interfere with mitosis has been shown to induce features resembling cancer stem cells (Gemble et al., 2022; Zhou et al., 2022). As such polyploid giant cells (PGGCs) have been observed in solid tumors, and mitotic errors can occur at higher rates in certain cancer types. PGGCs induced through mitotic interference are thought to serve as a good model to investigate the etiology of cancer. Interestingly, several pluripotency-associated genes including OCT4 and NANOG are expressed in PGGCs, sharing features with pluripotent stem cells. Similar to cell fusion studies, reprogramming occurs only in a subpopulation of the PGGCs, and the underlying molecular causes for reprogramming and acquisition of stemness are not fully understood. Further studies using our system will provide insight into how mammalian cells acquire stemness in both experimentally induced and disease-associated contexts.
Footnotes
Acknowledgments
We thank Dr. Hiroyuki Sasanuma (Tokyo Metropolitan Institute of Medical Science) for the TK6 hB cells carrying H2B-mCherry and Dr. Hideo Tsubouchi (Tokyo Institute of Technology) for establishing mES cell line carrying LaminB1-mClover. We also thank members of the Tsubouchi Lab, NINS-ExCELLs core facility, and NIBB core facilities for their technical support.
Authors' Contributions
T.K. designed and performed experiments. C.Y. performed experiments in Figures 1 and ![]() . T.T. conceived, designed, and directed experiments. T.T. wrote the article.
. T.T. conceived, designed, and directed experiments. T.T. wrote the article.
Author Disclosure Statement
The authors declare they have no conflicting financial interests.
Funding Information
This study was supported in part by JSPS KAKENHI grant no. JP 16H01412, JST (PRESTO)(grant no. JPMJPR18K8), JST (Moonshot R&D)(grant no. JPMJMS2217).