
Abstract
Abstract
Background:
The objective of this study was to determine the longitudinal prevalence and predictors of dietary underreporting in African-American preadolescent girls and the association of baseline dietary underreporting with changes in BMI over a 2-year period as part of the Girls health Enrichment Multi-site Studies (GEMS).
Methods:
Energy was summarized at baseline, 12 months, and 24 months and computed as a 3-day average of 24-hour dietary recalls. Physical activity was assessed by accelerometer, basal metabolic rate was estimated using the World Health Organization's prediction equation, and caloric underreporting was based on the Goldberg equation.
Results:
We classified 48% of the girls at baseline as underreporters; with underreporting increasing over time (61% at 12 months; 66% at 24 months). Intervention treatment assignment did not affect the prevalence of underreporting over time. The consistency of underreporting (or not) stayed stable over time. Across all three time points, a higher BMI predicted underreporting. Baseline dietary underreporting and baseline BMI were found to be the major predictors of change in BMI, whereas baseline dietary variables did not predict change in BMI.
Conclusions:
Dietary underreporting was extremely common in this sample of AA preadolescent girls and predictive of change in BMI. Given the magnitude and consistency of dietary underreporting along with the fact that no dietary variables predicted change in BMI, measurement of dietary intake in preadolescents, even with sophisticated measurement methodologies, appears biased. The best use of dietary recalls may not be to estimate dietary intake but rather to determine underreporting.
Introduction
There are three primary methods of assessing dietary intake in clinical trials and epidemiologic studies: Dietary records, food frequency questionnaires, and dietary recalls. Although these three approaches to collecting dietary intake data have their strengths and weaknesses in terms of accuracy and feasibility, several studies have reported that the method of multiple dietary recalls on nonconsecutive days is the preferred and most reproducible method of dietary assessment in children. 8 Johnson recommends a minimum of 3 nonconsecutive days of dietary recall consisting of at least one weekend day for adults. 9
Regardless of which method of dietary intake is used, there is strong evidence that dietary underreporting is very common.10–13 In adults, several studies using different methodologies have consistently found underreporting. Estimates in the adult population range from 27% to 65%.14–17 Predictors of dietary underreporting include age, socioeconomic status, and weight status, with the most consistent and strongest predictor being BMI.18–20 That is, overweight and obese adults are at highest risk of dietary underreporting. 21
However, less is known about the prevalence and predictors of dietary underreporting in children and adolescents. Estimates of underreporting vary significantly, ranging from 4.9% in a large French cohort of children and preadolescents 22 to 49% in a sample of over 600 predominantly Mexican-American children. 23 Champagne and colleagues found significant dietary underreporting when comparing 8-day food records to doubly-labeled water, with African-American children more likely to underreport (37%) than white children (13%). 24 In a biracial cohort of adolescents and young adults, Kimm et al. found most black women and almost all white women in their late teens underreported their dietary intake. These investigators also found “drive for thinness” and BMI associated with underreporting in black participants but not in whites. 25 However, despite the aforementioned, the majority of investigations of dietary misreporting have studied predominantly white children and adolescents, and relatively few studies have explored racial and/or gender differences. 8 Predictors of dietary underreporting in children have not been well elucidated, but similar to adults, overweight status and increasing age appear to be the strongest and most consistent predictors.8,22,26–30
Several issues are crucial for understanding the utility and accuracy of dietary assessment. For example, what is the prevalence of dietary underreporting in the same cohort over time? Does underreporting increase or decrease over time? An important methodologic issue is whether dietary underreporting is a systematic bias or random error.13,31 That is, are the same individuals underreporting consistently over time or is this bias a random phenomenon? If the bias is random, this error can potentially be overcome using larger sample sizes. If the error is nonrandom, this poses a much more difficult methodological challenge. 32 Additionally, there have been calls to determine if dietary interventions per se either increase or decrease the prevalence of underreporting.16,33 Perhaps the focus on nutrition (and several dietary assessments) in a nutrition intervention reduces the prevalence of underreporting. On the other hand, the intervention focus may actually increase underreporting, due to demand characteristics. Finally, evaluation of dietary underreporting as an independent predictor of change in BMI above and beyond potential dietary intake and exercise predictors is important for interventionists as they try to identify those children at most risk for increasing their BMI over time. Given that African-American girls are more likely to underreport dietary intake than Caucasian girls, 25 they constitute a high-risk and important group to evaluate.
Thus, the purpose of this investigation was to determine the longitudinal prevalence and predictors of dietary underreporting in a cohort of preadolescent (8- to 10-year-old at baseline) African-American females and the association of baseline dietary underreporting with changes in BMI over a 2-year period.
Methods
Participants and Procedures
This was a secondary analysis from a randomized controlled trial of a community-based obesity prevention intervention. The Girls health Enrichment Multi-site Studies (GEMS) investigation was a two-group design, a weight gain prevention intervention, and an alternative self-esteem intervention. Both groups included 14 weekly meetings and then monthly meetings for 20 months (34 sessions over 2 years). The trial is described in detail elsewhere.34,35 The sample for this analysis consisted of 183 African-American girls who completed measures and three dietary recalls at three time points (baseline, 12 months, 24 months).
Measures
Dietary Recall
Dietary intake was assessed by trained interviewers with computer-assisted dietary recall interviews and analyzed with Nutrition Data System for Research (NDS-R) 2005 software (Nutrition Coordinating Center, University of Minnesota, Minneapolis, MN). At three time points (baseline, 12 months, and 24 months), each girl completed three interviews on nonconsecutive days (83.1%, 82.0%, and 94% of recalls included a weekend day at baseline, 12 months, and 24 months, respectively). Standardized methods were used, and quality control procedures included a multiple-pass approach and probes.36,37 The first 24-hour recall occurred face-to-face, and the subsequent recalls were conducted by telephone. Pretrial focus groups revealed parental awareness of what their child was eating was low. Many participants were “latch-key” kids who were responsible for preparing their own meals, with many eating breakfast and lunch at school (copies of the school breakfast and lunch were available to aid in the collection of the dietary recalls). For these reasons, as well as that by age 8 years there is a rapid ability of children to self-report food intake,38,39 parents were not required to be present during the interviews. Dietary data were averaged across the three interviews at each time point. Only girls who completed all nine dietary recall interviews (three at each time point) were included in analyses.
Dietary Intake Underreporting
We followed a strategy for estimating underreporting that was similar to the approach used in a previous adult study by Klesges et al. 21 Basal metabolic rate (BMR) was estimated by the World Health Organization (WHO) prediction equation based on height and weight. The minimum energy intake required for survival was then estimated using methods described by Goldberg et al. 40 These investigators determined that the average ratio of total energy expenditure to basal metabolic rate was 1.35 (for studies of whole-body calorimetry) and 1.67 (for studies of doubly-labeled water). Values from 1.35 to 1.67 represent the range of energy needed to maintain body weight beyond metabolic costs typically supported by consumption between 35% and 67% more kilocalories. Similar to Klesges et al., 21 in an effort to avoid overestimating underreporters, we chose a conservative minimum cutoff of 0.92, the lower 95% confidence interval (CI) of the Goldberg 1.35 estimate; that is, a reported intake of only about 90% of estimated basal metabolic rate. Thus, individuals reporting a total energy intake of less than 0.92 times their BMR were considered implausible reporters (underreporters). Bear in mind this is extremely conservative, even considering the low activity level of our population, because this includes some individuals reporting at an intake ratio lower than what is defined as starvation diets by the WHO.41,42 For this reason, a secondary analysis was also performed using an estimate of 1.2 times BMR as a cutoff point for defining underreporting, which could still be considered quite conservative for our population. 43
Reporting style fell into one of three categories: (1) Consistent underreporting in which the participant underreported her dietary intake at all three measurement sessions (baseline, 12- and 24-month follow-ups); (2) consistent plausible reporting in which the participant reported a plausible intake at all three time points; (3) inconsistent reporting in which the participant was neither a consistent underreporter nor consistent plausible reporter.
Baseline physical activity
Average daily physical activity was estimated from accelerometer data. Girls wore an MTI actigraph (Model 7164 WAM; Manufacturing Technologies, Fort Walton Beach, FL) for 3 consecutive days. The variable of interest was average daily minutes of moderate to vigorous activity across the three days.
Baseline demographic information
Demographic variables were girl's age, caregiver's age, household income, caregiver education, and number of adults and children living in the household.
Intervention and comparison groups
In the original trial,34,35 girls were randomly assigned to one of two groups. The active intervention promoted healthy eating, increased moderate-to-vigorous physical activity (MVPA), and decreased sedentary behavior. The alternative intervention focused on self-esteem and social efficacy. There was no focus on changing behaviors at home or activities related to diet, physical activity, or body weight. Group assignment was examined as a potential covariate.
BMI
Both girls' and caregivers' baseline BMI values were calculated at all three time points.
Psychosocial Variables
Social desirability
We assessed potential response bias related to social desirability with the nine-item “Lie” subscale from the Revised Children's Manifest Anxiety Scale (RCMAS). 44 Internal consistency in our sample was 0.72.
McKnight Weight Control Behaviors subscale
Risk factors for disordered eating were measured with the six-item subscale from the McKnight Risk Factor Survey. 45 The Cronbach α from GEMS Phase 2 was 0.75.
Self-efficacy for healthy eating
This measure was adapted from the original version used in the “High 5” study 46 and validated in GEMS phase 2; the Cronbach α was 0.82. 47
Concern about child's weight
Three items from the Child Feeding Questionnaire pertain to caregiver concern for child's weight. 48 In GEMS Phase 2, the Cronbach α=0.90.
Health awareness
This included four items pertaining to caregiver awareness of child's body weight, general appearance, eating habits, and perception of child's weight being a health problem. 49 In GEMS Phase 2, the Cronbach α=0.86.
Family support for healthy eating
This caregiver questionnaire is a six-item subscale derived from the original 11-item measure 50 and validated in GEMS Phase 2. All six items corresponded to offering positive support for healthy eating and showed good internal consistency (Cronbach α=0.83). 47
Results
Approach to Analysis
Statistical analyses were performed with SAS 9.2 (SAS Institute, Inc., Cary, NC). Prevalence of underreporting across time was assessed with the McNemar test. Report status by treatment group assignment was compared using chi-squared analysis. Multinomial logistic regression was used to examine demographic and psychosocial predictors of consistent underreporting and inconsistent reporting from baseline to 24 months relative to consistent plausible reporting. The PROC GLM procedure was used to examine mean differences among consistent underreporters, consistent plausible reporters, and inconsistent reporters at each time point. Mixed model analysis was used to examine predictors of change in BMI from baseline to 24 months. At each time point, mean differences in dietary intake as a function of report status (underreporter vs. plausible reporter) were tested using PROC MULTTEST with Hochberg adjustment for multiple comparisons.
Baseline Demographics and Prevalence of Underreporting Over Time
Overall sample baseline demographics are reported in Table 1 and show that 48% of the participants at baseline were underreporters, whereas 52% were plausible reporters. In this sample, the prevalence of dietary underreporting increased to 61% at 12 months and 66% at 24 months (p<0.01).
Sample Baseline Characteristics (mean [SD], range or n [%], n=183)
SD, Standard deviation.
Consistency of Dietary Underreporting Over Time
To determine whether dietary underreporting is a pattern in the same individuals over time, we first determined the dietary reporting status of participants at baseline and classified them as either underreporters or plausible reporters. Then, we determined the probability of participants being either an underreporter or a plausible reporter at the 12-month follow-up, at the 24-month follow-up, and both at the 12- and 24-month follow-up. These results are displayed in Table 2. Across all three time points, 35% of participants were consistent underreporters, 21% were consistent plausible reporters, and 44% were inconsistent reporters. Note that dietary underreporting is relatively stable; 74% of baseline underreporters remained consistent underreporters, yet only 40% of baseline plausible reporters were consistent across time.
Probability of Reporting Status Based on Baseline Reporting Status (0.92 Cutoff )
UR, Underreporter.
Does An Aggressive Dietary Intervention Impact Reporting Status?
Report status was independent of group treatment assignment at both 12 months [χ2 (1)=0.064, p=0.80] and 24 months [χ2(1)=0.002, p=0.96].
Predictors of Underreporting
The tested baseline demographic variables were age, caregiver age, caregiver education, household income, and number of adults and children living in household. Also tested were baseline moderate-to-vigorous activity, group assignment, caregiver BMI, and all baseline psychosocial measures. The trajectory of BMI as a function of reporting status is shown in Figure 1. Average BMI for consistent underreporters is higher at all three time points than average BMI for both consistent plausible reporters and inconsistent reporters. In contrast to BMI, minutes of moderate-to-vigorous activity were substantially lower among underreporters (Fig. 2).

The relationship between BMI and underreporting status over time.
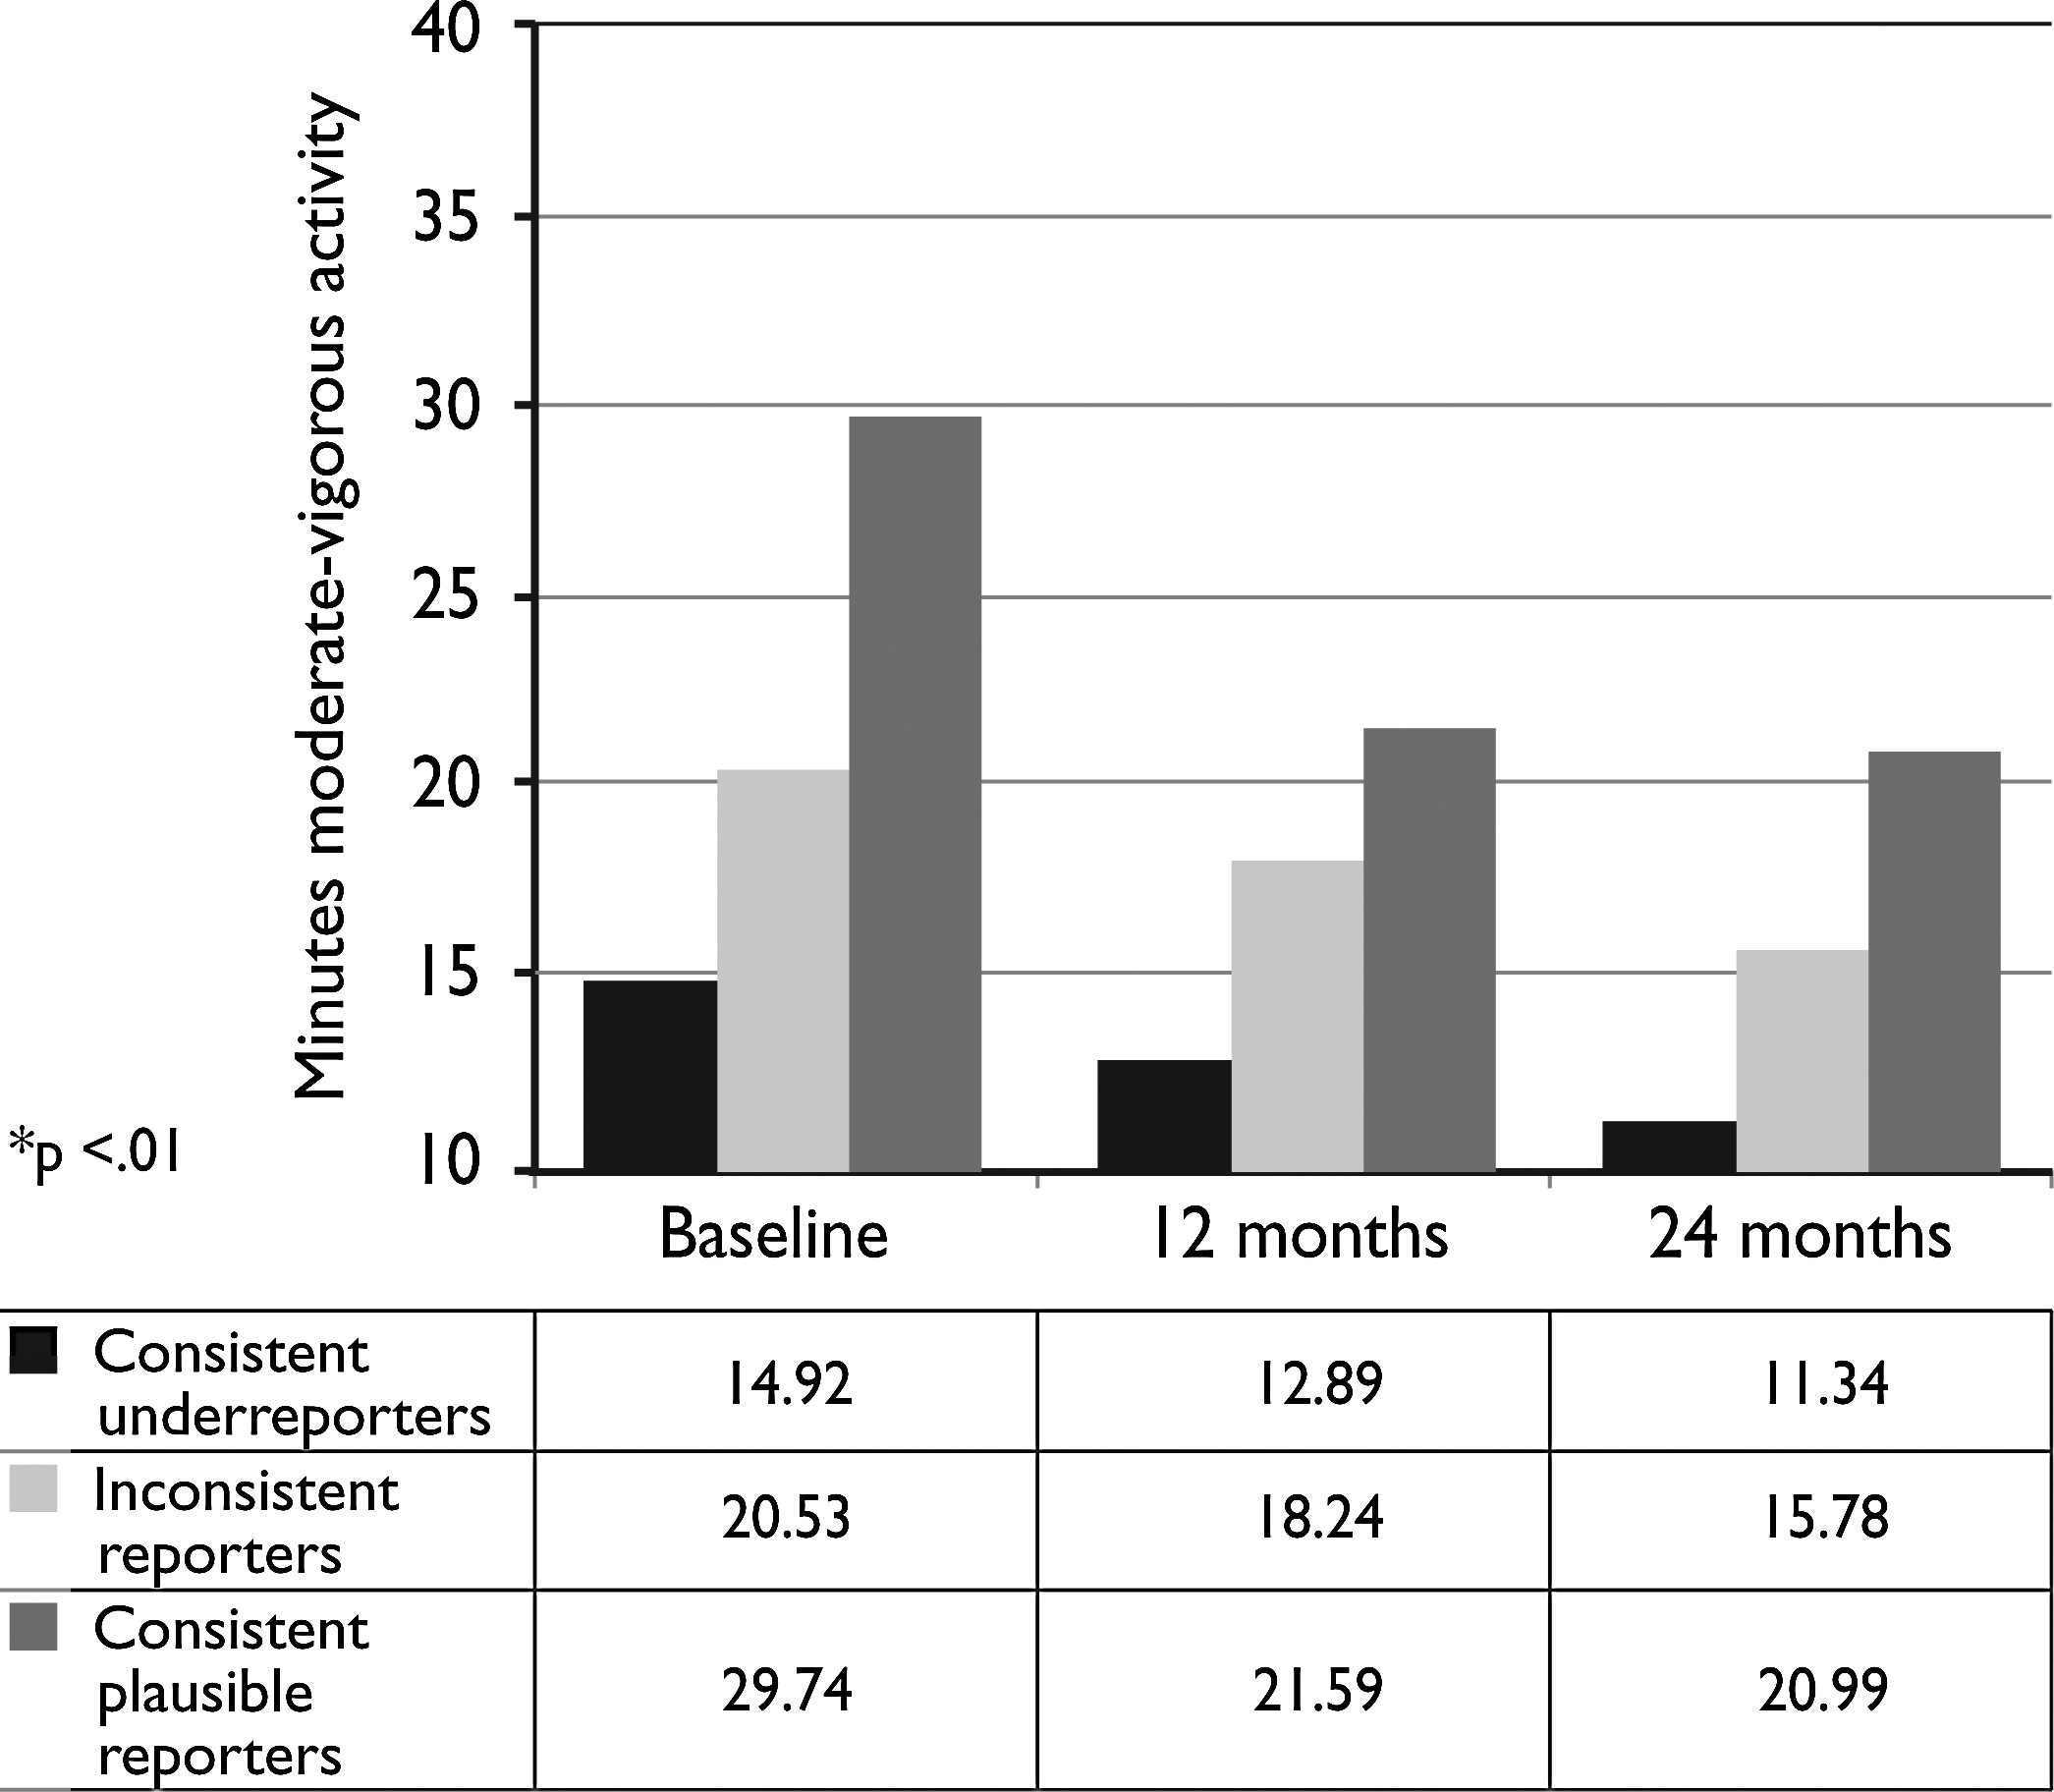
The relationship between physical activity and dietary reporting status over time.
Results of the logistic regression analysis examining predictors of consistent underreporting are shown in Table 3, which shows results from both the saturated model and the final model in which the only significant predictor of consistent underreporting was girls' baseline BMI [odds ratio (OR)=1.91, 99% CI 1.46–2.51, p<0.01]. No psychosocial predictors were significant. Girls' BMI was also a significant predictor of inconsistent reporting across time compared to consistent plausible reporting (OR=1.51, 99% CI 1.17–1.94, p<0.01). Figure 1 graphically depicts higher average BMI among consistent underreporters across all three time points (p<0.01 at each time point).
Odds of Consistent Underreporting or Inconsistent Reporting Compared to Consistent Plausible Reporting of Dietary Intake Across Three Time Points (n=183)
OR, Odds ratio; CI, confidence interval; ref, reference group.
Predictors of Change in BMI
In the mixed-model analysis used to investigate BMI across time, and controlling for girls' baseline BMI, we examined the same baseline demographic variables along with group assignment, baseline reporting status, and baseline psychosocial, physical activity, and self-reported dietary intake variables as predictors of BMI across the 12- and 24-month follow-ups. Significant predictors were girls' baseline BMI (F[1, 180]=1949.66, p<0.01), time (F[1,180]=150.16, p<0.01) and baseline dietary reporting status (F[1, 180]=4.24, p=0.04), with a mean gain of 3.5 points in BMI across 24 months among baseline underreporters compared to a mean gain of 2.2 points among baseline plausible reporters. The baseline reporting status by time interaction was not significant. Table 4 shows the distribution of dietary intake variables across three time points according to dietary reporting status at each time point. As can be seen, reported calcium and sodium intake was lower among underreporters compared to plausible reporters at all three time points.
BMI and Dietary Intake Variables by Reporting Status over Time [Mean (SD)]
Plausible, Plausible reporters.
SD, Standard deviation; UR, underreporters.
Effect of Raising the Underreporting Cutoff to 1.2 Times BMR
As would be expected, the number of underreporters increases when applying a less conservative cutoff point. As with the 0.92 cutoff, the prevalence of underreporting increased over time. In all, 73%, 80%, and 88% of the participants were underreporters at baseline, 12 months, and 24 months (p<0.01). Across all three time points, 62% of participants were consistent underreporters, only 4% were consistent plausible reporters, and 32% were inconsistent reporters. Dietary underreporting was stable, with 86% of baseline underreporters remaining consistent underreporters; however, only 16% of baseline plausible reporters were consistent across time (Table 5). Reporting status remained independent of treatment status, and predictors of change in BMI remained the same as those in the models using the 0.92 cutoff (data not shown). Logistic regression analysis examining predictors of consistent underreporting could not be performed given there were only 8 (4%) consistent plausible reporters for comparison using the 1.2 cutoff value.
Probability of Reporting Status Based on Baseline Reporting Status (1.2 Cutoff )
UR, Underreporter.
Discussion
Our analysis of dietary underreporting indicates this phenomenon is extremely common in preadolescent African-American girls, even when applying an extremely conservative criteria for underreporting, and increases over time, from 48% at baseline, 61% at 1 year, and 66% at the 2-year follow-up. Thus, two-thirds of the cohort are underreporting. We observed that the prevalence of underreporting was not affected by participating in an intensive weight gain prevention intervention that included extensive nutritional information. Finally, whereas baseline levels of physical activity predicted changes in BMI at a 2-year follow-up, dietary underreporting, and not dietary intake, predicted change in BMI.
Almost half of all participants were underreporting at baseline and the prevalence of underreporting increased with increasing age. This high degree of underreporting, despite the use of an extremely conservative definition of underreporting, may be potentially explained by several factors. First, our study population had a high prevalence of obesity and overweight, which had consistently been associated with dietary underreporting. Over one-third of the cohort had a BMI over the 95th percentile for age and gender, and over one-half had a BMI over the 85th percentile. Second, similar to Garcia-Dominic et al., 23 who evaluated dietary reporting in 9-year-old Mexican-American children, the majority of this cohort was from low-income families where it is possible that food insecurity or food insufficiency might affect the accurate documentation of “usual” food intake. Last, multiple studies have demonstrated lower BMR in prepubertal and pubertal African-American girls compared with white girls.51–54 Although this should account for some degree of decreased reporting of energy intake, it does not account for the degree that was reported by this cohort; however, it does suggest that the magnitude of underreporting (reporting near starvation levels) may be overestimated. Moreover, regarding the high degree of underreporting over time, Bandini et al. 30 and Lioret et al. 22 report that underreporting was higher in older children, and our study provides longitudinal evidence that this occurs within the same children. Future studies should follow children and adolescents for longer periods of time to determine the ages at which the risk of underreporting is the greatest.
Baseline underreporting status was highly predictive of consistent underreporting. Moreover, it is disturbing to see that girls consistently underreported at a much higher rate than girls consistently plausibly reported over time. When one excludes those that consistently underreported (35%) along with those that inconsistently reported (i.e., underreported at least once in the 2-year period, 44%), only 21% of girls accurately reported their intake over time. The magnitude and consistency of underreporting, along with the trials quality control methods designed to reduce random error36,37 suggest that much of the underreporting was systematic error. The computerized multiple-pass and probe system was used to improve interviewing skills and reporting accuracy by helping respondents with memory and quantification of amounts consumed, and limiting inconsistencies in how information was asked and recorded. Because the participants were interviewed without parental input, changes in parental participation in the recall were eliminated as a source of error. That said, dietary assessment remains complex and challenging. Many factors not examined in this study (e.g., respondent burden, social desirability, learning effects) may influence data quality over time and be a source of random error. Future studies should consider these factors.
Obesity status is a common predictor of dietary underreporting in adults55,56 and children.22,28,39,57,58 Our results support previous reports that overweight status is a predictor of diet underreporting in African-American girls. Few other predictors of dietary underreporting have been reported in the literature, particularly for African-American adolescents. While future studies should try to identify other predictors of underreporting in children, studies appear to be consistently reporting that BMI and age are the primary predictors of underreporting in children.8,22,26–30
Consistent with Kimm et al., 58 whose notable data showed significant declines in physical activity among African-American girls as they moved from preadolescents to adolescents, all participants regardless of intervention or dietary reporting status showed downward trends in physical activity over time. However, dietary underreporters had substantially lower minutes of moderate-to-vigorous physical activity than either consistent reporters or inconsistent reporters (Fig. 2). Although one is tempted to conclude that the lower levels of physical activity may have resulted in lower energy requirements and, therefore, in part, explain the dietary underreporting, it should be pointed out that the level of dietary underreporting, along with the high BMIs, makes this explanation tenuous. However, future research should evaluate the relationships among dietary intake, physical activity, and accurately reporting these behaviors.
The analysis of change in BMI from baseline to follow-up indicated that while baseline reporting status strongly predicted change in BMI, no baseline dietary intake measures predicted change in BMI. If one is interested in baseline variables that place a girl at risk for increases in BMI, currently the best use of dietary recalls for predictive validity would be not to estimate dietary intake but to determine the girls that are underreporting dietary intake. However, one must caution against concluding that measurement of dietary intake is too imprecise to measure in children, given the huge importance of measuring dietary intake, particularly given the current epidemic of childhood obesity. 59 Development of strategies for improving the accuracy of dietary recall assessment is one potential solution. Alternative strategies include relying more on direct observation of food intake; however this option is costly and has a heavy investigator and participant burden. Approaches based on emerging technologies, such as mobile phones, digital cameras, and Web-based systems, which offer the potential for more acceptable (for study participants) and less laborious (for researchers and participants) routes to “real time” and more accurate data collection, are also being explored60–62 and may offer the best solutions to decrease measurement error and improve validity.
Although this study has several strengths, including a prospective assessment of dietary underreporting in a unique sample of African-American girls, limitations warrant discussion. First, actual metabolic rate was estimated and not objectively measured. Although the WHO calculation of BMR has been consistently reported as the most accurate for calculating children's BMR, evaluation of its accuracy was from predominantly nonminority populations.13,42 The equation used to calculate BMR may not account for ethnic differences in resting energy expenditure (REE). 63 Furthermore, it is unclear how confounders such as changes in weight and differences in growth, maturation, and age of menarche affect estimates of BMR and energy requirements. However, it is important to point out that our definition of underreporting was extremely conservative. We chose a minimum cutoff of only about 90% of estimated BMR. This includes some individuals reporting at an intake ratio lower than what is defined as starvation diets by the WHO. 41 By using such a conservative estimate, the chances of misclassifying underreporters is likely to remain low even when taking into account unmeasured confounders. However, this strategy does increase the chance of underestimating underreporters. Therefore, we performed a secondary analysis, which used a more liberal cutoff to define underreportering. This analysis revealed that 96% of our population underreported their dietary intake at least once during one of the three collection periods (Table 5).
Nevertheless, regardless of which cutoff estimate is used, our analyses suggest that underreporting is very high among our population, it is consistent across time, and it is a predictor of change in BMI. Another limitation was that, although physical activity was extremely low among the entire cohort, we did not attempt to individualize required minimal energy intake based on individual physical activity levels. However, by using such a conservative cutoff estimate in calculating minimal energy requirement from BMR, it is unlikely this significantly altered our results. Last, while certain aspects of the study may be viewed as strengths, from another perspective, they may also be viewed as limitations. Although it is generally accepted that by the age of 8–10 years children can reliably report their food intake, often as reliably as their parents, 39 we cannot rule out that consistent parental involvement may have increased validity of reporting, especially those with irregular eating patterns. Also, while there are few studies that include such a large cohort of African Americans, lack of demographic variability in the study might be considered a limitation. The current study was restricted to only African-American girls aged 8–10 years at baseline. Thus, generalizability to other ages and ethnic groups is problematic.
Conclusion
In summary, dietary underreporting appears to be highly prevalent in African-American preadolescent girls, and the vast majority of girls significantly underreport over time. The prevalence of dietary reporting, and not dietary intake variables, predict weight gain over time. Strategies designed to improve the accuracy of dietary assessment are desperately needed, not only to help evaluate obesity and nutritional interventions but also to better assess the relationships between diet and health.
Footnotes
Acknowledgments
This work was supported by cooperative agreements U01 HL062662 and U01 HL062663 from the National Heart, Lung, and Blood Institute, National Institutes of Health.
Author Disclosure Statement
The authors have no competing financial interests to declare.