
Abstract
Abstract
Background:
Fatty liver is highly prevalent among obese children and represents a major risk factor for chronic liver diseases and severe metabolic complications.
Methods:
We randomly assigned 17 obese children 8–17 years of age with fatty liver to either an experimental low-glycemic-load or conventional low-fat diet for 6 months. Participants in both groups received nutrition education and behavioral counseling of equal intensity. The primary outcome was hepatic lipid content measured by proton magnetic resonance spectroscopy. Secondary outcomes included change in visceral fat, BMI, anthropometrics, alanine aminotransferase (ALT), and insulin resistance.
Results:
A total of 16 participants completed the study. Reported glycemic load decreased in the low-glycemic-load group and reported dietary fat decreased in the low-fat group. At baseline, liver fat was 23.8% [standard deviation (SD) 12.2] in the low-glycemic-load group and 29.3% (14.1) in the low-fat group. Liver fat decreased substantially in both groups at 6 months expressed as absolute percentage change, with no between-group differences [−8.8 (standard error (SE) 4.1) vs. −10.5 (3.7)%, respectively, p=0.76 for group×time interaction]. Secondary outcomes also improved on both diets, with no between-group differences. Baseline and change in ALT were strongly associated with hepatic fat content.
Conclusions:
Weight-reducing diets focused either on glycemic load or dietary fat improved hepatic steatosis over 6 months. Additional research is needed to determine whether these diets differ in effectiveness over the long term.
Trial Registration:
clinicaltrials.gov Identifier: NCT00480922
Introduction
Low-glycemic-load (GL) diets designed to reduce the postprandial rise in blood glucose and insulin—either low carbohydrate or low glycemic index (GI)—have conceptual promise in the treatment of NAFLD and related metabolic parameters. The GI describes how a controlled portion of carbohydrate affects blood glucose in the postprandial period, whereas GL represents the multiplicative product of GI and total carbohydrate (and thus most closely predicts blood glucose responses to actual meals).11–14 Prior studies have indicated a beneficial effect of low-GL diets on body weight and risk for obesity-related complications.12,14,15
In a translational study, Scribner et al. 16 randomly treated mice with two diets differing in GI but controlled for macronutrients. After 25 weeks, body weight did not differ between groups, but liver fat was 50% lower in the low- versus high-GI group (9.6±4.9 vs. 20.7±9.4 mg/g, p=0.01). Among humans, a cross-sectional study involving 247 ostensibly healthy Italian adults reported a significantly higher risk of high-grade steatosis in those consuming high- versus low-GI diets. 17 In a nonrandomized study of 16 adults, liver fat increased during 3 weeks of high-GI carbohydrate overfeeding, and then decreased with weight loss. 18 Furthermore, randomized controlled trials of low-carbohydrate and low-GI diets have shown preliminary evidence of efficacy in the treatment of fatty liver and related metabolic abnormalities among adults.10,19,20 The aim of this pilot study was to compare the effects of a low-GL versus conventional low-fat diet in obese children with fatty liver.
Methods
Study Design
We randomly assigned obese children with hepatic steatosis, defined as ≥9% liver fat content, to an experimental (low-GL) or conventional (low-fat) dietary treatment group. Allocation was stratified by sex and pubertal status. Both groups received nutrition education, behavioral counseling, and exercise recommendations of comparable intensity, throughout a 6-month intervention (nine visits and seven telephone calls with a dietitian). The primary outcome, hepatic fat content by proton magnetic resonance spectroscopy (MRS), 21 and secondary outcomes related to the risk for diabetes and cardiovascular disease were measured at baseline and 6 months. The study was conducted at Boston Children's Hospital between August, 2007, and August, 2010. The Institutional Review Board at Boston Children's Hospital approved the trial, which was registered at ClinicalTrials.gov (ID NCT00480922).
Participants
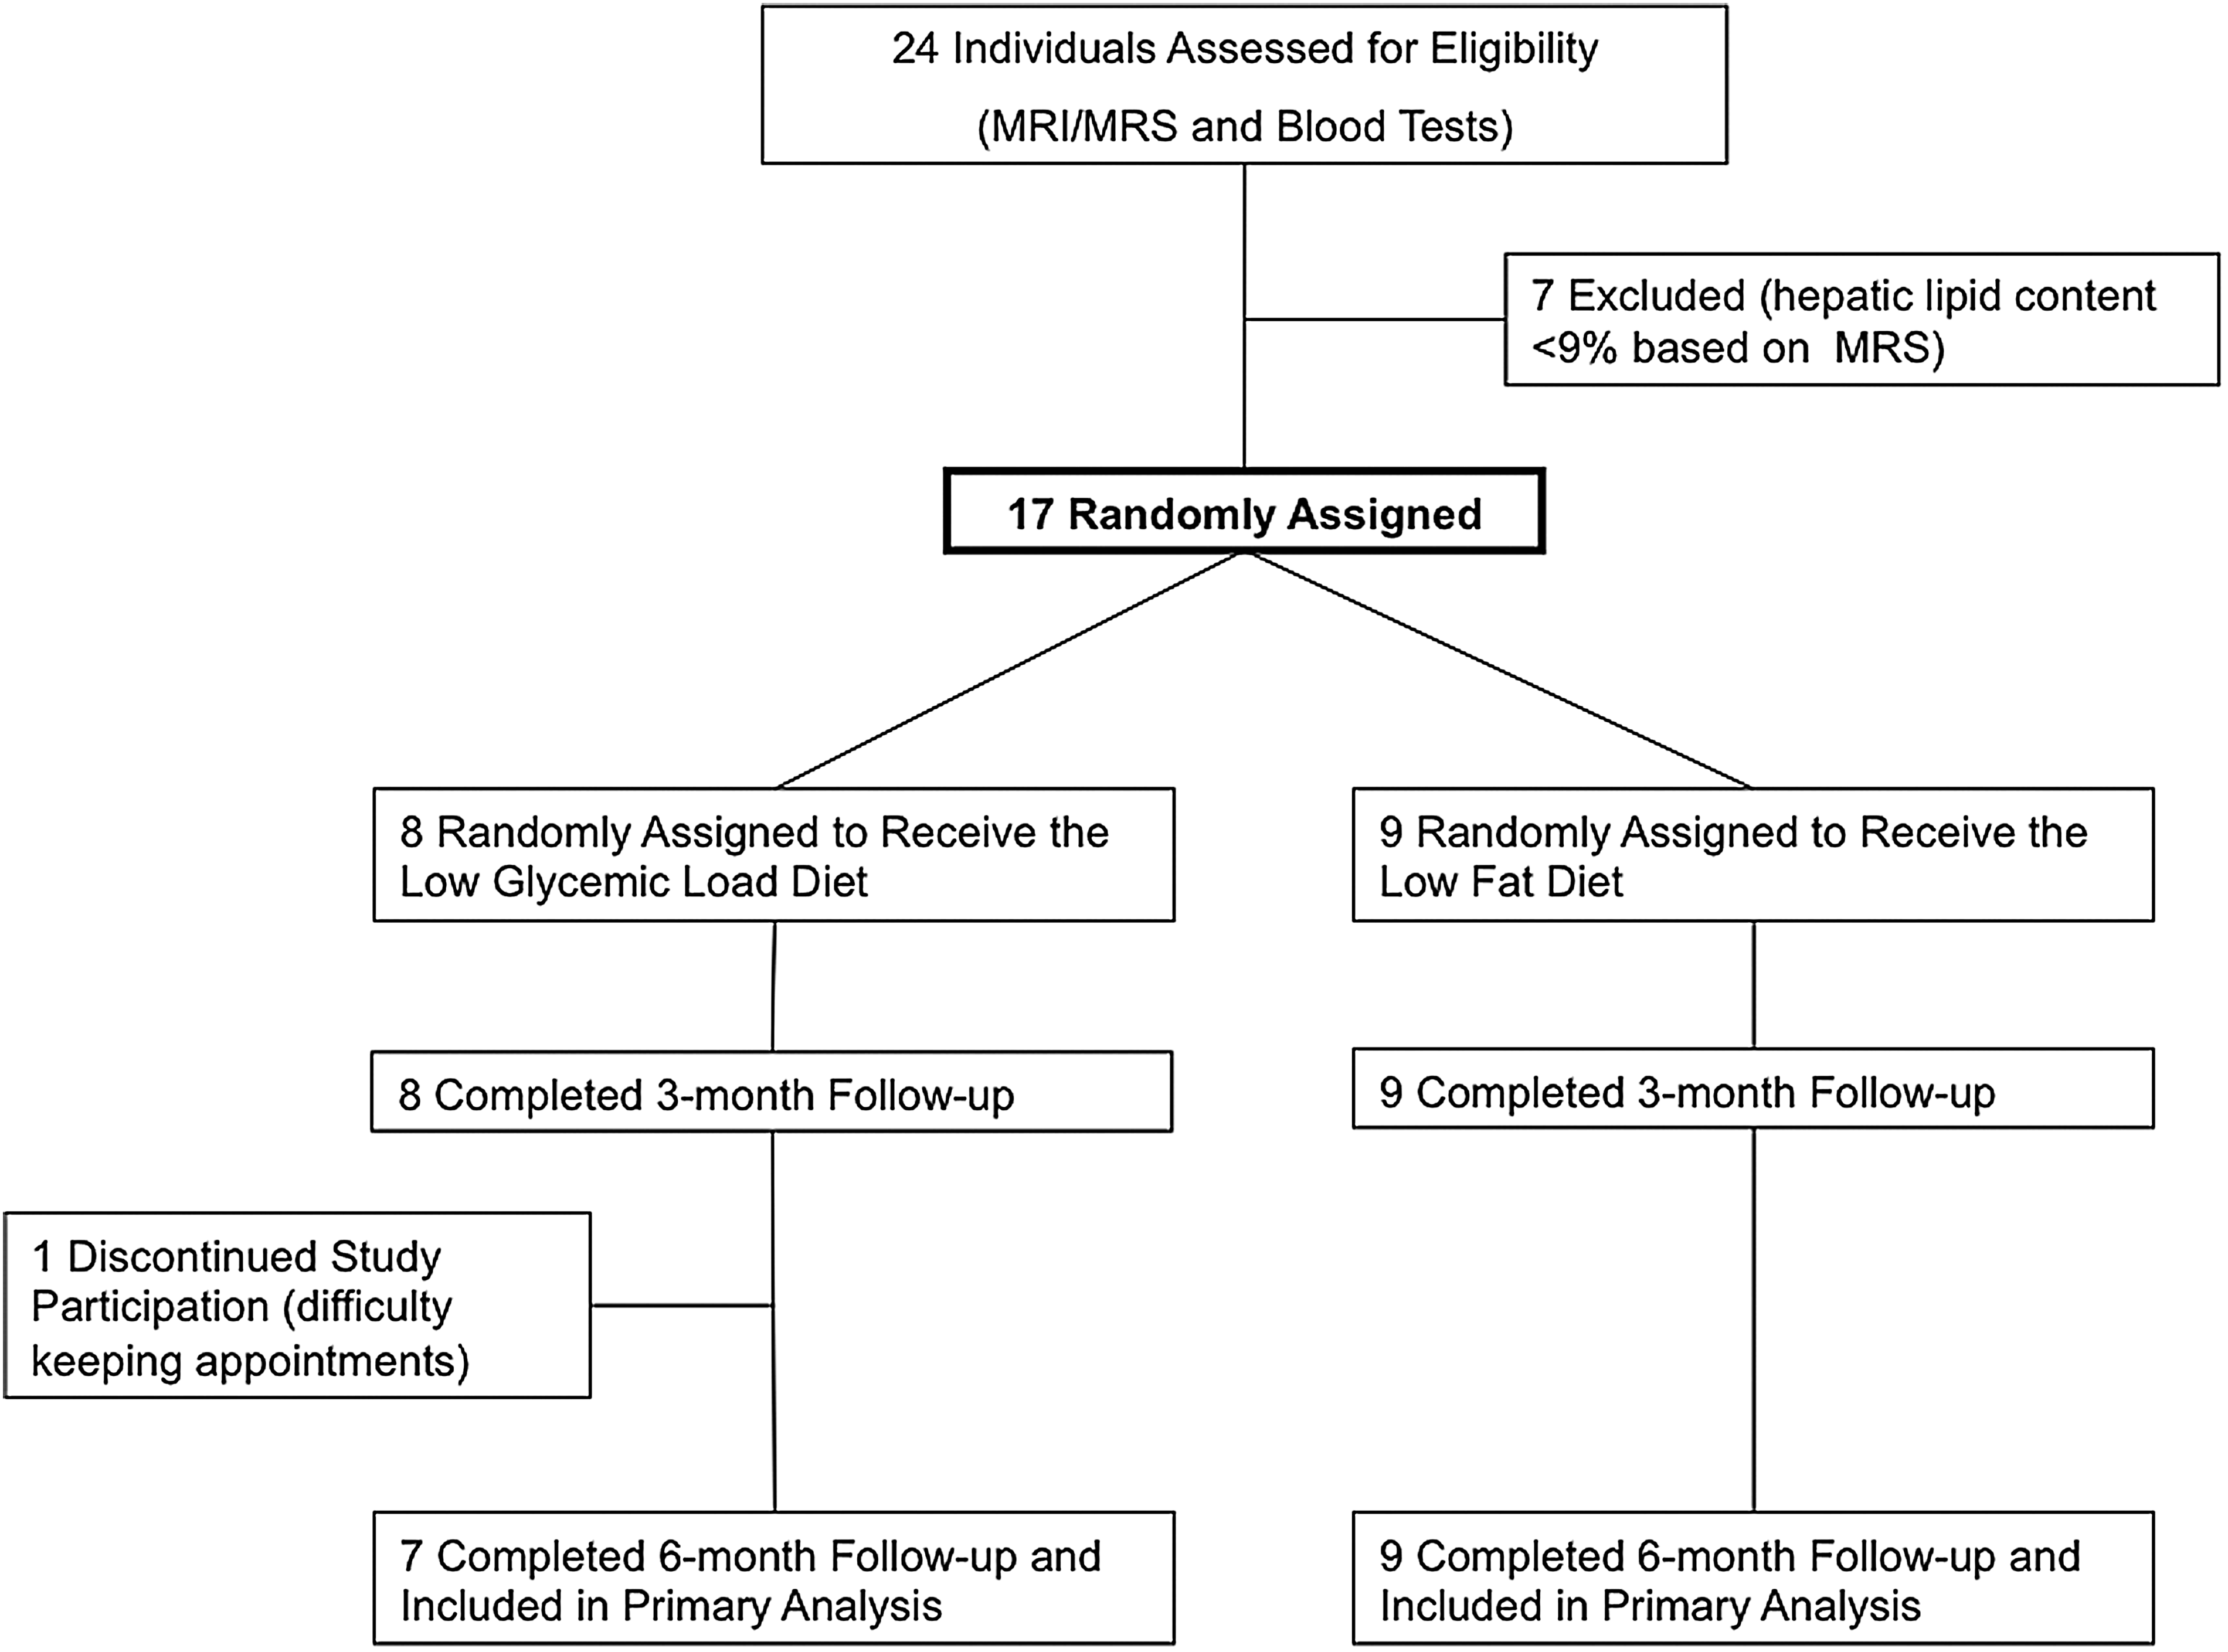
The flow of participants through the study is shown in Figure 1. Potential study participants were identified through primary and specialty care clinics at the hospital. Inclusion criteria were: Ages 8–17 years; elevated alanine aminotransferase (ALT) (above age-appropriate normal range); obesity defined as a BMI ≥95th percentile for age and sex; ability to tolerate the magnetic resonance imaging (MRI) procedure; willingness to attend study sessions; and having ≥9% liver fat as measured by MRS. Exclusion criteria were: Diagnosis of any major systemic disease (including diabetes); other hepatic disease (including viral or autoimmune hepatitis, Wilson's disease, α-1-antitrypsin deficiency); any alcohol consumption; use of any medication or vitamin supplement that could affect liver fat or body weight; weight >300 pounds; weight change >10% of total body weight within the last 6 months; or pregnancy. Of 24 potentially eligible individuals, 7 were excluded due to low liver fat content and 17 were enrolled. Written informed consent was obtained from the parents of all participants, and written assent was obtained from all subjects aged 12 years or older.
Intervention
Nutrition education and behavioral counseling were provided to both dietary groups using similar methods, although the content differed according to group assignment. Nutritional interventions and well-differentiated food choices were based on food pyramids, employed in a previous study, for both groups. 22 Written materials included topic modules, grocery shopping lists, and recipes. Topic modules, used to present the dietary message, were designed to promote dialogue between subject and parent, and the dietitian. Three-dimensional food models, plates, bowls, glasses, and measuring cups were used to educate the subjects regarding portions sizes. In addition, a demonstration on food preparation was conducted, in which participants prepared a breakfast consistent with diet group assignment.
Written materials for both groups were designed using similar formatting and appearance. To promote treatment fidelity, dietitians followed written scripts during treatment sessions and completed tracking forms and progress notes immediately after each session. Dietitians met regularly with the study investigators to review forms and notes and discuss treatment of individual participants. Participation rates were assessed on the basis of session attendance.
Adherence to the prescribed diet was monitored by two unannounced 24-hour dietary recalls conducted at each of two time points—baseline and between 5 and 6 months into the study. We used Nutrition Data System for Research software (NDSR Software; versions 2006–2008, developed by the Nutrition Coordinating Center, University of Minnesota, Minneapolis, MN) to quantify intake of carbohydrate, fat, protein, and fiber. The GI of individual foods was assigned according to published values, 23 whereas GL was the sum of available carbohydrate from any given food multiplied by the GI of the same food divided by 100, calculated using NDSR.
The diets were prescribed ad libitum, and the participants were educated to eat to satiety and snack when hungry. Both groups had a targeted proportion of energy from protein of 20–25%. The low-GL prescription emphasized the selection of carbohydrate-containing foods with a low to moderate glycemic load (nonstarchy vegetables, fruits, legumes, and dairy). The targeted proportion of energy from carbohydrate and fat were 40% and 35–40%, respectively. The low-fat diet was based on 2003 American Diabetes Association 24 and 2002 American Gastroenterological Association 25 recommendations to limit total fat to <30% of total calories and saturated fat to <10%. We aimed for 55–60% of energy from carbohydrates and 20% from fat with <10% from saturated fat. Participants in both groups were given a chewable vitamin supplement (One A Day® Bugs Bunny Multivitamin) to avoid confounding by minor differences that might arise in micronutrient content of the diets.
Assessment and Study Outcomes
All females had a urine pregnancy test prior to random assignment. At baseline, 3 months and 6 months height, weight, blood pressure (BP) and fasting blood sample including total cholesterol, high-density lipoprotein cholesterol (HDL-C), and low-density lipoprotein cholesterol (LDL-C), triglycerides, ALT, aspartate aminotransferase (AST), glucose, and insulin were obtained. At baseline and 6 months, we also obtained waist, abdomen, and hip circumferences, a 3-hour oral glucose tolerance test (OGTT), MRI of the abdomen for quantification of visceral fat, and MRS for quantification of liver fat.
Height was measured using a wall-mounted stadiometer to the nearest 0.1 cm and weight was measured using an electronic scale to the nearest 0.1 kg. BMI was calculated as the weight (kg) divided by the height (m) squared. To compare subjects independently of age and gender, BMI z-scores were calculated using CDC data. 26 Waist, abdomen, and hip circumferences were measured as described by Lohman et al. 27 Pubertal status was defined as Tanner ≥2 breast development in females and Tanner ≥3 testicular development in males. Blood pressure was determined three times from the right arm using an automated system (Dinamap, Criticon Inc, Tampa, FL). The average of the last two readings were used in statistical analyses. Glucose, insulin, ALT, AST, cholesterol, LDL-C, HDL-C, and triglycerides were analyzed at Boston Children's Hospital laboratory.
The OGTT was performed at 8:30 a.m. after a 12-hour fast. A catheter was inserted into an antecubital vein for blood sampling. A fasting sample was obtained for the determination of plasma glucose and three different fasting samples separated by 5 minutes were obtained for determination of plasma insulin. After the oral glucose load (75 grams), samples were obtained at 30-min intervals for 180 min. Fasting insulin and the homeostasis model assessment of insulin resistance (HOMA-IR) 28 were used as markers for systemic insulin resistance. HOMA-IR was calculated as: fasting plasma insulin (U/L)×fasting plasma glucose (mmol/L)/22.5.
Fat content in the liver was measured by MRS (single voxel STEAM spectrum, TR/TE=1500/30 ms/ms with 128 averages) using 3 T MRI. Hepatic fat fractions were estimated from the relative signal intensities of the water and methylene/methyl resonances. Confirmatory qualitative assessment of fat deposition in the liver using a multiecho Dixon fat and water separation technique was concordant with the spectroscopy data. 29
Intraperitoneal fat volume was calculated from regions of interest that were manually segmented across sequential non-fat-suppressed FSE/T2 axial images, using the sum total areas of the segmented region of interest multiplied by slice thickness. Intraperitoneal fat volumes were calculated from both the baseline and 6-month scans focusing on the anatomic region and imaging field of view that encompassed the liver and upper abdominal viscera.
Statistical Analysis
The pilot study was calculated to have an 80% power, using 5% Type I error rate, to detect a difference of 7.3% in liver fat content between the two treatment groups. All analyses followed the intention-to-treat principle. Baseline data were compared between the low-GL and low-fat groups by Fisher exact test and t-test for categorical and continuous variables, respectively. Changes in dietary, anthropometric, and metabolic variables were compared between groups using a general linear model, with adjustment for sex and age. Net intervention effect (mean change in low-GL group − mean change in low-fat group) was constructed from parameters of the fitted model. Pearson correlations were calculated to assess the relationship between hepatic lipid and other outcomes at baseline and between changes in hepatic lipid and other variables over 6 months, using data collapsed across groups. Missing data for 1 subject who discontinued participation after the 3-month follow-up assessment were not imputed. SAS software (version 9.2, Cary, NC) was used for all computations. Data are presented as mean and standard deviation (SD) (for baseline, 3 months, and 6 months) or standard error (SE) (for change). A two-sided p<0.05 was taken as a statistically significant result.
Results
The 8 individuals assigned to the low-GL group had the following characteristics: 7 males and 1 female, 5 non-Hispanic whites, and 3 with other race/ethnicity, 4 with prepubertal and 4 with pubertal status, and average age of 11.8±3.0 years. Characteristics of the 9 individuals assigned to the low-fat group were not significantly different: 7 males and 2 female, 8 non-Hispanic whites and 1 with other race/ethnicity, 3 with prepubertal and 6 with pubertal status, and average age of 13.8±3.2 years. Participant retention rate at 6 months was 94%, with 1 dropout related to difficulty attending study visits (in the low-GL group). (Baseline dietary, anthropometric and metabolic data are presented in the tables, by group.)
Changes in dietary variables are shown in Table 1. GL decreased in the low-GL group and did not change significantly in the low-fat group. In contrast, dietary fat decreased for the low-fat group and did not change for the low-GL group. Both GI (p=0.02) and GL (p=0.01) differed between the groups at 6 months.
Dietary Data*
Levels (mean±SD) by study group at baseline and 6 months. Change (mean±SE) at 6 months from general linear model adjusted for sex and age. p for each study group tests the hypothesis of zero mean change from baseline. p for low GL – low fat tests the hypothesis that mean change was equal in the two groups.
There were no differences between groups at baseline (p≥0.05, n=17).
At 6 months, data were available for 16 subjects (n=7 low GL, n=9 low fat).
SD, standard deviation; SE, standard error; GL, glycemic load.
Table 2 presents anthropometric data by treatment groups. BMI decreased by −1.3 (0.3) kg/m2 in the low-GL group (p=0.0007) and by −1.2 (0.3) kg/m2 in the low-fat group (p=0.0004), but these changes did not differ significantly between groups (p=0.90). As shown in Table 3, hepatic lipid content (the primary outcome) decreased in absolute terms by −8.8 (4.1)% in the low-GL group (p=0.05) and −10.5 (3.7)% in the low-fat group (p=0.01). These changes translate into relative decreases in hepatic lipid content of 37% and 36%, respectively, with no significant difference between groups (p=0.76). ALT also changed in a similar fashion: Low-GL group −28.5 (9.3) IU/L, p=0.005 vs. low-fat group −18.0 (8.4) IU/L, p=0.04, with no significant difference between groups (p=0.41). Likewise, there was no significant group − time interaction for any of the other outcomes.
Anthropometric Data *
Levels (mean±SD) by study group at baseline, 3 months, and 6 months. Change (mean±SE) at 3 months and 6 months from general linear model adjusted for sex and age. p for each study group tests the hypothesis of zero mean change from baseline. p for low GL – low fat tests the hypothesis that mean change was equal in the two groups. Repeated measures analysis including all time points showed no significant group×time interaction (p>0.1) for any outcome.
There were no differences between groups at baseline (p≥0.05, n=17).
At 3 months, data were available for 17 subjects (n=8 low GL, n=9 low fat).
At 6 months, data were available for 16 subjects (n=7 low GL, n=9 low fat).
SD, standard deviation; SE, standard error; GL, glycemic load.
Metabolic Data *
Levels (mean±SD) by study group at baseline, 3 months, and 6 months. Change (mean±SE) at 3 months and 6 months from general linear model adjusted for sex and age. p for each study group tests the hypothesis of zero mean change from baseline. p for low GL – low fat tests the hypothesis that mean change was equal in the two groups. Repeated measures analysis including all time points showed no significant group×time interaction (p>0.1) for any outcome.
There were no differences between groups at baseline (p≥0.05, n=17).
At 3 months, data were available for 17 subjects (n=8 low GL, n=9 low fat).
At 6 months, data were available for 16 subjects (n=7 low GL, n=9 low fat).
At 6 months, insulin and HOMA-IR data were missing for 1 subject in the low-GL group.
Log-transformed for analysis; adjusted data retransformed to natural units.
SD, standard deviation; SE, standard error; ALT, alanine aminotransferase; AST, aspartate aminotransferase; GL, glycemic load; HOMA-IR, homeostatic model assessment of insulin resistance; LDL-C, low-density lipoprotein cholesterol; HDL-C, high-density lipoprotein cholesterol.
Table 4 provides results of associations between several covariates and hepatic lipid content at baseline, and between change in the covariates and change in hepatic lipid content over 6 months, using data collapsed across groups. Of these, ALT was the strongest predictor, accounting for 32% of the variance in both the baseline and change analyses.
Correlation of Hepatic Lipid (%) with Other Covariates
n=17.
n=16.
Insulin and HOMA-IR data were missing for 1 subject.
ALT, alanine aminotransferase; HOMA-IR, homeostatic model assessment of insulin resistance.
Discussion
With progression of the pediatric obesity epidemic, fatty liver has emerged as a critical public health problem. Left untreated, fatty liver can progress to steatohepatitis, cirrhosis, and end-stage liver disease, and predispose to metabolic problems and type 2 diabetes. In the absence of pharmacological options in this age group, effective lifestyle treatments are greatly needed for this major obesity-related complication. The results of this pilot study demonstrate that a conventional low-fat or low-GL diet can produce substantial decreases in liver fat (more than one-third, in relative terms) and hepatocellular injury (as suggested by the decline in ALT) within 6 months in obese children. Of particular interest, the change in liver fat in our study occurred without major weight loss described in other studies of adults and children,8,9 suggesting the possibility of clinical benefit with moderate intensity and pragmatic interventions. Although the low-fat group showed a significant decrease in insulin resistance, the between group difference was not significant.
We used MRS, an advanced imaging technique to obtain precise quantification of hepatic lipid content. Although this method may not be cost effective in a primary care setting, MRI with MRS can be performed on most clinical scanners in less than 30 minutes. Judicious use of a focused imaging protocol, in junction with other clinical and laboratory monitoring, could be an effective and quantitative means of identifying at-risk patients and in guiding therapy. Consistent with other studies30,31 participants in our study had elevated aminotransferases, especially ALT, at baseline. Our correlation analyses suggest that change in ALT, perhaps more so than measures of body weight or insulin resistance, may provide clinically practical information regarding response to dietary treatment of fatty liver.
We hypothesized that liver fat would decrease more on a low-GL diet, in part because this diet lowers postprandial glycemia and hyperinsulinemia more than a low-fat diet. As has been previously reported, foods producing a lower glycemic response cause less hepatic glucose absorption. 32 The lack of difference between groups in our study may relate to the limited statistical power or short duration of the study, or indicate that both diets have comparable efficacy in the treatment of fatty liver. Alternatively, some individuals may respond more favorably to one diet than the other, based on inherent differences in insulin secretion or other biological factors, 22 a possibility that cannot be assessed here due to lack of power.
Strengths of our study include a focus on a little-studied but important complication of childhood obesity, the randomized-controlled design, use of a state-of-the-art measure of liver fat (our primary outcome), control for treatment intensity and other potentially confounding factors (e.g., behavioral methods and physical activity prescription), assessment of dietary process measures, and an attempt to correlate changes in response to treatment with practical clinical measures (e.g., ALT). The primary study limitations are its small size and relatively short duration of intervention, precluding definitive conclusions relating to inherent efficacy of the diets.
Conclusion
This study suggests that moderate weight loss on either a low-GL or low-fat diet may produce clinically meaningful improvement in liver fat within 6 months. ALT may comprise a useful marker of treatment response. Larger-scale, long-term studies are needed to compare the efficacy of low-GL and low-fat diets in the fatty liver and other obesity-related complications in childhood.
Footnotes
Acknowledgments
This study was supported by grants from the Allen Foundation, the New Balance Foundation, and the National Institute of Diabetes and Digestive and Kidney Diseases (K24DK082730 and T32DK07699). Additional support was provided from the National Center for Research Resources (UL1 RR025758) to the Harvard Catalyst Clinical and Translational Science Center at Harvard University.
Author Disclosure Statement
The authors declare that there is no duality of interest associated with this manuscript. The funding organizations had no role in the design and conduct of the study, in the collection, analysis, and interpretation of the data, or in the preparation, review, or approval of the manuscript. The content is solely the responsibility of the authors and does not necessarily represent the official views of National Institute of Diabetes and Digestive and Kidney Diseases, National Institute of Mental Health, National Center for Research Resources, National Institutes of Health, or Harvard Catalyst.