
Abstract
Abstract
Background:
The Institute of Medicine noted that current food and beverage marketing practices promote unhealthful diets. However, little public health research has been conducted on food marketing directed toward adolescents, especially using caregiver- and adolescent-reported data.
Methods:
We assessed perceived frequency of food/beverage advertising exposure and common locations of food/beverage marketing exposure for adolescents using 2012 Summer ConsumerStyles and YouthStyles survey data on US adults ≥18 years of age and their children ages 12–17 (n=847), respectively. Exposure to advertisements for fast food, soda, fruit drinks, sports drinks, energy drinks, and bottled water were categorized as <1 time/week, 1–6 times/week, and ≥1 time/day, and don't know. Weighted chi-square tests were used to examine the difference between caregivers' and adolescents' responses.
Results:
The majority of caregivers and adolescents reported that adolescents viewed advertisements ≥1 time/day across all food/beverage categories with the highest, at least daily, exposure reported for fast food. Caregivers more frequently reported that adolescents viewed all food/beverage advertisements ≥1 time/day than the adolescents reported (chi-square tests, p<0.0001). Both caregivers and adolescents reported that the adolescents view food/beverage marketing most frequently on television followed by at the supermarket.
Conclusions:
Our study showed that adolescents reported lower frequency of food and beverage advertising exposure than their caregivers. Further research may be needed to verify self-reported exposure data on food and beverage advertising as a way to obtain data for use in research on its relationship with diet quality and obesity.
Introduction
Food and beverage marketing influences the food environment and ultimately can play a role in the diets and health of children. 1 The Institute of Medicine (IOM) report on food marketing to children and youth showed that current marketing practices were out of balance with promotion of healthful diets. 1 Approximately 9 of 10 food product advertisements viewed by adolescents 12–17 years of age are high in fat, added sugars, or sodium. 2 Although there is insufficient evidence as to the effect of exposure to food/beverage advertising on 12 to 17 year olds, the adolescent population has spending power and more direct purchasing ability than younger children.3–5 Additionally, marketers can use a variety of marketing techniques, including cheaper alternatives, such as digital marketing, to reach this audience.4,5
Determining adolescents' overall level of food/beverage marketing exposure is challenging because there is no simple method to assess marketing exposure that occurs outside of measured media, such as in-store displays, social media, or mobile applications (apps). Further, even supposing there was a method to determine all food/beverage marketing exposures through all mediums, it is unclear if and how adolescents consciously process these marketing exposures. To date, food marketing exposure research has focused primarily on television advertising using ratings data obtained from Nielsen.2,5–8 In addition to exposure on television, a few studies have assessed incidence of youth-targeted marketing through content analyses of product packaging in grocery stores/supermarkets9,10 and food company websites.11,12 One way to assess overall food marketing exposure is to survey adolescents and their parents/caregivers (henceforth referred to as caregivers), assuming that caregivers are aware of adolescents' exposures. 13 To the authors' knowledge, no studies in the United States have assessed perceptions of overall food/beverage marketing exposure and locations of marketing exposure using adolescent- and caregiver-reported data. Using caregiver-reported data could also be potentially useful to assess adolescents' overall exposure to food/beverage marketing, given that previous studies have revealed that repeated exposure to advertisements, new youth-targeted marketing techniques (e.g., social media marketing) that could undermine the viewer's skepticism, and the adolescents' tendency toward weaker impulse control could make adolescents less cognizant of food marketing.5,14 Further, a comparison of the responses between both these groups can help determine whether both populations report similar information about adolescents' exposure to marketing. Therefore, to address these gaps, the purposes of this study were 2-fold: (1) to use both adolescent- and caregiver-reported data to describe the perceived frequency of advertising exposure and the most common locations of food/beverage marketing exposure among adolescents and 2) compare the level of agreement between adolescent- and caregiver-reported estimates of the frequency with which adolescents are exposed to advertising to determine whether both groups report similar information. The term “advertising” that is used throughout the article refers to advertising for food and beverage products and fast food restaurants.
Methods
Survey Participants and Survey Administration
This descriptive study used Porter Novelli's 2012 Summer ConsumerStyles and YouthStyles surveys, which are online surveys of US adults and their children between the ages of 12 and 17 designed to assess health beliefs and behaviors surrounding important public health concerns. 15 Survey respondents are drawn from an online, nationwide, continuously replenished research panel of 50,000 members that are randomly recruited using probability-based sampling regardless of whether or not they have landline phones or internet access.
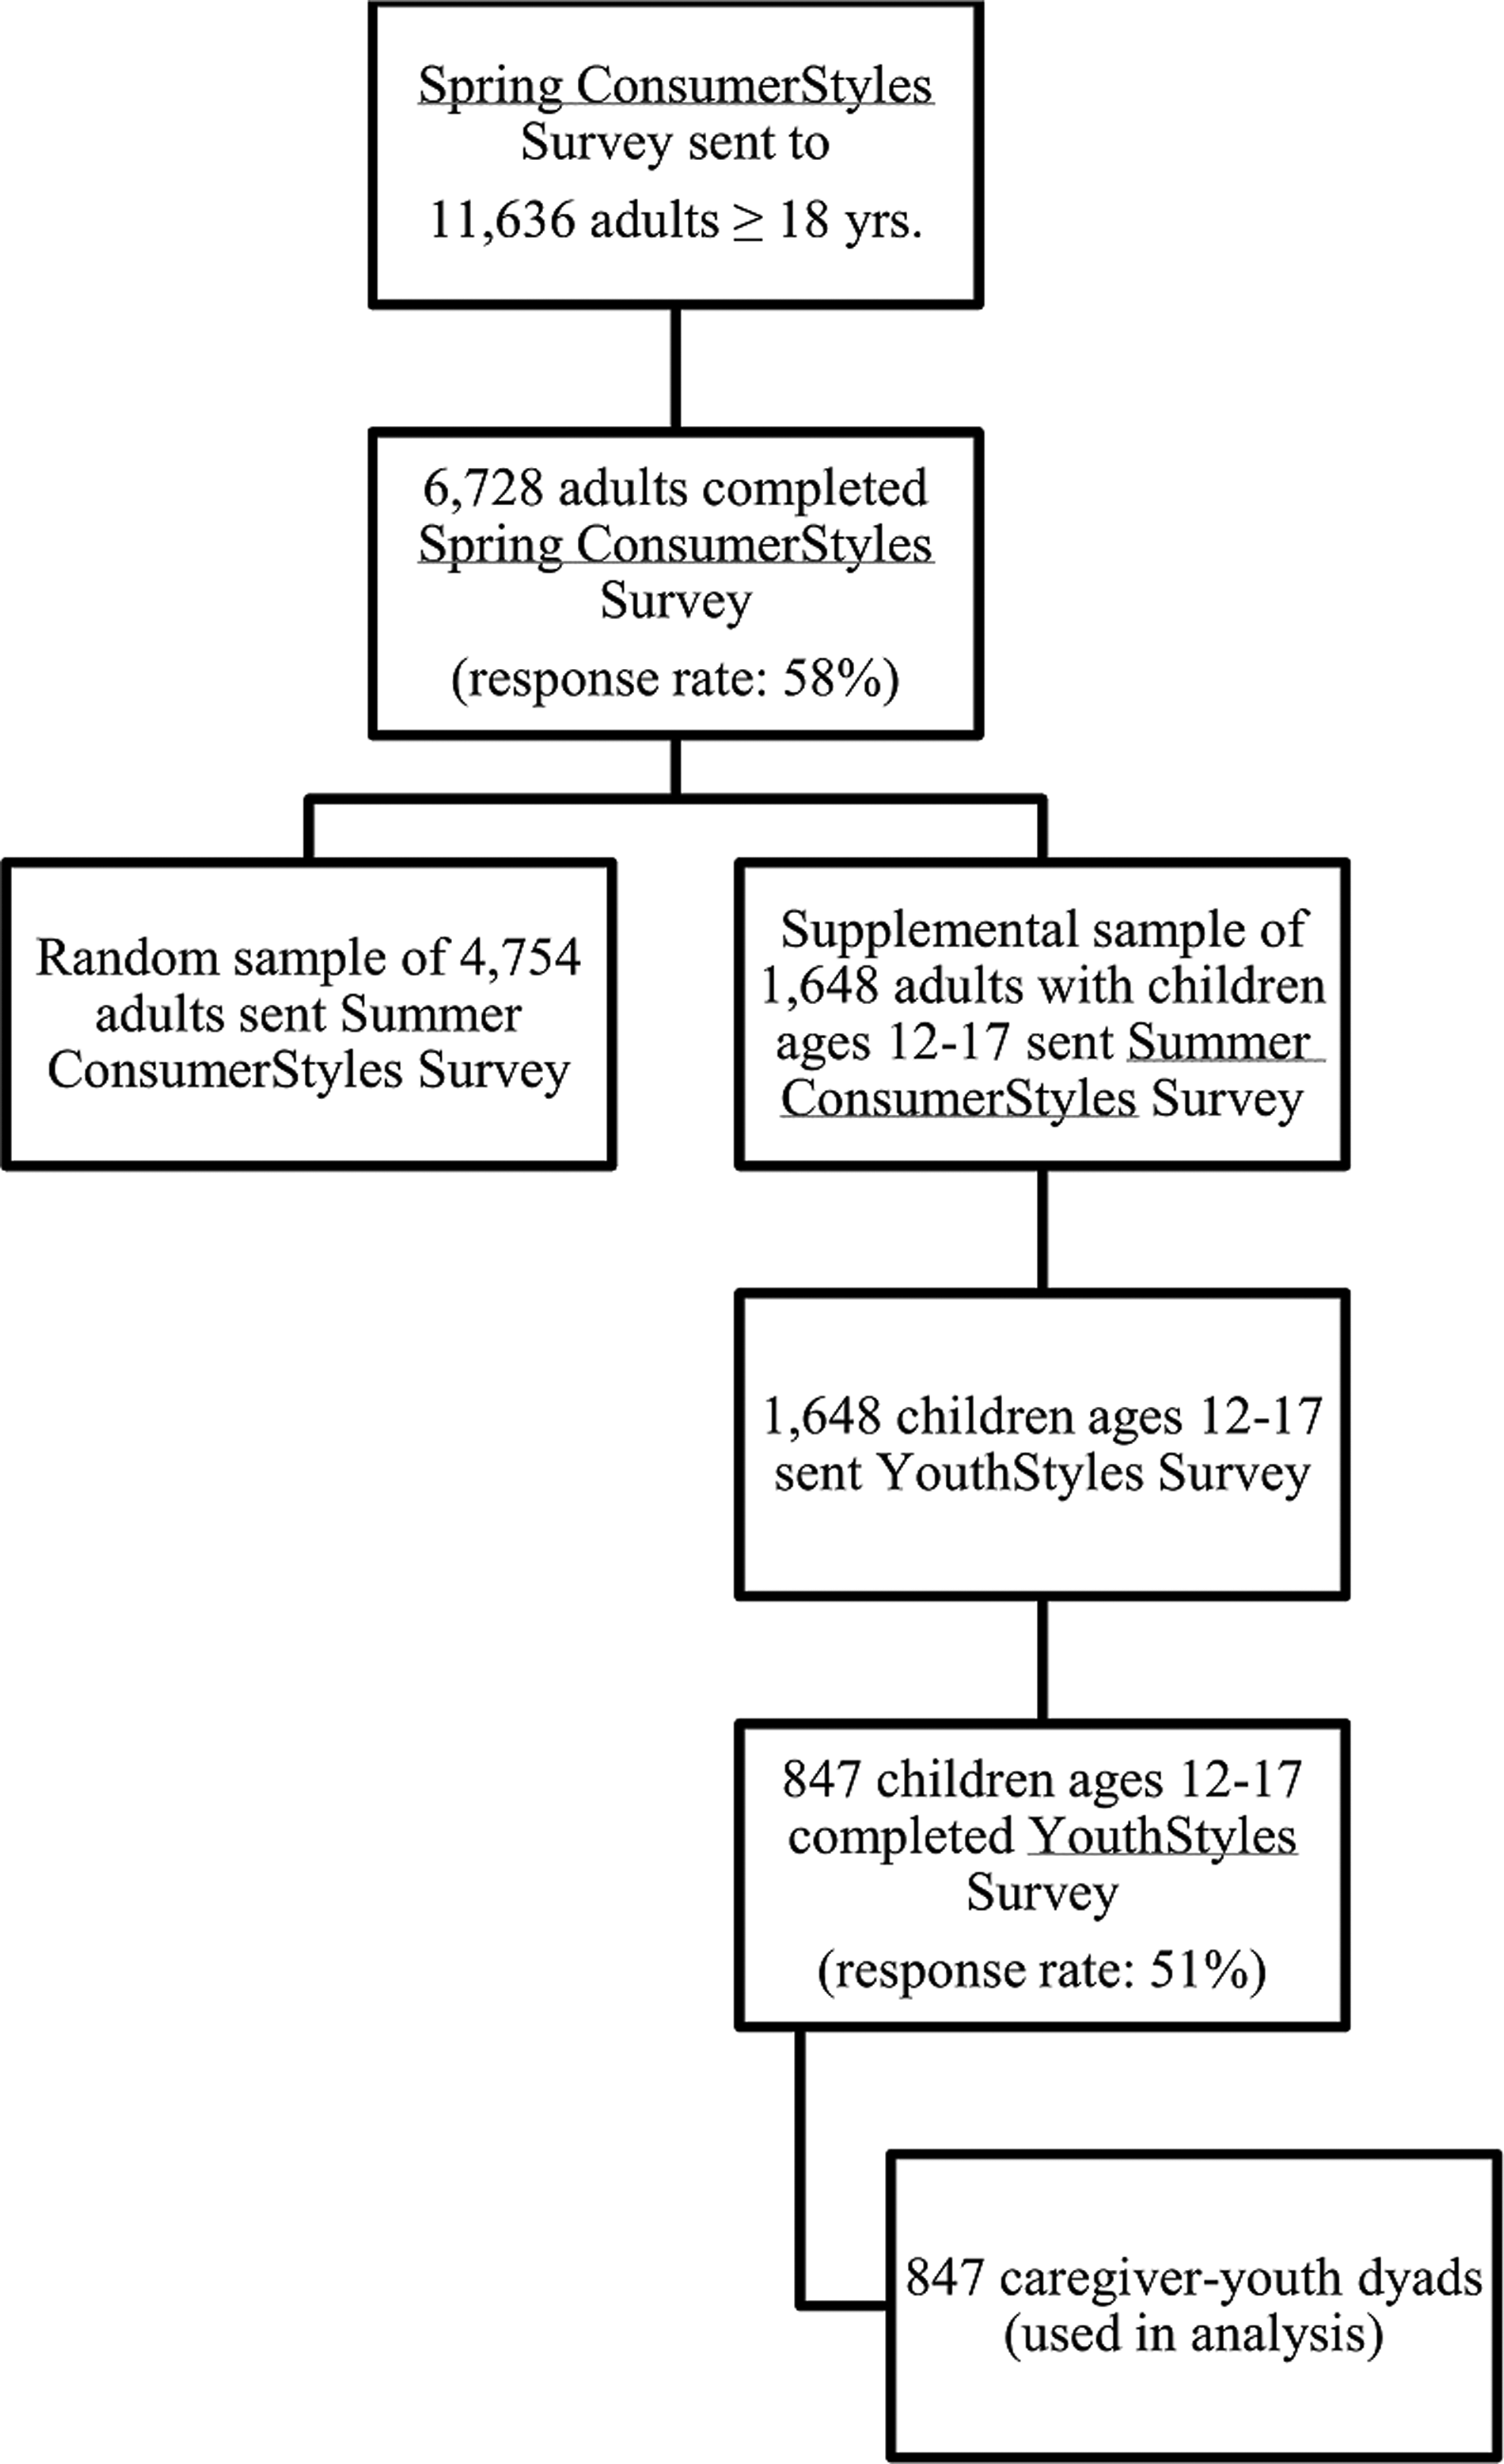
The survey samples for the Summer ConsumerStyles and YouthStyles Surveys were obtained as detailed in Figure 1. First, the Spring ConsumerStyles survey was sent to a random sample of 8961 adult panelists 18 years of age and older and a supplemental sample of 2675 panelists with children ages 12–17 (n=11,636). A total of 6728 participants completed the spring survey (response rate, 58%). From the adult participants who completed the spring survey, a random sample of 4754 panelists and a supplemental sample of 1648 adult panelists with children ages 12–17 were sent the Summer ConsumerStyles survey. A total of 4170 adults completed the survey for a response rate of 65%. YouthStyles surveys were sent to 1648 youth living with adult panelists. Responses were received from 847 youth, a response rate of 51%. The combined adult-youth dyad data set was used for this analysis; thus, it included data from the adolescents who completed YouthStyles and their caregivers who completed Summer ConsumerStyles. Both Summer ConsumerStyles and YouthStyles survey participants are assigned sample weights to match the sample to the US Current Population Survey. 16 The analysis was exempt from the CDC Institutional Review Board process because personal identifiers were not included in the data provided to the CDC.
The combined data set included 847 caregiver-adolescent dyads. When assessing perceived frequency of advertising exposure, caregiver and adolescent paired respondents were excluded if either answered “refused” (n=81) to any of the food/beverage advertising categories, leaving an analytic sample of 766 caregiver-adolescent pairs for the perceived frequency of advertising exposure analysis. When measuring level of agreement between caregivers and adolescents, both “refused” and “don't know” responses were excluded for each of the food/beverage advertising categories, leaving final analytic samples of 696 for fast food advertising, 678 for soda, 629 for fruit drinks, 655 for sports drinks, 613 for energy drinks, and 604 for bottled water. When assessing most common locations of perceived exposure, caregiver and adolescent paired respondents were excluded if either answered “refused” (n=30), leaving an analytic sample of 817 caregiver-adolescent pairs for the location of exposure analysis. Overall, there was no statistically significant difference in sociodemographic characteristics, except education, between those included and those excluded from the study. Caregivers excluded from the study had lower education levels than caregivers included in the study.
Perceived Frequency of Food/Beverage Product Advertising Exposure
The main outcome of interest was perceived frequency of advertising exposure for six food/beverage categories. The question for the caregivers was phrased as: “During a typical week, how often do you think your children see or hear advertisements for each of the following?” The question for the adolescents was phrased as: “During a typical week, how often do you see or hear advertisements for each of the following?” The six food/beverage categories that were assessed by both caregivers and adolescents included (1) fast food (i.e., McDonald's, Burger King, and Taco Bell), (2) soda (i.e., Coke, Sprite, and Mountain Dew), (3) fruit drinks (i.e., Capri Sun, Sunny Delight, and Hawaiian Punch), (4) sports drinks (i.e., Gatorade or Powerade), (5) energy drinks (i.e., Red Bull®, 5-hour Energy®, and NOS®), and (6) bottled water (i.e., Aquafina, Dasani, and Fiji). Response options for each food/beverage type were <1 time/week, 1–6 times/week, 1 time/day, multiple times daily, and don't know. Four mutually exclusive categories were created: <1 time/week, 1–6 times/week, and ≥1 time/day, and don't know.
Perceived Most Common Places Where Adolescents See/Hear Food Marketing
The two most common places where adolescents reported they saw/heard food marketing and caregivers reported where their adolescents saw/heard food marketing were examined. The question for the caregivers was phrased as: “Thinking about the way in which food and beverages are marketed to children, please select the top two places where your children see or hear marketing for food and beverages in a typical week.” The question for the adolescents was phrased as: “What are the top two places where you see or hear marketing for food and beverages in a typical week?” The response options for both caregivers and adolescents were school (including cafeteria, hallways, vending machines, scoreboards, and buses), grocery store/supermarket, convenience store/gas station, television, internet or cell phone (websites, online games, apps, or social networking sites such as Facebook or Twitter), and none of these.
Sociodemographic Variables
Sociodemographic variables included age (12–13, 14–15, and 16–17 years), sex, race/ethnicity (non-Hispanic white, non-Hispanic black, Hispanic, and other/multi-racial), caregiver education level (≤high school, some college, and college graduate), annual family income (<$35,000, $35,000–$74,999, $75,000–99,999, and ≥$100,000), and geographic census region (Northeast, Midwest, South, and West).
Statistical Analysis
Weighted chi-square tests were used to examine the difference between caregiver and adolescent responses for (1) frequency of perceived adolescents' exposure to food/beverage marketing for each of the food/beverage categories and for (2) the perceived top two places where adolescents were exposed to marketing. A p value of<0.05 was used as the cut-off point for statistical significance. Weighted Cohen's kappa coefficients were determined for each of the food/beverage advertisement categories to measure extent of agreement between caregivers and adolescents. Kappa coefficients typically range from 0 to 1, with values ≥0.7 indicating good level of agreement. 17 A supplemental analysis to assess sociodemographic characteristics associated with adolescents who report different food/beverage advertising exposure, in comparison to their caregivers, was conducted using multivariate logistic regression modeling with all sociodemographic characteristics included in one model and the reference group being adolescents who agreed with their caregivers. All statistical analyses were performed with Statistical Analysis Software (SAS; version 9.3; SAS Institute Inc., Cary, NC) and incorporated appropriate procedures to account for the sample design.
Results
Sociodemographic characteristics of the adolescent respondents are shown in Table 1. Age and sex of survey participants were evenly distributed. Approximately 56% of adolescents were non-Hispanic white, 24% had a parent who had ≤high school education, and 60% were in a household with an annual family income of <$75,000.
Sociodemographics Characteristics of Adolescent Respondents (n=847)—Summer ConsumerStyles and YouthStyles Surveys 2012 a
Weighted percentage may not add up to 100% because of rounding.
SE, standard error.
For all advertised products examined, the most common category of exposure from adolescent self-reports and from caregiver reports about their adolescents was ≥1 time/day (Table 2). Both caregiver and adolescent reports of adolescent food/beverage advertising exposure were highest for fast food (64.2% and 50.1% reporting ≥1 time/day, respectively; Table 2). For all food/beverage items, a greater proportion of caregivers reported that adolescents saw or heard all food/beverage advertisements ≥1 time/day than adolescents self-reported (p<0.0001). Differences between perceived exposure to food/beverage advertising reported by caregivers for their adolescents and self-reports by adolescents were significant for all food/beverage advertisement categories (chi-square tests, p<0.0001).
Frequency of Food Marketing Exposures to Adolescents as Reported by Caregiver and Self-Reported by Adolescent Respondents (n=766)—Summer ConsumerStyles and YouthStyles Surveys, 2012 a
Weighted percentage may not add up to 100% because of rounding.
Caregivers: “During a typical week, how often do you think your children see or hear advertisements for each of the following?” Adolescents: “During a typical week, how often do you see or hear advertisements for each of the following?”
Chi-square tests were used to examine differences across categories for each variable.
Fast food (i.e., McDonald's, Burger King, and Taco Bell); soda (i.e., Coke, Sprite, and Mountain Dew); fruit drinks (i.e., Capri Sun, Sunny Delight, and Hawaiian Punch); sports drinks (i.e., Gatorade or Powerade); energy drinks (i.e., Red Bull, 5-hour Energy, and NOS); bottled water (i.e., Aquafina, Dasani, and Fiji).
SE, standard error.
The proportions of the top places that caregivers and adolescents reported that adolescents saw or heard food/beverage advertisements are shown in Table 3. Both caregivers and adolescents reported they saw or heard food/beverage advertisements most frequently on television (82.7% and 80.9%, respectively), followed by grocery store/supermarket (39.5% vs. 32.4%), internet/cell phone (26.4% vs. 24.5%), convenience store/gas station (21.3% vs. 14.8%), and school (9.4% vs. 7.5%). Differences between caregiver and adolescents' responses were significant for all categories, except for television and internet/cell phone (chi-square tests, p<0.05).
Proportions of the Top Places That Parents and Adolescents Reported That Adolescents Viewed Food Advertisements (n=817)—Summer ConsumerStyles/YouthStyles, 2012 a
Weighted percentage may not add up to 100% because of rounding.
Caregivers: “Thinking about the way in which food and beverages are marketed to children, please select the top two places where your children see or hear marketing for food and beverages in a typical week?” Adolescents: “What are the top two places where you see or hear marketing for food and beverages in a typical week?”
Chi-square tests were used to examine differences across categories for each variable.
School (including cafeteria, hallways, vending machines, scoreboards, and buses); grocery store/supermarket; convenience stores/gas station; television; internet or cell phone (i.e., websites, online games, apps, or social networking sites, such as Facebook or Twitter); and none of these.
SE, standard error.
The proportions of adolescents who reported frequencies regarding their exposures to a particular food advertisement that were less, the same, or more than those reported by their caregivers are shown in Table 4. Agreement of adolescent- and caregiver-reported frequency with which adolescents are exposed to advertising across all food/beverage advertisement categories ranged from 53.6% to 62.2%. Kappa coefficients for all food/beverage advertising categories ranged from 0.27 to 0.33. Compared to what their caregivers reported, adolescents were more likely to report lower (range, 23.9–29.9%) than higher (range, 13.0–19.7%) advertising exposure across all food/beverage categories. Non-Hispanic black youth were significantly less likely to be inconsistent with their caregivers' report on fruit drinks advertising exposure than non-Hispanic white youth, and Hispanic youth were significantly more likely to be inconsistent with their caregivers' report on bottled water advertising exposure than non-Hispanic white youth (data not shown). Further, adolescents who were from families with incomes <$35,000 and $35,000–$74,999 were significantly less likely to be inconsistent with their parents on bottled water advertising exposures, compared to youth from families with incomes ≥$100,000 (data not shown).
Proportions of Adolescents Who Estimated Less Than, Agreed With, and Estimated More Than Their Caregivers on How Frequently They Were Exposed to a Particular Food Advertisement—Summer ConsumerStyles/YouthStyles, 2012 a
Weighted percentage may not add up to 100% because of rounding.
Fast food (i.e., McDonald's, Burger King, and Taco Bell); soda (i.e., Coke, Sprite, and Mountain Dew); fruit drinks (i.e., Capri Sun, Sunny Delight, and Hawaiian Punch); sports drinks (i.e., Gatorade or Powerade); energy drinks (i.e., Red Bull, 5-hour Energy, and NOS); bottled water (i.e., Aquafina, Dasani, and Fiji).
Weighted Cohen's kappa (κ) coefficients determined to measure extent of agreement between caregivers and children, and “don't know” responses for both caregivers and children were excluded.
CI, confidence interval; SE, standard error.
Discussion
The majority of both caregivers and adolescents reported that the adolescents saw or heard food and beverage advertisements at least once per day across all food and beverage advertisement categories. In an era where youths' interaction with multiple media—including television, internet, and cell phone use—is steadily increasing, 4 it is not surprising, yet concerning, that the majority of youth reported seeing or hearing food and beverage advertisements at least once daily. Youth between the ages of 8 and 18 spend 7.5 hours watching media content daily, 18 and in 2011, 12 to 17 year olds viewed approximately 16.2 food and beverage ads/day by television alone (a 23% increase since 2007). 6 According to the Federal Trade Commission (FTC), in 2009, $1.79 billion was spent on marketing of food products to youth, where 72% of these youth-directed expenditures were spent on marketing for less-healthy food establishments, such as quick-service restaurants, and foods such as carbonated beverages and sugary breakfast cereals. 19
The findings in this study showed that a higher percentage of caregivers and adolescents perceived that adolescents had more frequent exposure to fast food advertisements, compared to other food/beverage advertising categories. This is consistent with the recent Yale Rudd Center report, which revealed that fast food restaurants maintained the highest category share of food and beverage television advertising exposure for adolescents and that adolescents in the United States viewed 4.4 fast food advertisements per day, on average. 6 Although almost 50% of the caregivers and adolescents reported that the adolescents had exposure to soda advertisements ≥1 time/day in the present study, the Rudd Center reported that adolescents' exposure to television advertising of regular and diet sodas averaged 2.5 ads per week. This difference may be the result of assessment of different sources of advertising. However, the present study included perceived exposures to all forms of marketing, not just television advertising, and this finding is consistent with an FTC report on food company expenditures on marketing in all mediums (e.g., social media, in-school marketing, and in-store). 19 For example, carbonated beverage companies spent more to market their products to teens than any other food category ($382 million), but just 16% of those expenditures were for television advertising, compared with 70% of fast food marketing expenditures. 19 The Rudd Center reported that adolescents viewed television advertisements for fruit (i.e., fruit-flavored drinks), sports, and energy drinks averaging 1.3, 0.5, and 3 ads/week, respectively,6,20,21 which is less than what most caregivers and adolescents reported for these beverages in this study. However, as with expenditures on carbonated beverage marketing to teens, television advertising represented a lower-than-average proportion (14%) of marketing expenditures for noncarbonated beverages targeted to teens. 19 Interestingly, despite the finding in the Rudd Center study that teens viewed approximately one television advertisement for bottled water every 2 weeks 6 and that bottled water represented less than 5% of all beverage marketing spending, 20 a higher proportion of both caregivers and adolescents perceived that adolescents saw or heard bottled water advertisements ≥1 time/day than across other frequency categories for bottled water. It is possible that both adolescents and caregivers are overestimating their marketing exposure to bottled water, especially given evidence from another Rudd Center study that revealed that parents overestimate marketing for healthier products, including bottled water. 13
Both caregivers and adolescents reported that adolescents saw or heard food and beverage marketing most frequently on television, followed by grocery store/supermarket, internet/cell phone, convenience store/gas station, and then in school. This is not surprising, given that adolescents watch over 3 hours of television per day, 8 of which 50% of advertisements are dedicated to food and beverages. 22 Between 2006 and 2008, the number of youth-oriented cross-promotions on product packaging (i.e., agreements with other companies to promote one another's products) in supermarkets increased by 78%, thereby leading to increased opportunities for marketing exposure to adolescents in stores. 10 Among 8 to 18 year olds, 20% of media exposure occurs on mobile devices and 84% have internet access at home,18,22 thereby increasing the risk of marketing exposure by internet/cell phone. Convenience stores/gas stations may be common places for marketing exposure resulting, in part, from many of them being within close proximity to schools, as evidenced by a Minnesota study that found that 83% of schools had a convenience store within 800 meters. 23 Further, 97% of these nearby convenience stores had food/beverage advertising, with 94% of the advertisements promoting less-healthful products. The finding that both caregivers and adolescents reported adolescent exposure to marketing within schools least often is interesting, given that 49% of middle and high schools allow advertising of less-healthy foods, based on an analysis of the 2008 School Health Profiles, School Principal Survey.4,24 It is possible that students may not interpret in-school advertising (e.g., sponsored scoreboards or vending machine branding) as marketing, and caregivers are less likely to be aware of marketing exposure in the school environment.
Of particular interest is the finding that a smaller proportion of adolescents report advertising exposures ≥1 time/day across all food/beverage advertising categories than their caregivers. However, based on this study, whether adolescents or their caregivers are reporting adolescent exposures more accurately cannot be determined. It is possible, however, that both adolescents and caregivers are underreporting adolescent exposures, given evidence from one study comparing parent responses to adolescent exposures to television food marketing and actual television exposure data from Nielsen Media research that revealed that parents are not fully aware of the frequency with which their adolescent children are exposed to advertising. 13 This suggests that it is possible that adolescents may be even less aware of the food marketing exposures they encounter daily than their caregivers, given the results of this study. Further, in this study, more adolescents than caregivers responded that they do not know their frequency of advertising exposure, which may suggest that some adolescents may not process food marketing exposures as such.
Although this study is the first, to the authors' knowledge, to compare responses by both caregivers and adolescents regarding frequency of food and beverage advertising exposures and most common locations of exposures among adolescents, there are several limitations to this study. First, selection bias may be a problem, given the use of a convenience sample. Second, questions have not undergone psychometric testing; therefore, the reliability and validity of the questions is not available. Third, the accuracy of reporting by the adolescents or their caregivers was unable to be determined, given that no quantitative (e.g., non-self-reported) data on advertising exposure were available. Fourth, although caregiver and adolescent data were linked, it is possible that caregivers could be responding on behalf of all of their children and not just the teenage child who responded to the YouthStyles survey. Last, participants likely self-defined advertising, given that no definition of advertising was provided, so it is not clear whether they would consider all types of advertising that could be considered.
Conclusions
This study reported perceived exposure to food and beverage advertising among adolescents by adolescents and their caregivers and found a high frequency of at least daily exposure for many food/beverage categories, including high daily exposure to fast food, soda, and sports drinks. There was agreement of approximately 54–62% between adolescents and caregivers on the reported exposure to food/beverage advertising exposures among adolescents across all categories. Although adolescents generally tended to report lower exposure than their caregivers' report, and a greater proportion reported not knowing their exposures in comparison to caregivers, both caregivers and adolescents tended to follow similar patterns in terms of reporting the advertisements that adolescents viewed most frequently as well as the top locations of exposure. However, further research could verify self-reported exposure data with actual exposure data to determine whether adolescents and their caregivers are reporting adolescents' exposure to marketing accurately. Regardless, these data can help inform potential actions that decision makers might take, such as education of adolescents and their caregivers on the various modes of food/beverage advertisements and their potential impact on adolescents, especially among groups at higher risk for obesity.
Footnotes
Acknowledgments
The authors acknowledge Heidi Blanck, PhD, for providing assistance with the creation of the food marketing questions for the survey and in manuscript preparation. The findings and conclusions in this report are those of the authors and do not necessarily represent the official position of the CDC.
Author Disclosure Statement
No competing financial interests exist.