
Abstract
Abstract
Background:
Treatment programs for overweight and obese young children are of variable effectiveness, and the characteristics of effective programs are unknown. In this systematic review with meta-analysis, the effectiveness of treatment programs for these children is summarized.
Methods:
PubMed, Embase, Web of Science, and PsycINFO databases were searched up to April 2012. Articles reporting the effect of treatment on the body weight of overweight or obese children with a mean age in the range of 3–<8 years are included. Studies reporting the change in BMI z-score with standard error were included in a meta-analysis. For this purpose, a random-effects model was used.
Results:
The search identified 11,250 articles, of which 27 were included in this review. Eleven studies, including 20 treatment programs with 1015 participants, were eligible for the meta-analysis. The pooled intervention effect showed high heterogeneity; therefore, subgroup analysis was performed. Subgroup analysis showed that program intensity and used components partly explained the heterogeneity. The subgroup with two studies using multicomponent treatment programs (combining dietary and physical activity education and behavioral therapy) of moderate or high intensity showed the largest pooled change in BMI z-score (–0.46; I2, 0%).
Conclusion:
Although the subgroup multicomponent treatment programs of moderate to high intensity contained only two studies, these treatment programs appeared to be most effective in treating overweight young children.
Introduction
The prevalence of overweight and obesity is on the rise worldwide. 1 Obesity in childhood has severe somatic and psychosocial consequences in the short and long term.2–5 Successful treatment programs change behavior (diet and activity level) and therefore decrease overweight and its consequences. 6 Often, behavioral therapy is included to help participants initiate and sustain behavioral change. 6 A ≥0.5 reduction in BMI z-score is clinically relevant given that it is associated with a reduction in cardiovascular risk (CVR) factors and insulin resistance (IR) in children 4–15 years of age.7–9
Starting treatment at a young age appears to be more successful than treating older children.10–13 First, parents have more control over their children's daily environment at early age, potentially making lifestyle changes easier. Second, starting treatment at a young age possibly prevents early adiposity rebound, the time point when BMI rises after reaching a nadir, predicting later obesity.14–16 To change targeted children's lifestyle behavior, optimal strategies must take into account children's developmental stage, because developmental stage influences the child's liking or disliking healthy behavior and understanding of health. 17
Clinical guidelines from the United States, UK, and The Netherlands summarize the recommendations for the treatment of children with obesity, but do not give age-specific recommendations for young children.18–22 The Cochrane review on interventions for treating obesity in children by Oude Luttikhuis and colleagues concluded that combined behavioral lifestyle interventions give favorable results, but interventions in young children were not reviewed separately. 23 Two systematic reviews were performed describing interventions to prevent or treat obesity in preschool-age children (2–5 years of age).24,25 Both reviews concluded that it was advisable to address adults (e. g., parents and teachers) or families, rather than children alone, and to employ multicomponent interventions focusing on more than one strategy.24,25 Given that a meta-analysis was not performed, the overall effectiveness of treatment programs and the characteristics of effective treatment programs for overweight or obese young children are unknown. The aim of this article is therefore to summarize the effectiveness of treatment programs in overweight or obese children at an early age (mean age, 3–<8 years), as indicated in the literature up to April 15, 2012.
Methods
Search Strategy
The databases PubMed, Embase, Web of Science, and PsycINFO were searched. Database-specific keywords relating to overweight, obesity, children, treatment, and trial were used (Table 1). The search was limited by language (English, Spanish, German, and Dutch). The search included publications up to April 15, 2012.
Keywords Used in Databases
Wildcard symbol for search term truncation. Search is on every word that starts with the letters before the asterisk.
Literature Selection
Inclusion criteria were: body weight or another variable that contains body weight as the outcome of treatment (compared to no treatment, usual care, or baseline); population of overweight or obese young children, with a mean or median in the age of 3–<8 years; and English, Spanish, German, or Dutch language. If mean or median age was not reported, the article was included if the estimated mean age, based on age range and normal distribution, was in the range of 3–<8 years. No inclusion criteria were used regarding duration, aim, or design of the study.
All titles were reviewed. If the title showed that the study was not potentially relevant, the study was excluded; otherwise, abstracts were obtained. The first 10% of abstracts were reviewed by three authors (E.vH., E.F., and A.J.), and discrepancies were discussed to arrive at a consensus. Because the level of consensus was high (>90%), the other abstracts were reviewed by one author (E.vH.). The selected publications were critically and independently appraised by three authors (E.vH., E.F., and A.J.) using a checklist including the above-named inclusion criteria, characteristics of the study, validity, and applicability. Discrepancies were discussed to reach consensus. The references of included articles were checked to prevent articles meeting the inclusion criteria from being missed.26–50
Data Extraction
Data on design, participants, intervention, outcome variables, and results were extracted. An Excel data extraction form was used. Uncertain data were discussed. BMI z-sore is the preferred outcome variable because it accounts for weight, height, and age. 51 Changes in BMI z-score (difference between mean before and after treatment) were extracted from the articles. Height and weight were assessed by objective measures (not self-reported). All groups that underwent a described treatment were seen as a treatment group in this review, regardless of their status as intervention or control group in the trial. If the change in BMI z-score was not reported, it was converted from the data given in the article (BMI z-score before and after treatment) whenever possible. If a BMI z-score was not described, but it was reported that BMI z-scores were calculated at any time in the trial, additional information from the authors was requested. Results without BMI z-scores were excluded from further statistical analyses. Risk of bias in the study was taken into account by registering the presence of control group, randomization procedure, and quality of data analysis.
Corresponding measures of precision (standard deviations [SDs], standard errors [SEs], or 95% confidence interval [CI]) of the means and the difference between the means (change in BMI z-score during treatment) were extracted. If SDs were given rather than SEs, the SE was calculated by dividing the SD by the square root of n. In some studies, the SD or SE of the mean change was missing.32,39,41,43,49 In these cases, the following formula was used: standard deviationdifference=square root ([variancebaseline+variancefollow-up] – [2×correlationbaseline, follow-up×standard deviationbaseline×standard deviationfollow-up]).6,52 The median correlation between the baseline and post-treatment BMI z-score was calculated from the selected studies35,43,47 and was 0.87; this is comparable to the correlation observed in other studies, 6 and hence this value was used in the formula above.
Data Analysis
Results are reported with a 95% CI. Statistical significance was set at p<0.05. The statistical heterogeneity was calculated using the I2 statistic, which indicates the percentage of variance that is attributable to heterogeneity. 53 Values less than 25%, 50%, and 75% were considered as low, moderate, and high heterogeneity, respectively. 53 Because of suspected residual heterogeneity resulting from difference between studies and study populations, meta-analysis was conducted according to a random-effects model. 54 If heterogeneity was moderate or high, the causes of the heterogeneity were explored by carrying out subgroup analyses. The following determinants were expected to influence the effect of treatment programs for overweight children: different components in the treatment program and intensity of treatment.6,23 Therefore, possible subgroups were determined according to these determinants. Important components in treatment programs are dietary (DE) and physical activity (PA) education (PE) and behavioral therapy (BT).6,23 BT was defined as therapy, techniques, or counseling on self-monitoring of diet and PA, cue elimination, stimulus control, goal setting, action planning, modeling, limit setting, and other behavior modification strategies. 55 PE included training or education given. Intensity of treatment (duration over the course of the intervention period) was categorized as very low (<10 hours), low (10–25 hours), moderate (26–75 hours), or high (>75 hours), as proposed in the review by Whitlock and colleagues for the U.S. Preventive Services Task Force. 6 Further, parental participation could influence the effect of treatment. 56 However, most studies involved parents, and therefore the subgroup, child-only, was too small to investigate the effect of parental participation in this age group. To investigate the change in BMI z-score of nontreated overweight children, the results of control groups with overweight children, without intervention or education reported in the selected articles, was used for a subgroup random-effects meta-analysis.
All analyses were carried out using the statistical program, R (version 2.15.1; R Core Team, Vienna, Austria), with the metafor package.57,58 Funnel plots or Egger's test were not conducted to assess for publication bias, because the data were too heterogeneous to combine or, when pooled, groups included a limited number of studies.
Results
Literature Search
The search identified 11,250 articles, of which 2516 were duplicates (Fig. 1). After the screening of titles, abstracts, and full-text articles, 50 articles were selected for detailed evaluation and discussion of discrepancies by three authors (E.vH., E.F., and A.J.). Twenty-five articles were included and 25 were excluded after evaluation and discussion. Two more articles were found in references and included59,60; thus, finally, 27 articles were included for further characterization (Fig. 1).26–50,59,60

Flowchart of the search and selection process.
Characteristics of the Selected Studies
The 27 selected studies were classified according to the components included in the evaluated treatment program of the intervention group (Tables 2–4). Eighteen studies reported on multicomponent treatment programs, combining DE and PE and BT (Table 2).26,27,29–31,35,38,39,41–43,45–50,60 Four studies evaluated combined DE and PE (Table 3).28,34,40,44 Five studies evaluated treatment programs consisting of PE or DE (Table 4).32,33,36,37,59 Characteristics differed highly between studies (Tables 2–4). Unclear or missing data in some publications were age range (n=2),34,40 gender (n=2),33,34 weight status of the study population (n=6),26,29,30,40,44,50 primary focus (n=3),28,39,49 duration (n=1), 50 and number of sessions (n=4)31,36,50,59 of the intervention (Tables 2–4).
Studies with at Least One Group Treated by a Multicomponent Treatment Program, Including Dietary (DE) and Physical Activity (PE) Education and Behavioral Therapy (BT)
Dash (−) indicates no effect (upper limit of 95% CI ≥0). Plus sign (+) indicates positive result (upper limit of 95% CI <0) and mean change of BMI z-score of ≥−0.2. Plus-minus sign (±) indicates positive result (upper limit of 95% CI <0) and mean change of BMI z-score of 0 to −0.2. Bold indicates included in meta-analysis.
Characteristics of population included in review.
Waiting list control group reported, but without clear description.
Data online available 2011, printed version 2013.
Nine months after start of program.
Six months after start of program (results provided after contacting authors).
y, years; mo, months; F, female; M, male; ACHA, American Child Health Association; C, control group; Ch, child; Fam, family; I, intervention group; IOTF, International Obesity Task Force; p, percentile; SDs, standard deviations; P, parents; tele, extra contact by telephone; PHC, primary healthcare; Rs, research; SHC, secondary healthcare.
Treatment Programs with Combined Dietary (DE) and Physical Activity (PA) Education
Dash (–) indicates no effect (upper limit of 95% CI ≥0). Plus sign (+) indicates positive result (upper limit of 95% CI <0) and mean change of BMI z-score of ≥−0.2. Plus-minus sign (±) indicates positive result (upper limit of 95% CI <0) and mean change of BMI z-score of 0–0.2. Bold indicates included in meta-analysis.
Characteristics of population included in review.
y, years; SD, standard deviation; M, male; F, female; p, percentile; BT, behavioral therapy; C, control group; Ch, child; Fa, father; Fam, family; I, intervention group; mo, months; w, weeks; Rs, research; SHC, secondary healthcare.
Treatment Programs Including Physical Activity (PA) or Dietary Education (DE) Only
Dash (−) indicates no effect (upper limit of 95% CI ≥0). Plus sign (+) indicates positive result (upper limit of 95% CI <0) and mean change of BMI z-score of ≥−0.2. Plus-minus sign (±) indicates positive result (upper limit of 95% CI <0) and mean change of BMI z-score of 0–0.2. Bold indicates included in meta-analysis.
Characteristics of population included in review.
y, years; M, male; F, female; p, percentile; as, appetite suppressant (drug); BT, behavioral therapy; C, control group; Ch, child; I, intervention group; Mot, mother; P, parents; mo, months; w, weeks; Rs, research; Sc, schools; SHC, secondary healthcare.
Meta-Analysis
From the selected 27 studies, 16 were excluded from further analyses for several reasons,26–31,36,38,40,42,44,45,47,50,59,60 resulting in 11 studies (Fig. 1).32–35,37,39,41,43,46,48,49 In addition, the control groups, but not the intervention groups, of five studies were excluded from the meta-analysis because no treatment was given or the treatment was unspecified.32,39,41,48,49
Meta-analysis was performed with data from these 11 studies including 20 treatment groups and consisting of a total of 1015 participants.32–35,37,39,41,43,46,48,49 The pooled difference in BMI z-score derived from the random-effects model showed a significant improvement in BMI z-score (–0.25; 95% CI, −0.36 to −0.14; Fig. 2) with high heterogeneity (I2=100%). The two studies describing case reports, which were excluded from the meta-analysis, also reported a decrease in BMI z-score during treatment.27,44
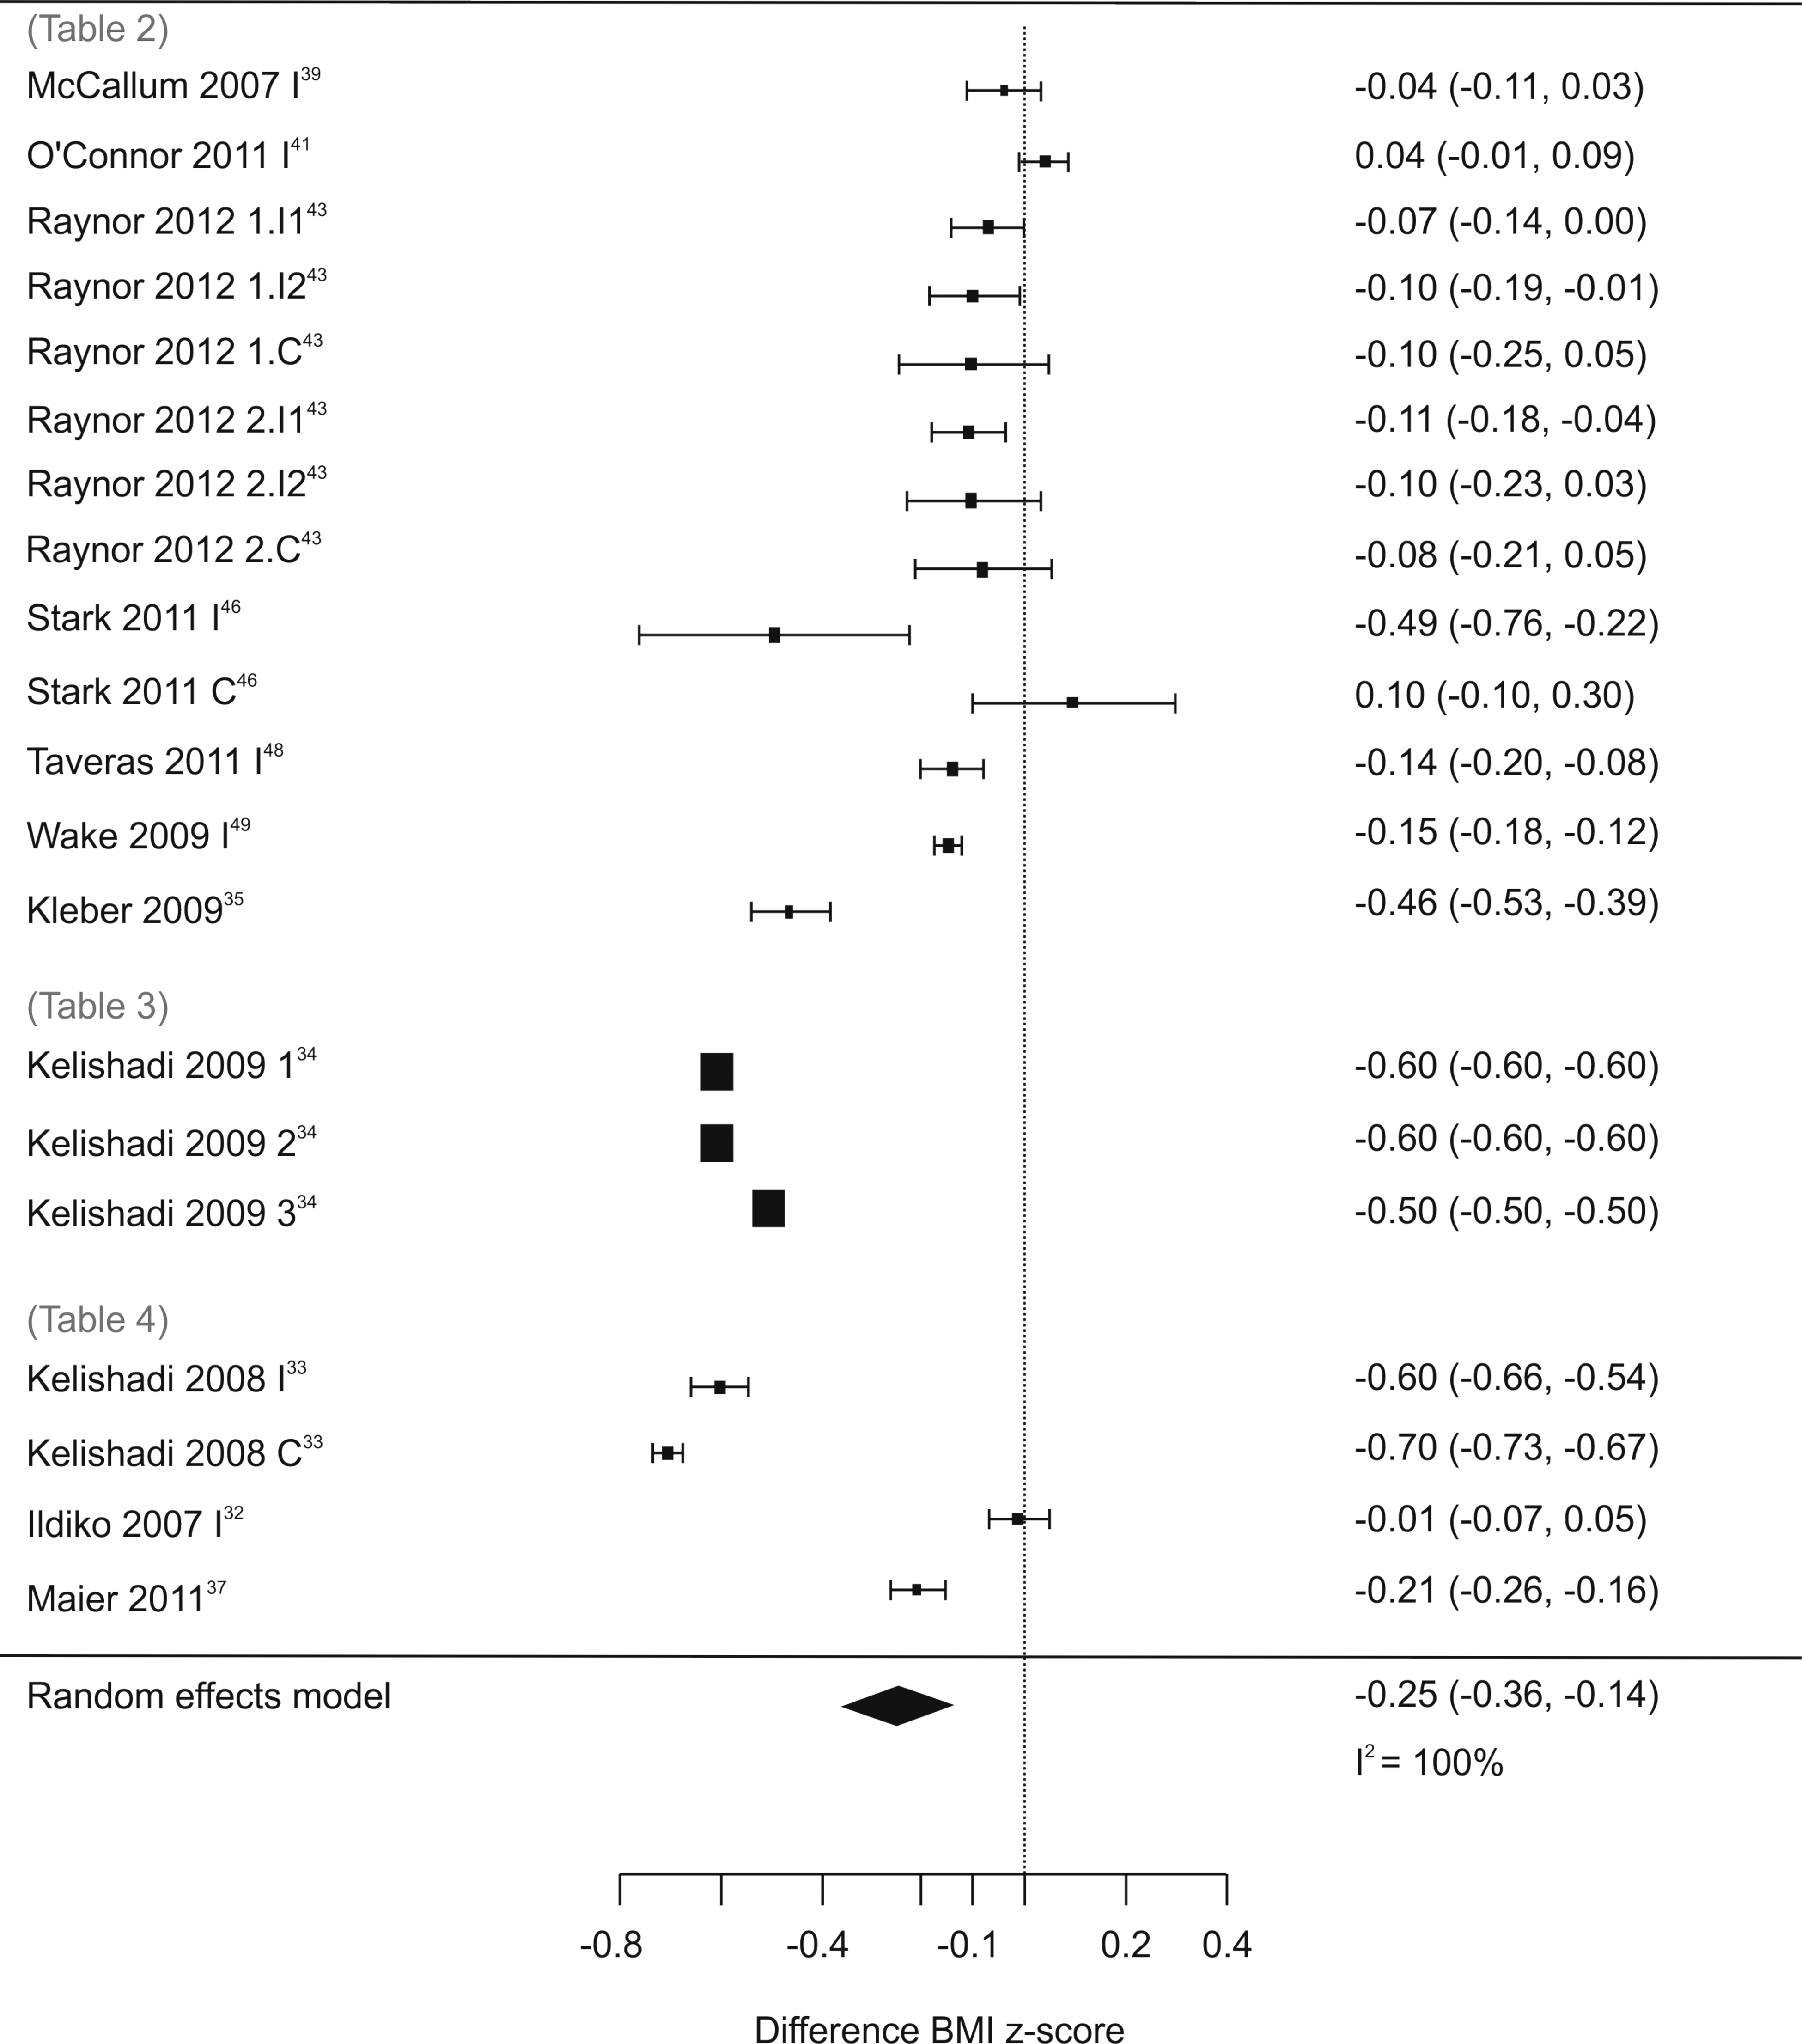
Forest plot showing change in BMI z-score from start to end of treatment. Horizontal bars represent 95% confidence intervals. I2=the percentage of total variation across studies resulting from heterogeneity.
Six treatment groups (derived from five studies) followed a “multicomponent very low intensity treatment” program, and random-effects analysis showed a small effect (–0.08; 95% CI, −0.13 to −0.03) with high heterogeneity (I2=79%; Table 5).39,41,43,48,49 However, three of the six treatment groups showed no significant effect.39,41,43 Two groups received “multicomponent moderate or high intensity treatment” with significant improvement in BMI z-score (–0.46; 95% CI, −0.53 to −0.39) and low heterogeneity (I2=0%; Table 5).35,46
Results of Random-Effects Analysis of Subgroups by Type and Intensity of Treatment Program
I2 indicates the percentage of total variation across studies resulting from heterogeneity.
“Nutritional education combined with either behavioral therapy or physical activity education very low intensity treatment” was given to eight treatment groups (derived from three studies; Table 5).34,43,46 The random-effects model showed a nonsignificant effect (–0.31; 95% CI, −0.51 to 0.02) with high heterogeneity (I2=100%). Compared with the other studies, the study of Kelishadi and colleagues is an outlier, with a high reduction in BMI z-scores. 34 The very small 95% CIs were prominent in all three treatment groups (Fig. 2). 34 Despite contacting the author, no explanation was available. When these treatment groups were excluded, the effect was smaller (–0.05; 95% CI, −0.14 to 0.05) and heterogeneity reduced to 11% (Table 5).
In the remaining categories (“nutritional education very low intensity” and “physical education high intensity”), the decrease in BMI z-score in the study of Kelishadi and colleagues was also higher 33 and with very small 95% CI, in comparison with the other studies in these categories.32,37 In both subgroups, the heterogeneity was high, and the pooled random-effects model showed no significant effect (Table 5).
In an additional analysis, three control groups without any treatment or education, which were excluded from the main meta-analysis, were pooled. These showed no change in BMI z-score (–0.01; 95% CI, −0.12 to 0.15).32,39,49
Discussion
This systematic review with meta-analysis shows that treatment programs targeting lifestyle using DE, PE, and/or BT have an overall, positive effect on BMI z-scores of young children. The reviewed treatment programs differed in components and intensity and, partly as a result of this, showed high heterogeneity.
For the subsequent subgroup analysis, predefined subgroup analyses were used, which prevents data dredging. 54 It was found that the programs in the category “multicomponent treatment of moderate to high intensity” led to the largest reduction in overweight with 0% heterogeneity. A reduction of this magnitude (i.e., 0.5 BMI z-score) was associated with decreased CVR factors and IR in children ages 4–12 and is thus likely to be clinically relevant.7–9 However, this category included only two studies, and therefore the results should be interpreted with caution.
To take children's age into account, (change in) BMI z-score was used as the outcome in the meta-analysis. Twelve studies, however, reported no data on change in BMI z-score, and these were excluded from the meta-analysis. Some of these studies did report on BMI, and most of these investigated multicomponent treatment programs of very low to moderate intensity (Table 2).26,29,45,47 A BMI decrease of approximately 1–4 kg/m2 during treatment was noted, supporting the assumption that limiting the meta-analysis to BMI z-score as the outcome variable did not bias the results. Future studies evaluating treatment programs for overweight children should report at least BMI z-score with SD as the outcome measure to make it possible to compare all programs.
The observed heterogeneity was partly explained by intensity and components used in treatment. In the sensitivity analysis, two studies by Kelishadi and colleagues were excluded, which lowered the heterogeneity in one subgroup and resulted in an inadequate number of studies for meta-analysis in two other subgroups. After these analyses, the heterogeneity in the remaining subgroups was 0%, 11%, and 79%. Because of the limited number of included studies (n=11), it was not possible to investigate the heterogeneity in more detail. Other characteristics of the intervention programs, such as setting and experience of caregivers, may also have induced heterogeneity. In addition, characteristics of the study population, such as age range, socioeconomic status, ethnicity, and weight status, may have played a role.
Only a limited number of randomized, controlled trials (RCTs) were found on lifestyle treatment of young overweight children. Control groups differed from no treatment to treatment with different components at a very low intensity. Accordingly, it was difficult to compare the difference in BMI z-score between intervention and control groups of different RCTs. For the meta-analysis, it was therefore decided to compare the effects of each group that underwent a well-specified treatment, even if these groups were used as a control intervention in a trial. This avoids loss of information about the groups that underwent treatment, but were used as a control group. The subgroup “multicomponent very low intensity” was the only subgroup that contained several RCTs.39,41,43,48,49 These RCTs were additionally analyzed, pooling the changes compared to changes in the control group (random-effects model), and this did not change the conclusions (–0.04; 95% CI, −0.08 to 0.01; I2=0%).
Studies with a nonrandomized control group or without a control group were also included. Therefore, this study can also be seen as a meta-analysis of observational data. Analysis of observational data has a role in medical effectiveness research. 65 In the included studies, secular changes could have affected the results. Random-effects analysis of the control groups without any treatment or education showed no change in BMI z-score (–0.01; 95% CI, −0.12 to 0.15).32,39,49 Therefore, it can be considered that a decrease in BMI z-score, particularly if this decrease is higher than the lower confidence limit on the nontreated groups (–0.12), results from a true treatment effect and not from secular changes. Also, it can be argued that nonrandomized studies are more likely to be representative of typical clinical practice than RCTs, 66 and this also prompted us to include nonrandomized studies.
In most trials, an intention-to-treat analysis was done, but in three trials, this was not clear.32–34 Most studies excluded missing measurements from the analyses. Only in three studies was a type of imputation of the missing final BMI z-score data used (Tables 2–4).35,43,46 The inclusion and exclusion criteria (and the used definition of overweight/obesity) and recruiting strategies differed between studies, hence between intervention groups as reported in Tables 2–4. Together with the differences in handling missing measurements and dropouts, this may have introduced selection bias. However, these differences were present in each subgroup and hence cannot explain the differences in observed effect. The length of intervention, and therefore the length of follow-up, differed between the studies. For the studies in the meta-analysis, the length of intervention varied between 12 weeks and 1 year. This was not equally distributed between the subgroups and could therefore have led to a detection bias in outcome. It can be hypothesized that a longer duration of intervention and follow-up (with the same hours of contact with therapists) would lead to a smaller BMI reduction. In the subgroup “multicomponent treatment of moderate to high intensity,” the duration of intervention was, on average, the longest, and therefore the effect may have been underestimated, rather than overestimated. Performance bias, resulting from a concurrent intervention or to low fidelity to the intervention, for example, could not be ruled out because this was not reported in the included studies. The intervention setting may affect the generalizability of the study findings. Both studies in the subgroup “multicomponent treatment of moderate to high intensity” were performed in secondary healthcare.35,46 Further, aspects such as collaboration between healthcare professionals, patient motivation, and access to healthcare may vary between countries and regions. Most studies included in the meta-analysis were performed with children of a broad age range. Some studies found were performed exclusively with children of preschool or school age, but these studies included different strategies (intensity and components of treatment).39,41,46,48 If these age groups were compared in the analysis, the used strategies would act as a confounder.
Based on this review, the treatment of choice for overweight or obese young children is a multicomponent treatment program of moderate- to high-intensity treatment. In both treatment programs in the subgroup “multicomponent treatment of moderate to high intensity,” parental participation was high, and parents were seen without the presence of their child.35,46 However, in most other included studies, parents were also involved, as recommended in the guidelines, and therefore it was not possible to further investigate the effect of this strategy.
This study focused on BMI, but changes in somatic parameters, such as CVR factors and psychosocial parameters, such as health-related quality of life (HRQoL), are important, given that psychosocial effects, especially, may not always correspond with the change in body weight. In both studies included in the subgroup “multidisciplinary treatment of moderate to high intensive treatment,” somatic or psychosocial parameters were also evaluated.35,46 In the study of Stark and colleagues, no changes in overall HRQoL were observed. 46 However, physical functioning was significantly improved at the end of treatment, in comparison to the control group. 46 In the study of Kleber and colleagues, a significant improvement of blood pressure, IR, triglyceride levels, high-density lipoprotein cholesterol, and intima-media thickness of the carotid artery was observed. 35 Both treatment programs also described long-term results (from 6 months to 4 years after treatment), and these results were also positive.35,46
To evaluate how treatment programs work, additional information on change in knowledge, thinking patterns, and behavior (dietary intake and PA patterns) should be obtained. This was not completely available for the two clinically effective programs. The study of Stark and colleagues assessed the effect on thinking patterns and lifestyle behavior. 46 Changes in caloric intake and parental motivation, but not in PA, were observed. For the study of Kleber and colleagues, these data were not available. 35
In addition, the exact content and theory base of many treatment programs included in this review were not sufficiently or clearly reported, as noted before. 67 For future studies, it is important to report the content and theory base of treatment programs more completely, given that this will enhance the transferability of successful programs to other settings and other locations. Further, reporting on the study population was not sufficient in various studies, which is also important for the transferability of the intervention. It is also important to report on smaller subgroups of age, to increase the knowledge on age-appropriate treatment.
Conclusion
This systematic review with meta-analysis found a positive effect on the BMI z-score of overweight young (mean age, 3–<8 years) children in treatment programs targeting lifestyle. Although the subgroup “multicomponent treatment programs of moderate to high intensity” contained only two studies, these treatment programs appeared to be most effective in treating overweight young children. These programs contained ≥26 hours of treatment with a combination of DE and PE and BT.
Because of the low number of studies performed, more research is needed on treatment programs for overweight or obese young children, especially multicomponent treatment programs of moderate to high intensity. Ideally, the studies should report content and theory of the treatment program, the effect on somatic and psychosocial parameters, the effect on knowledge and behavior, long-term effects, and, finally, how the treatment program works in a real-life setting.
Footnotes
Acknowledgment
The authors thank Dr. Ir. J.M.S. Renkema, information specialist of Facilities and Services WUR, for her help with the development of the search strategy.
Author Disclosure Statement
No competing financial interests exist for all authors.