
Abstract
Abstract
Background:
The accuracy and reliability of self-reported height and weight among adolescents in the process of calculating BMI is usually subject to bias. The aim of this study was to determine whether over- and under-reporting of self-reported height and weight existed among US high school students by weight category; if so, to examine anthropometric, behavioral, and demographic factors associated with over- and under-reporting.
Methods:
Data were retrieved from the National Youth Physical Activity and Nutrition Study, 2010, a nationally representative sample (7160 students, grades 9–12). Analysis of variance was performed to determine any significant difference between weight categories in misreporting. Discriminant function analysis and sequential logistic regression were executed to detect behavioral and demographic predictors of reporting accuracy, respectively.
Results:
The mean over-reporting of height and under-reporting of weight were 1.1 cm and 1.020 kg, respectively, which underestimated BMI and BMI percentile by 0.671 and 2.734, respectively. Use of self-reported height and weight for BMI calculation overestimated prevalence of healthy weight by 3.8% and underestimated prevalence of obesity by 4.1%. Underweight students under-reported height and over-reported weight, whereas overweight and obese students over-reported height and under-reported weight. Reporting accuracy of females was significantly higher. Weight loss behaviors, both healthy and unhealthy, were associated with BMI underestimation, whereas fast foods and screen time were associated with overestimation.
Conclusion:
Whenever possible, measuring height and weight is essential. However, because many studies must rely on self-reported values alone, additional research should examine the relationships between misreport of anthropometric data and lifestyle features in diverse adolescent samples to better interpret self-reported anthropometric data.
Introduction
Adolescence is a critical period in life, characterized by physical, psychological, and behavioral evolutions. Self-reported anthropometric data are less accurate in adolescents, compared to adults, because of these substantial and rapid changes. 1 A considerable proportion of obesity and nutrition research relies on self-reported height and weight resulting from convenience and cost-effectiveness. Moreover, this applies to state-wide or nationalized studies where in-person data collection is impossible (e.g., the Behavioral Risk Factor Surveillance System and Youth Risk Behavior Survey). Self-reported weight and height may be used as inclusion criteria in prospective studies, as a risk factor for chronic disease in retrospective studies, or as a covariate in outcomes research. The accuracy and reliability of self-reported height and weight among adolescents in the process of calculating BMI is usually subject to bias.2,3
In 15,483 adolescents ages 12–17 years, Goodman and colleagues found that the mean difference between self-reported and measured weights was as low as 0.19 kg (0.4 lbs) for boys and as high as 1.02 kg (2.2 lbs) for girls, 4 whereas Elgar and colleagues found an under-reporting of body weight by an average of 0.52 kg. 5 Resulting mean under-reporting of BMI values was as high as 2.6. 6 A recent statewide analysis of BMI of Pennsylvania adolescents also revealed a considerable discrepancy between self-reported and measured values. 7 Nevertheless, the correlations between self-reported and measured values were high in several studies.4,8 However, there has only been a limited attempt to examine behavioral and demographic factors associated with misreporting. 5 The aim of this study was to determine whether over- and under-reporting of self-reported height, weight, and BMI existed among US high school students by weight category and, if so, to examine anthropometric, behavioral, and demographic factors associated with over- and under-reporting.
Methods
Sampling Frame
Data were retrieved from the National Youth Physical Activity and Nutrition Study (NYPANS) conducted by the CDC in 2010. 9 NYPANS included a paper-and-pencil survey on behaviors and behavioral determinants related to nutrition and physical activity as well as standardized height and weight measurements in a nationally representative sample of high school students using a three-stage systematic cluster sample design. Schools were selected systematically with probability proportional to enrollment in target grades with a random start using a sampling frame of public, Catholic, and other private school students in grades 9 through 12 in the 50 States and the District of Columbia. Selection of classes from each school that participated in the survey was performed using systematic equal probability sampling with a random start involving a sampling frame of all classes meeting during a particular period of the day or all classes in a required subject, depending on the school. School response rate was 82% (138 schools), and student response rates for the survey and height and weight forms were 88% and 80% (11,458 and 10,303 students), respectively.
Sample
Analysis considered 10,303 students who completed both survey and height and weight measurements. After deleting cases with missing values, univariate outliers, and multivariate outliers, the final sample size remaining for further analysis was 7160. Missing value analysis of self-reported and measured height and weight data revealed the absence of any systematic relationship of incompleteness either with demographic variables or with BMI category.
Subjects
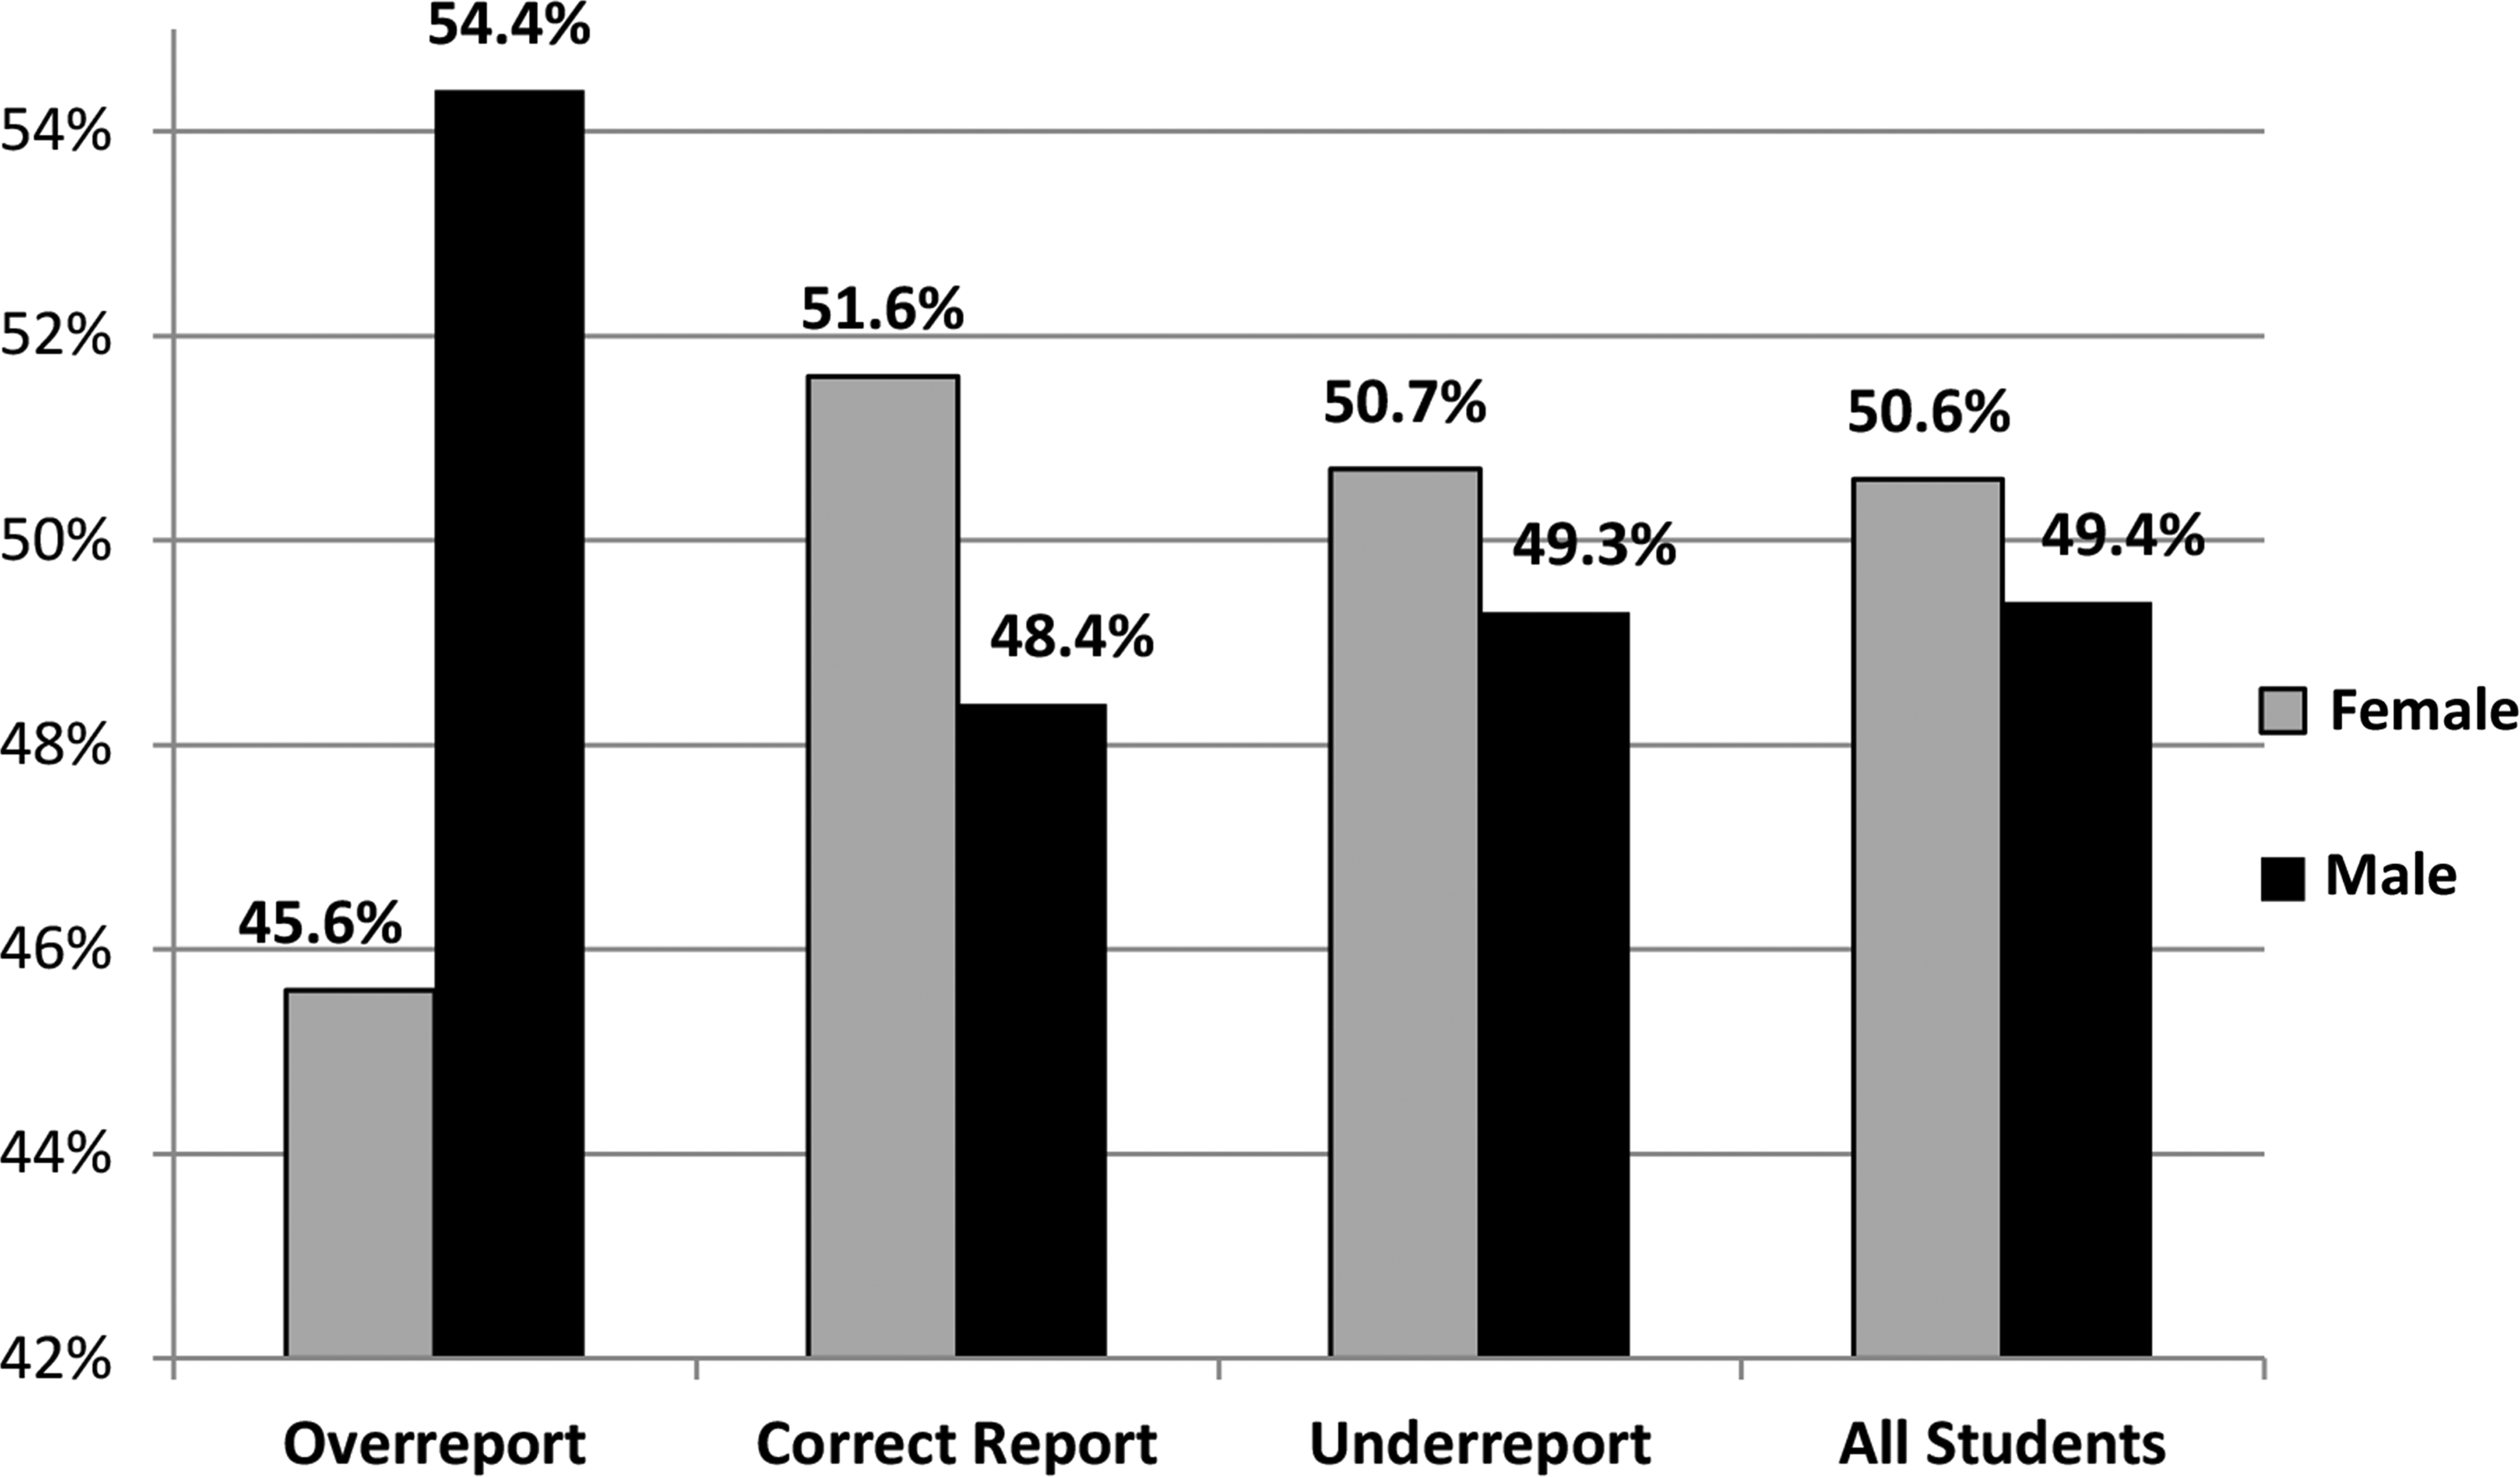
Of the retained 7160 students, 50.6% were female and 49.4% were male, whereas 43.9% were white, 29.4% were Hispanic, 19.3% black, and 7.4% other races. The majority (57.6%) was between 14 and 16 years, whereas 42.3% were older than 16 years. 10
Instruments
Forty-two behavioral questions of the 120-item survey were utilized for the current study in addition to age, sex, and race/ethnicity and self-reported height and weight: 14 on fruit and vegetable consumption (e.g., Yesterday, how many times did you eat fruit? Do not count fruit juice. Answers: 0, 1, 2, 3, 4, 5, or more); eight on physical activity (e.g., In an average week when you are in school, on how many days do you walk or ride your bike to school when weather allows you to do so? Answers: 0, 1, 2, 3, 4, or 5); seven on fast food consumption (e.g., During the past 7 days, on how many days did you eat at least one meal or snack from a fast food restaurant such as McDonald's, Taco Bell, or KFC? Answers: 0, 1, 2, 3, 4, 5, 6, or 7); three on television (TV) watching or playing video games (e.g., On an average school day, how many hours do you watch TV? Answers: I do not watch TV on an average school day, less than 1 hour per day, 1 hour per day, 2 hours per day, 3 hours per day, 4 hours per day, or 5 or more hours per day); five on healthy weight loss behaviors (e.g., During the past 30 days, did you drink more water to lose weight or keep from gaining weight? Answers: Yes, No); and five on unhealthy weight loss behaviors (e.g., During the past 30 days, did you skip meals to lose weight or keep from gaining weight? Answers: Yes, No). Height and weight were entered by students to the nearest inch and pound, respectively, on a bubble sheet. Measured height and weight were also recorded to the nearest inch and pound, respectively. BMI values were computed by converting height and weight into meters and kilograms, respectively. Underweight, healthy weight, overweight, and obese categories of adolescents were derived from CDC classification criteria for body composition of children that was based on BMI percentiles <5th, 5th–<85th, 85th–<95th, and ≥95th, respectively. 11 Each student was classified into a weight category, based on his or her age- and sex-specific measured and self-reported BMI-percentile.
Statistical Analysis
The data analysis was performed using IBM SPSS statistical software (version 19.0; IBM Corp., Armonk, NY). Six indices were created using 42 behavior-related items. The fruit and vegetable index (FVI) examined the types of fruits and vegetables consumed, as well as the frequency of intake (minimum [Min]=14; maximum [Max]=92; higher=better). The physical activity index (PAI) revealed the type, amount, and frequency of physical activity (Min=8; Max=46; higher=better). The fast food index (FFI) scrutinized the type and frequency of fast food intake (Min=7; Max=50; lower=better). The television-video index (TVI) explored the total screen time, that is, television, computer, and video games (Min=3; Max=21; lower=better). The healthy weight loss index (HWI) examined universally accepted weight loss strategies he or she practiced, such as low-fat meals, exercising to lose weight, and drinking more water, which are usually recommended for obese and overweight students and those in the upper range of healthy weight (Min=5; Max=10; lower=better). The unhealthy weight loss index (UWI) revealed unacceptable and unhealthy weight loss strategies, such as skipping meals, smoking, induced vomiting, and taking diet pills without medical advice (Min=5; Max=15; higher=better).
Measured minus self-reported values for height, weight, BMI, and BMI percentile were computed to create four new categorical variables. Each of these four new categorical variables had three levels, which divided 7160 students into three groups corresponding to anthropometric parameters: overreporters (OR); correct reporters (CR); and underreporters (UR). If the difference between measured and self-reported height was <1 inch, then the student was a CR for height. Remaining students were classified as either OR if self-reported overmeasured or UR if self-reported undermeasured. Similar rules were applied for weight (i.e., CR if the difference between measured and self-reported values was <2 lbs) and for computed BMI (i.e., CR if the difference between measured and self-reported values was <1). The cut-off values for CR were derived from findings of large-scale studies that measured mean differences between measured and self-reported values of height, weight, and BMI among adolescents.2,4–6
Analysis of variance was performed to test whether there was a significant over- or under-reporting of self-reported height, weight, and computed BMI by age- and sex-specific measured BMI category (i.e., underweight, healthy weight, overweight, or obese). If a difference existed, discriminant function analysis was performed to reveal the behavioral dimensions on which the groups differed. Six indices were treated as continuous independent variables, whereas OR, CR, and UR for computed BMI were considered classification (dependent) variables. Sequential logistic regression tested the sociodemographic factors associated with self-reporting accuracy of weight and height (or BMI), after controlling for behavioral determinants. The reporting accuracy was considered a dichotomous dependent variable—CR and the rest (=OR+UR).
Results
Magnitude of Misreporting
Mean measured height, weight, computed BMI, and BMI percentile were 1.678 m, 69.215 kg, 24.471, and 67.444, respectively, whereas corresponding mean self-reported values were 1.689 m, 68.195 kg, 23.800, and 64.710, respectively (Table 1). Height was over-reported by a mean of 1.1 cm (0.43 inches), and weight was under-reported by a mean of 1.02 kg (2.2 lbs). BMI computed from measured height and weight was higher than BMI computed from self-reported height and weight by a mean of 0.671; mean BMI percentile of measured values was higher than the mean BMI percentile of self-reported values by 2.734 percentiles (Table 1).
Mean and Standard Deviation for Measured and Self-Reported Height, Weight, BMI (Computed), and BMI Percentile
SD, standard deviation.
Correct reporting of height, weight, and computed BMI among students was 35.3%, 39.3%, and 54.5%, respectively (Table 2). Over-reporting of height (46.6% of students), under-reporting of weight (38.8%), and under-reporting of computed BMI (34.4%) were noticeably high (Table 2). According to measured BMI, 2.4% of students were underweight, 60.8% healthy weight, 18.1% overweight, and 18.7% obese. However, according to self-reported computed BMI, 3.0% were underweight, 64.6% healthy weight, 17.9% overweight, and only 14.6% obese. Therefore, by using self-reported height and weight for calculating BMI, prevalence of underweight and healthy weight were overestimated by 0.6% and 3.8%, respectively, and prevalence of overweight and obese were underestimated by 0.2% and 4.1%, respectively. Total misclassification caused by self-report errors was 8.7%.
Derived from measured value minus self-reported value.
Misreporting by Weight Category
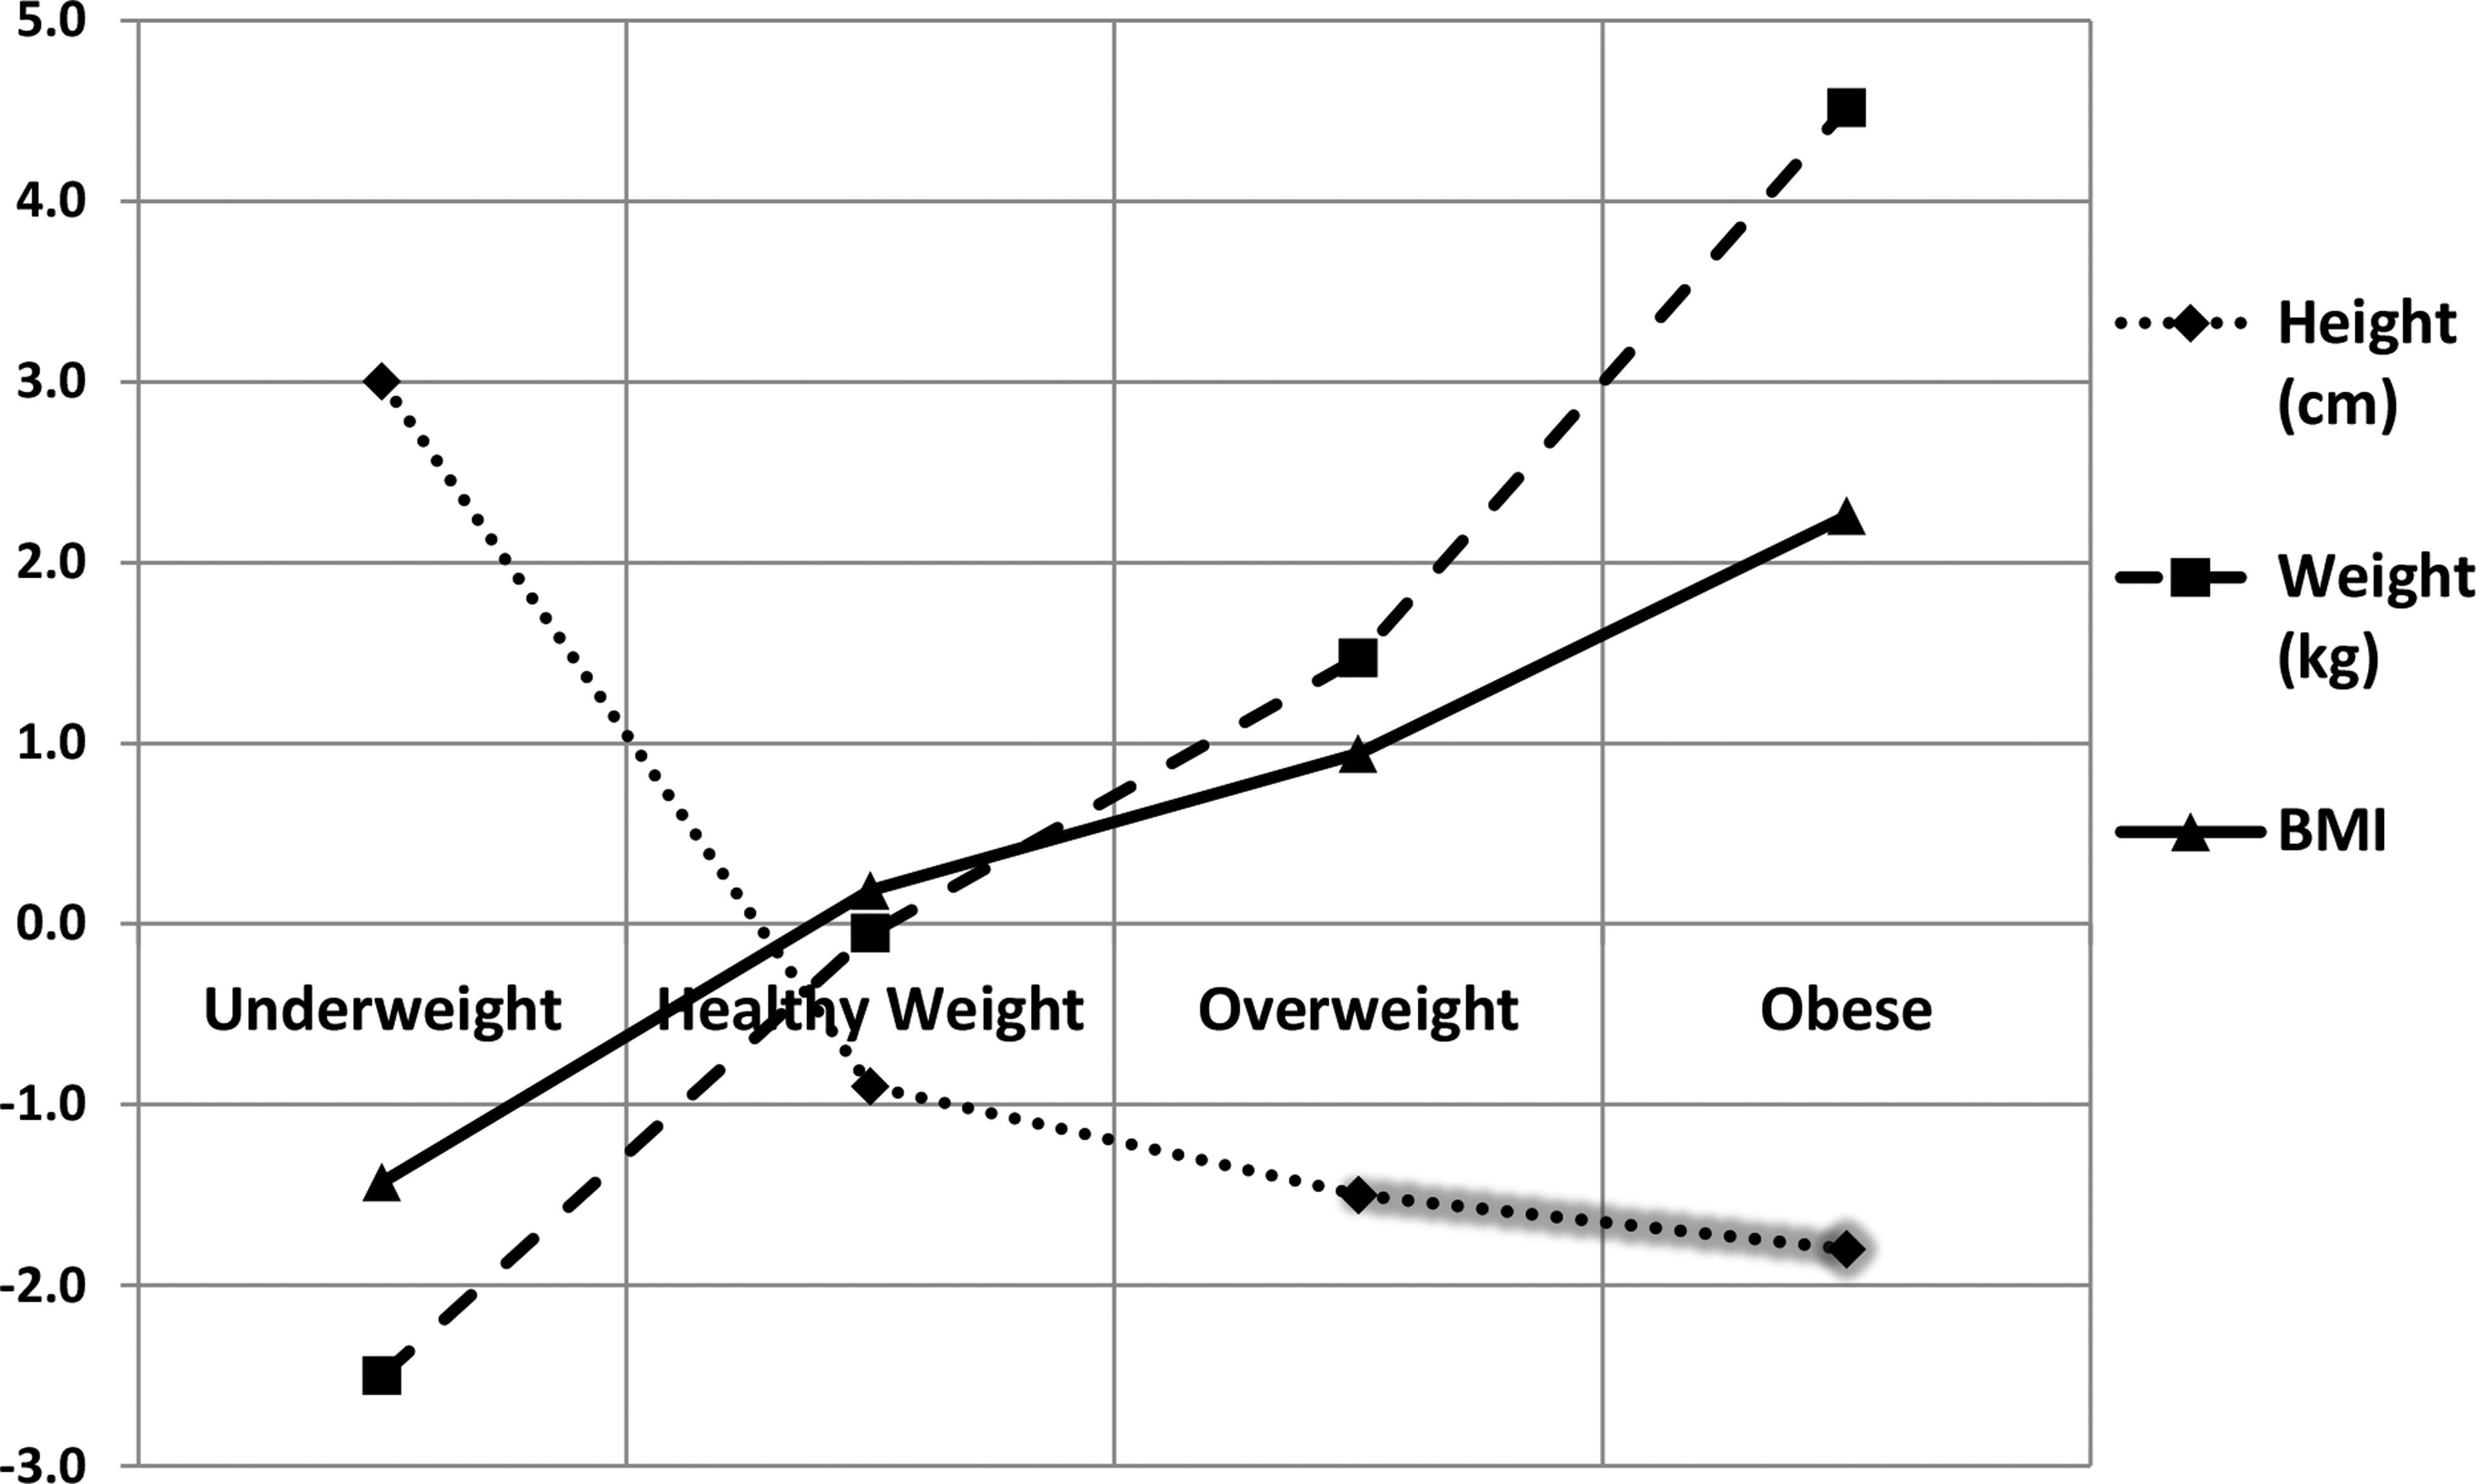
With regard to misreporting of height, a significant difference existed among underweight, healthy weight, overweight, and obese groups (F(3,7156)=65.55; p<0.00). Height was under-reported only in the underweight group (mean underreporting=0.030 m), whereas healthy weight, overweight, and obese groups over-reported (mean over-reportings=0.009, 0.015, and 0.018 m, respectively). Mean differences between all pairs of weight categories were significant (p<0.001) for height discrepancy, except between overweight and obese groups (Fig. 1). Similarly, a significant difference in misreporting of weight among weight categories existed (F(3,7156)=306.57; p<0.001). Weight was over-reported in underweight and healthy weight groups by 2.499 and 0.052 kg, respectively, whereas under-reported in overweight and obese groups by 1.472 and 4.517 kg, respectively (p<0.001 for all comparisons). A significant difference in computed BMI discrepancy was found among groups (F(3,7156)=394.98; p<0.001), over-reported in underweight group by 1.430 and under-reported in healthy weight, overweight, and obese groups by 0.184, 0.942, and 2.257, respectively (p<0.001 for all comparisons).
Behaviors by Weight Category
In all behavioral indices, except in FVI, significant differences existed among means for underweight, healthy weight, overweight, and obese students. Students with healthy weight were significantly different from obese students with regard to all behavioral indices, except for FVI. In HWI, all weight categories had significant differences among one another (Table 3).
Differences among means according to Tukey's honest significant difference multiple comparisons.
These healthy behaviors are usually recommended for obese and overweight people and those in the upper range of healthy weight. The index is inversely correlated with behaviors; the higher the practice of healthy weight loss behaviors, the lower the index.
These unhealthy behaviors are usually not recommended for anyone. The index is inversely correlated with behaviors; the higher the practice of unhealthy weight loss behaviors, the lower the index.
p<0.05; **p<0.001.
Behaviors by Misreporting Category
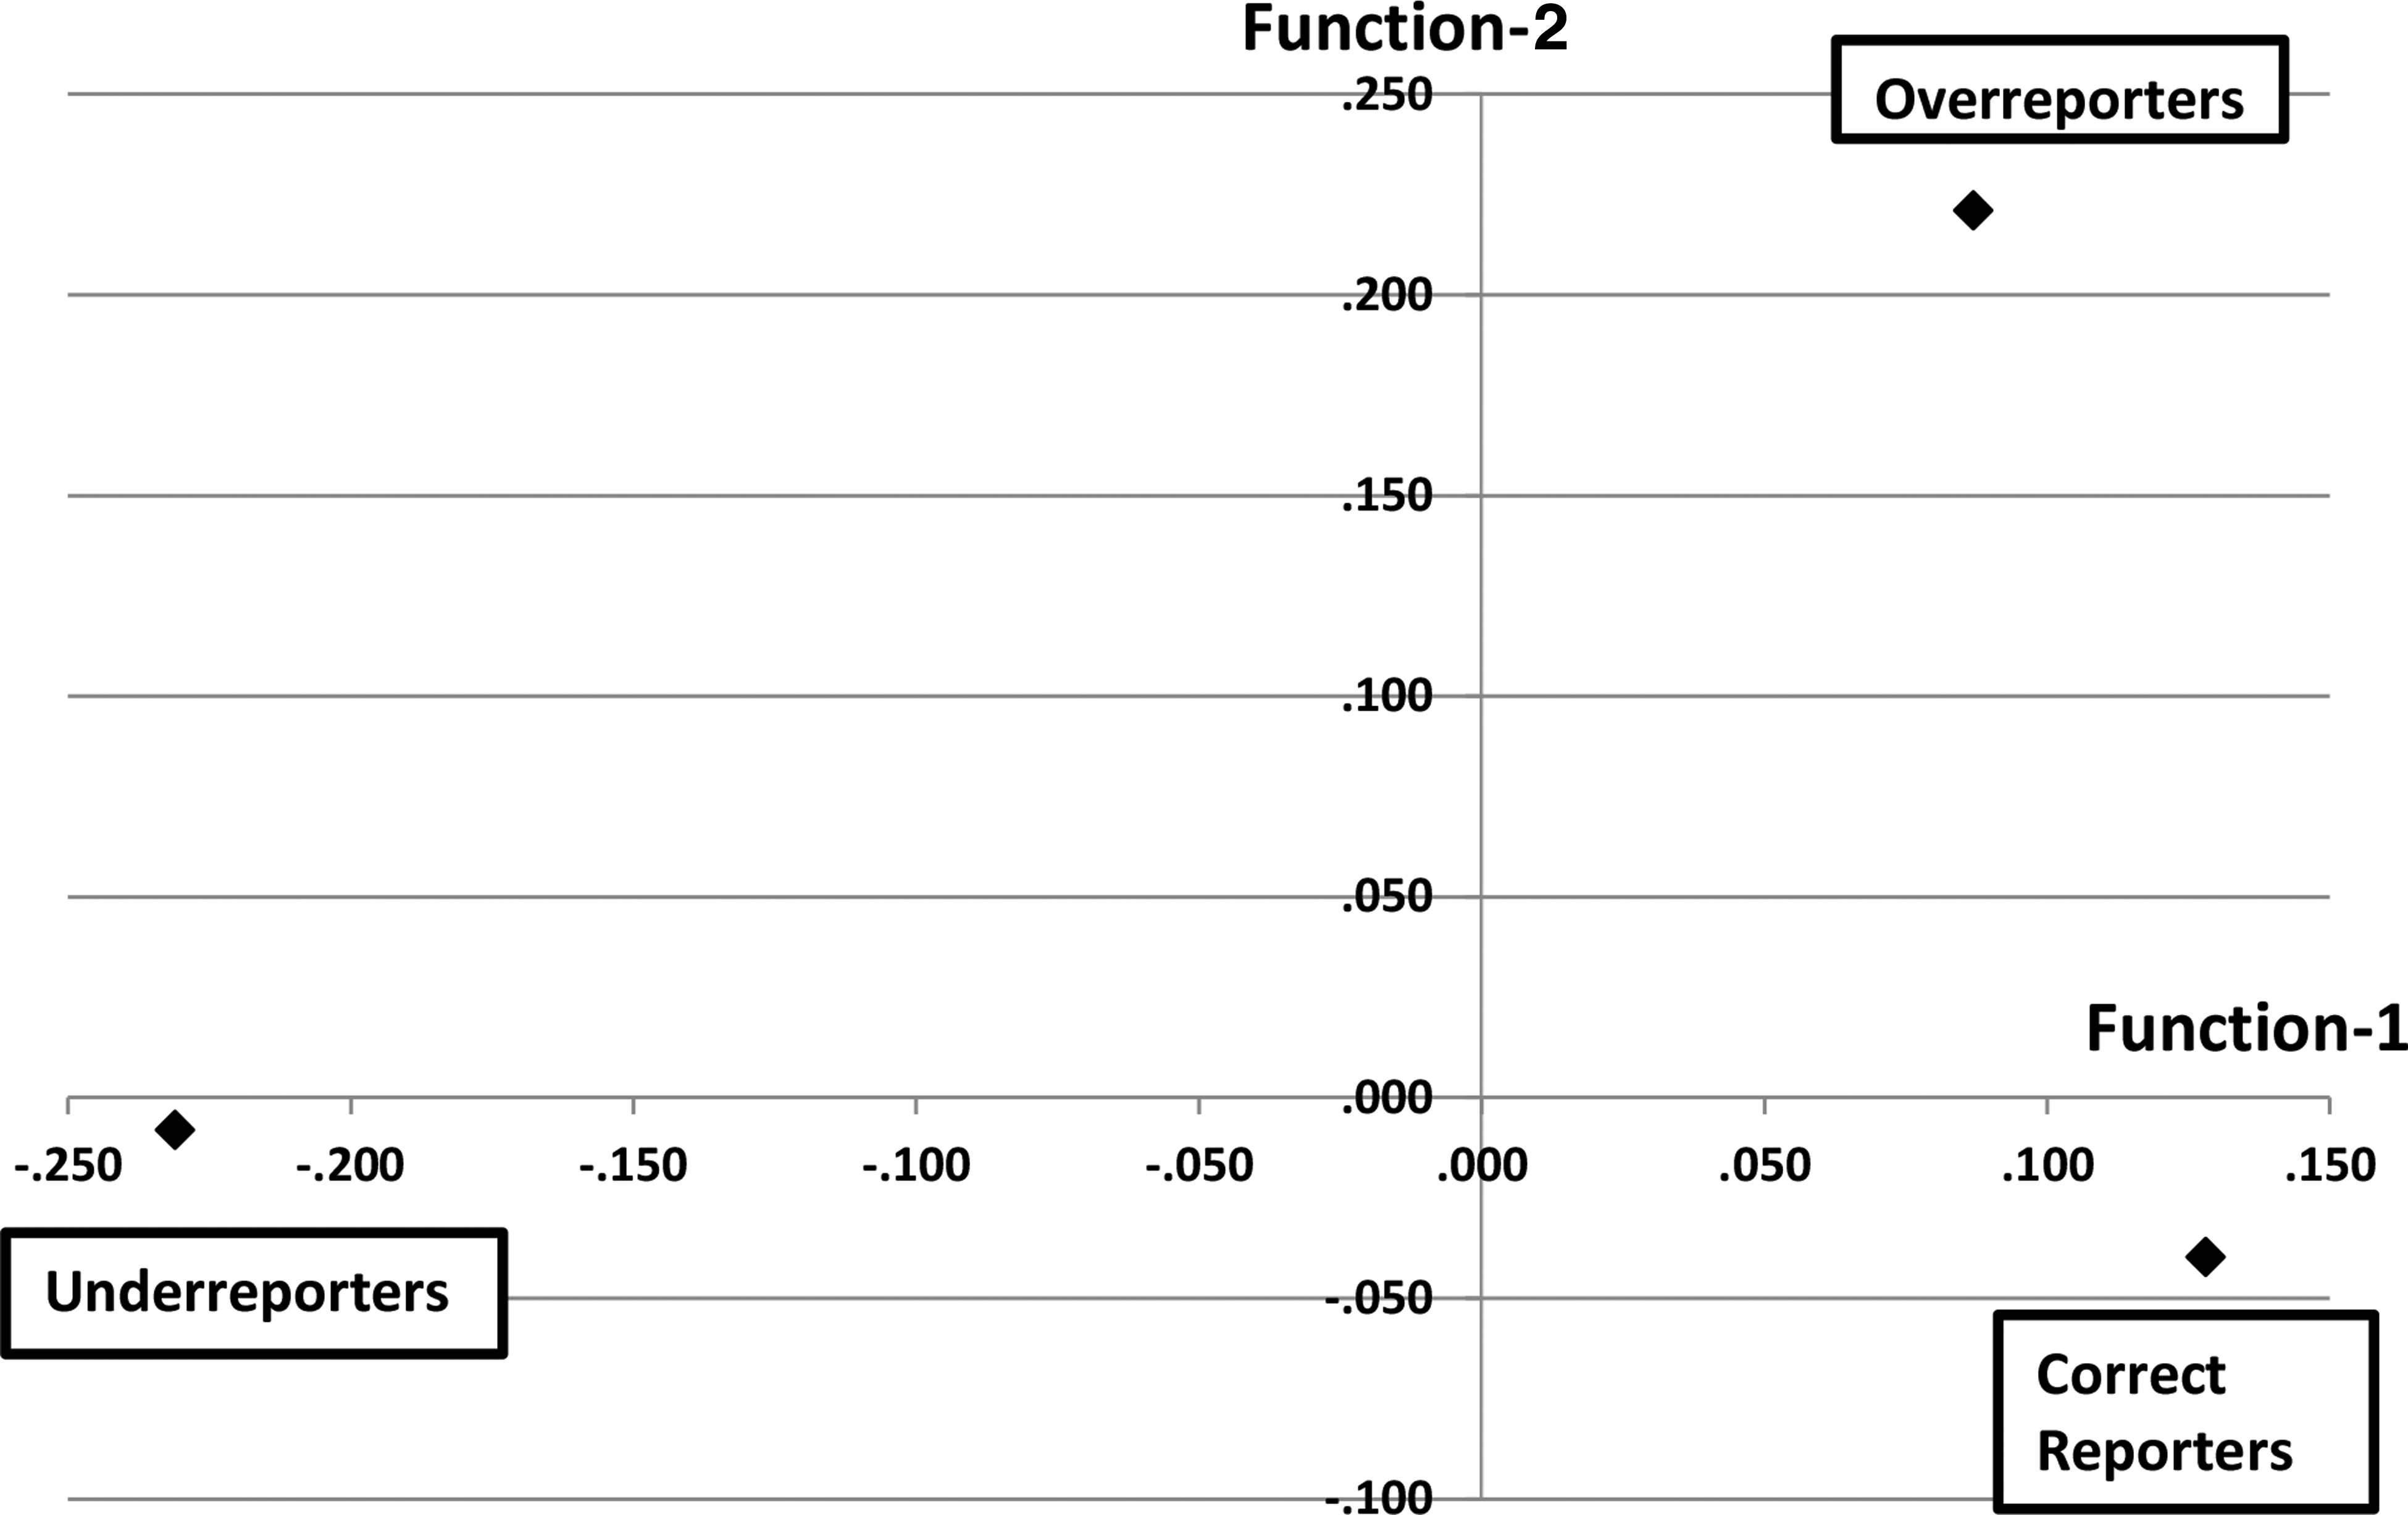
In discriminant function analysis, FVI, TVI, FFI, HWI, and UWI significantly contributed to separation of the OR, CR, and UR groups (p<0.001), although PAI did not. Therefore, PAI was removed from further analysis. HWI was positively correlated with UWI (r=0.301), and FFI was positively correlated with TVI (r=0.256), whereas other correlations were very weak (r<0.25). Two discriminant functions were identified: HWI (r=0.966) and UWI (r=0.470) were loaded on the first function, whereas TVI (r=0.772) and FFI (r=0.640) were loaded on the second function. Loadings of the FVI on either function were not sufficient (r=−0.266 and −0.232). In Figure 2, the first function (rc=0.165) maximally separated UR of BMI from the rest, whereas the second (rc=0.079) maximally separated OR of BMI from the rest. Loading of HWI and UWI on the first function suggested that healthy and unhealthy weight loss behaviors effectively separated UR from the rest. Similarly, loading of FFI and TVI on the second function suggested that fast food consumption and screen time separated OR from the rest.
In consideration of unadjusted group means, UR had more healthy weight loss behaviors (mean=7.56; standard deviation [SD]=1.80), compared to CR (mean=8.17; SD=1.78) and OR (mean=8.19; SD=1.74). Similarly, UR had more unhealthy weight loss behaviors (mean=10.20; SD=1.10) than CR (mean=10.39; SD=0.97) and OR (mean=10.25; SD=1.11). OR consumed more fast food (mean=16.80; SD=6.42) than CR (mean=15.86; SD=5.55) and UR (mean=15.89; SD=5.65). OR watched TV/video and used computers (mean=10.96; SD=4.06) more, compared to CR (mean=10.17; SD=3.79) and UR (mean=10.40; SD=3.82).
Using classification function coefficients, an equation was developed for each of the OR, CR, and UR groups to determine which group a given student should be assigned to, based on scores for his or her five behavioral indices (i.e., HWI, UWI, FFI, TVI, and FVI):
OR group: 0.888(HWI)+10.117(UWI)+0.635(FFI)+0.701(TVI)+0.388(FVI)–72.799
CR group: 0.881(HWI)+10.227(UWI)+0.616(FFI)+0.657(TVI)+0.393(FVI)–71.670
UR group: 0.704(HWI)+10.147(UWI)+0.617(FFI)+0.677(TVI)+0.396(FVI)–70.242
A given student should be assigned to the group for which he or she obtained the highest classification score. This classification function led to 55.0% correct classification based on behavioral discriminant variables, compared to 42.8% classified by chance alone (12.2% improvement). The stability of the classification procedure was checked by cross-validation in which 54.8% correct classification was revealed (12.0% improvement).
Misreporting by Demographic Category
Sequential logistic regression revealed that TVI (p<0.001), HWI (p<0.001), and UWI (p=0.001) were associated with BMI discrepancy. After adjusting for behavioral variables, sex was significantly associated with BMI discrepancy, whereas race and other demographic variables were not associated with it (Figs. 3 and 4). Females were more likely than males to have computed BMI correctly reported by an odds ratio of 1.229 (95% confidence interval=1.111–1.359), controlling for all other variables in the model. In the NOMREG procedure, sex remained significant even after compensation for inflated type 1 error by using a criterion of α=0.0055 (i.e., 0.05/9).

Discussion
This study examined the accuracy of self-reported weight and height in a large representative sample of US high school students and determined whether error in reporting was associated with food consumption patterns, physical activity, leisure behaviors, weight management techniques, weight category, and demographic factors. Consistent with past research, 4 height was frequently over-reported, weight was likely to be under-reported, and, consequently, calculated BMI was skewed. Underweight students under-reported height, over-reported weight, and, consequently, BMI, whereas overweight and obese students over-reported height and under-reported weight and BMI. Reporting in the healthy weight group was relatively accurate. Contrary to some studies that found no gender difference in misreporting, 12 being female was associated with correct reporting of BMI. However, contrary to some studies, age 13 and race/ethnicity3,6 were not associated with BMI misreporting. Nonsignificance of age as a discriminant variable indicated that self-reporting inaccuracies are not a result of low awareness resulting from younger age. Consistent with past findings, 3 weight loss behaviors (healthy or unhealthy) were associated with BMI under-reporting, whereas fast food consumption and longer screen time were associated with BMI over-reporting.14,15
Adolescents reporting they were very overweight had under-reported BMI, compared to adolescents reporting they were slightly overweight. 3 The present study also found a similar association. Although some studies found that dieting was not associated with reporting bias, 5 many others revealed that, compared to adolescents trying to gain weight, those trying to lose weight under-reported their weight and thus BMI. 3 The current study revealed that healthy weight loss behaviors (e.g., dieting and exercise) and unhealthy weight loss behaviors (e.g., smoking and induced vomiting) were associated with under-reporting of BMI. However, neither fruit and vegetable consumption nor physical activity and exercise in isolation were associated with under-reporting. Put differently, although weight loss intention was associated with under-reporting, healthy eating or physical activity in isolation were not associated with it.
The term cognitive dissonance is used to describe the feeling of discomfort that results from the discrepancy between two conflicting beliefs or attitudes. This discrepancy demands a change in one of the two beliefs or attitudes to reduce or eliminate the dissonance.15,16 Evidence from past research that found that some individuals reported their preferred rather than actual weight 16 probably reflects their attempt to reduce the dissonance state. Therefore, for such adolescents with higher BMI, inaccurate reporting may reflect body-image concerns.16,17 Further, overweight and obese adolescents who practice weight loss behaviors may perceive their body composition differently from those who were not engaged in such behaviors.
Although correlations between self-reported and measured height and weight supported some systematic bias, it was thought to be of little consequence, leading to the conclusion that self-reported data were accurate. 18 If this conclusion is not absolutely correct, the validity of overweight and obesity prevalence estimates becomes questionable (e.g., underestimating obesity prevalence). Therefore, in studies that rely on self-reported anthropometric data, taking a random representative subsample with measured data using a standard protocol is important for scrutinizing the direction and magnitude of potential biases. If obtaining measured data is impossible, it may be advisable to ask students to weigh themselves and measure their height before completing the survey to minimize unintentional misreporting. This is important because it is unclear how regularly adolescents measure weight and height; so, in some students, self-reported weight and height may just be a guess. 12 It has been demonstrated that individuals who under-report on one occasion are likely to do so again, which means repeated assessment will not help to overcome the under-reporting of overweight and obese statuses. 19
Subjective estimates of height and weight by adolescents may not be accurate for use in many studies, although they may be appropriate for large-scale prevalence studies. 2 Students who practice healthy or unhealthy weight loss behaviors are more likely to have under-reported BMI, whereas students who pay less attention to weight management, as indicated by fast food consumption and high screen time, are more likely to have over-reported BMI (Fig. 2). The reporting accuracy of BMI status was also associated with gender, which will be helpful to more accurately interpret findings of obesity surveys that are based on self-reported data.
Limitations
First, height in the current study was reported to the nearest inch, which is substantially a larger unit, compared to centimeter, therefore causing a higher round-off bias. As an example, a student who wanted to report his or her height as 5 feet 8.5 inches had no choice but to report it as 5 feet 8 inches or 5 feet 9 inches, creating a round-off error of up to 0.5 inches. Second, in the computation of over- and under-reporting of self-reported height and weight, the researchers assumed that the measured height and weight were always correct, although measurement also could have involved errors. Third, there is a possibility that students who inaccurately reported height, weight, and resultant BMI also reported behavioral information inaccurately, in which case current study findings are questionable. Finally, the NYPANS did not include items on eating disorders, such as bulimia nervosa, which, according to some research, were associated with more-accurate reporting of body weight, 20 compared to others. However, many studies found a similar pattern of misreporting among eating disorder patients, compared to others.21–23
Conclusion
Whenever possible, taking objective height and weight measurements is very important. However, because many studies have to rely on self-reported values alone, more research should examine the relationships between misreport of anthropometric data and lifestyle features in diverse adolescent samples to better interpret self-reported anthropometric data as well as self-reported attitudes and behaviors. Investigators who examine self-reported height, weight, and BMI of students must be aware that students' attitudes and behaviors convey important information that may be associated with the likelihood of misreporting.
Footnotes
Author Disclosure Statement
No competing financial interests exist.