
Abstract
Abstract
Background:
National WIC (the Special Supplemental Nutrition Program for Women, Infants, and Children) data indicate a decrease in obesity prevalence among most low-income preschool-aged children. Though racial/ethnic disparities exist, studies examining obesity trends among various racial/ethnic groups are lacking. The aims of this study were to identify racial/ethnic disparities in obesity among low-income preschool children in Oklahoma and describe trends in obesity prevalence among four major racial/ethnic groups.
Methods:
Subjects included 218,486 children 2–4 years of age who participated in WIC in Oklahoma from 2005 to 2010. Logistic regression was performed to identify disparities and trends in obesity among American Indian, Hispanic, White, and African American children.
Results:
Racial/ethnic disparities in obesity were evident, with prevalence highest in Hispanics and lowest in African Americans. Obesity increased among girls for all racial/ethnic groups from 2005 to 2010 (odds ratio [OR], 1.02; 95% confidence interval [CI], 1.01, 1.03). Among boys, obesity increased in African Americans (OR, 1.04; 95% CI, 1.01, 1.07), but remained stable in other racial/ethnic groups.
Conclusions:
In Oklahoma, in contrast to recent national studies, obesity is increasing among certain groups of low-income preschool children. These findings suggest geographic diversity in obesity and that state-specific obesity surveillance is important to help target interventions to those at highest risk.
Introduction
According to data from the National Health and Nutrition Examination Survey (NHANES), 12% of US children 2–5 years of age were obese in 2010, more than double the 5% of three decades ago. 1 Early onset of obesity is associated with numerous health problems and leads to poor health outcomes throughout the lifespan.2–4 Treatment of obesity in early childhood may be more effective than intervention at later ages; therefore, greater emphasis is being placed on obesity surveillance and prevention programs in preschool-aged children.5,6
Although obesity in preschool-aged children rapidly increased from the 1980s to late 1990s,7–13 recent studies indicate a stabilization in obesity prevalence among this group of children and even a decline in some states.14–16 NHANES has also shown a decrease in obesity among children 2–5 years of age from 12.1% in 2009–2010 to 8.4% in 2011–2012. 17 This leveling off in obesity prevalence appears to hold true even for those at highest risk: low-income and minority children. Data from the Pediatric Nutrition Surveillance System (PedNSS), which collects nutrition information nationally on children from birth to 5 years of age who participate in federally funded programs (primarily WIC [the Special Supplemental Nutrition Program for Women, Infants, and Children]), showed that obesity declined among low-income preschoolers in 19 of 43 states and territories during 2008–2011. 18 Though trends in obesity prevalence seem to be stabilizing, even among low-income children, the prevalence of obesity remains higher among certain racial/ethnic groups.19–22
NHANES reports that non-Hispanic black and Hispanic preschool-aged children have the highest prevalence of obesity (18.9% and 16.2%, respectively), whereas prevalence among non-Hispanic white children is 9.2%. 1 Both NHANES and PedNSS have suggested that disparities in obesity have been increasing, when comparing minority children to non-Hispanic white children, over the last decade. NHANES reported increases in obesity for non-Hispanic black males from 1999 to 2010; PedNSS reported increasing obesity prevalence in American Indian children from 2003 to 2008, whereas prevalence of obesity in all other racial/ethnic groups was stable during this same period.1,23
Disparities in obesity prevalence in American Indian children raise significant concern for Oklahoma, whose population has the second-highest number and proportion (11%) of American Indians in the United States. 24 To date, there are sparse data on obesity prevalence and trends in American Indian preschool children. The aim of this study was to examine racial/ethnic disparities and trends over time in obesity among low-income preschool-aged children, including American Indians, using population-based data.
Methods
Source of Data
The Oklahoma WIC program is the only state-wide source of measured data on height and weight for low-income preschool-aged children. Data are collected from WIC clinics in 75 of 77 Oklahoma counties. Oklahoma WIC data are not available in national reports; Oklahoma is one of four states that do not report their information to PedNSS.
Families with children under 5 years of age are eligible for WIC if their income does not exceed 185% of the Health and Human Services federal poverty income guidelines or if they are enrolled in other state-administered financial assistance programs, such as Medicaid, Supplemental Nutrition Assistance Program, or Temporary Assistance for Needy Families (TANF). 25 On average, 72,000 Oklahoma children participate in the program each year (personal communication, Oklahoma WIC Program, 2014). This population, representing 20% of preschool-aged children in Oklahoma, presents an opportunity to evaluate obesity prevalence and racial/ethnic disparities in a large, ethnically diverse, and economically disadvantaged population.
Study Design
Oklahoma WIC provided records on 294,730 children 12–59 months of age who were enrolled in their program from 2005 to 2010. Because BMI categories are defined beginning at 2 years of age, the study population was restricted to those 24–59 months of age. The Oklahoma WIC data files included date of birth, date of visit, sex, height, weight, race, and ethnicity. If more than one record for a child was available in a given calendar year, only the first record of that year was analyzed. Height (in inches) and weight (in pounds) were directly measured by trained staff according to standard protocols.
Age (in months) was calculated from date of birth and date of visit and grouped into three categories: 24–35, 36–47, and 48–59 months in accord with the age categories in PedNSS data. 26 Recorded measures of weight and height were converted to kilograms and meters for BMI calculation. Age- and sex-specific BMI z-scores and BMI percentiles were computed using a SAS program provided by the CDC based on the 2000 CDC growth charts for US children. 27 BMI percentiles were coded into four categories consistent with current definitions: underweight (BMI <5th percentile); normal weight (BMI ≥5th and <85th percentiles); overweight (BMI ≥85th and <95th percentiles); and obese (BMI ≥95th percentile). 28
Race and ethnicity were based on parent responses from a standard WIC questionnaire. Parents reported ethnicity as either Hispanic or non-Hispanic. Parents described the race of their child by choosing from one or more of five race categories: African American; American Indian/Alaskan Native; Asian; Native Hawaiian/Pacific Islander; and white. Race and ethnicity responses were recoded into a single variable. If the parent reported Hispanic ethnicity, then race/ethnicity was coded as Hispanic regardless of the child's race designation. If the parent did not report Hispanic ethnicity, the child's race/ethnicity was coded based on the parent's report of race. Children with only one reported race were coded accordingly. Children whose records contained more than one racial category without report of Hispanic ethnicity were coded as non-Hispanic multiracial. The recoded racial/ethnic categories included Hispanic, non-Hispanic white (white), non-Hispanic African American (African American), non-Hispanic American Indian/Alaskan Native (American Indian), non-Hispanic Asian (Asian), non-Hispanic Pacific Islander (Pacific Islander), and non-Hispanic multi-racial (multi-racial). Because of their small numbers, Asians (n=2185) and Pacific Islanders (n=771) were not included in racial/ethnic-specific analyses. The multi-racial group (n=11,456) was also excluded from analyses focused on race/ethnicity because of the diversity of children represented in this group.
Of the 220,191 total records available on children 24–59 months of age, two were excluded because they had no data on race/ethnicity. Another 1703 records (less than 1% of total records) were excluded because their BMI z-scores were considered biologically implausible (less than −4 or greater than 5) based on CDC criteria. 27
Because the study involved the use of secondary and deidentified data, it was judged to not be human research and was exempt from review by the University of Oklahoma Institutional Review Board (Oklahoma City, OK).
Statistical Analysis
Descriptive statistics summarized the demographic characteristics of the 2- to 4-year-old children enrolled in the Oklahoma WIC program from 2005 to 2010. Prevalence of obesity by sex, age, and race/ethnicity was determined for each calendar year.
Multivariable logistic regression was performed to analyze the odds of obesity. To examine differences in obesity among the four largest racial/ethnic groups, interactions were first explored among sex, age, and racial/ethnic groups. Interactions were detected between sex and race/ethnicity and between sex and age; therefore, analyses were subsequently stratified by sex. To estimate obesity trends over the 6-year period, the sex-specific regression models included year as a continuous independent variable. Given our interest in examining racial/ethnic disparities in obesity trends, the sex-specific models included interaction terms that combined race/ethnicity and year. Age group was included in all regression models because obesity prevalence differs by age. Interactions were considered significant if p<0.1. Other comparisons were considered statistically significant if p<0.05 and the 95% confidence interval (CI) for the odds ratio (OR) excluded 1.0.
Among boys, an interaction was detected between race/ethnicity and year; therefore, results are reported from race/ethnic-specific models to identify obesity disparities over time, adjusted for age group. For girls, no interactions were found; therefore, race/ethnic specific trends were not estimated. Instead, the odds of obesity are reported, adjusting for age group, race/ethnicity, and year to describe obesity trends and disparities among all girls.
To fully describe racial/ethnic disparities in both the odds of obesity and trends in those odds over time, year-specific models for both boys and girls were also constructed. Data analysis was conducted using SAS statistical software (version 9.2; SAS Institute Inc., Cary, NC).
Results
Sample Characteristics
The initial study population consisted of 220,191 Oklahoma WIC children 2–4 years of age. After excluding children with missing and biologically implausible data, the final study population consisted of the remaining 218,486 participants. Over the years studied, the Oklahoma WIC population increased from 35,424 in 2005 to 40,121 in 2010. Hispanics and the multi-racial group had the highest percent increase in their populations over the study period.
The age, sex, and racial/ethnic composition of study participants is shown in Table 1. Male children comprised 51% of the study population over the 6-year study period. Across all 6 years, the racial/ethnic distribution included 48.5% white children, 28.7% Hispanics, 11.8% African Americans, and 4.4% American Indians. More Hispanic and African American children were enrolled in the Oklahoma WIC, when compared to the general population (28.7% vs. 16.7% and 11.8% vs. 7.9%, respectively), whereas American Indian and white children were under-represented (4.4% vs. 10.2% and 48.5% vs. 53.2%). 29
Oklahoma WIC Study Population, 2005–2010
Age was calculated from the study participant's date of birth and the date of their first Special Supplemental Nutrition Program for Women, Infants, and Children (WIC) clinic visit for each calendar year.
Race and ethnicity were reported separately by the parent. We combined parental responses on race and ethnicity, creating seven racial/ethnic categories similar to the racial/ethnic groups reported in the Pediatric Nutrition Surveillance System (PedNSS).
Trends in Obesity
Table 2 shows the prevalence of obesity (in percent) for the Oklahoma WIC study population by sex, age, and race/ethnicity for each calendar year.
Obesity Prevalence and Annual Trend in Obesity from 2005 to 2010 among Oklahoma WIC Study Participants
The ORs for year, which represent the change in obesity between successive years for boys, were calculated from sex- and race/ethnic-specific logistic regression analyses that modeled obesity on year (continuous) while adjusting for age group.
In boys, the OR for year associated with change in obesity between successive years for all race/ethnic groups was not reported because of an interaction between race/ethnic group and year (p=0.09)
In girls, the ORs for year in race/ethnic-specific models were not estimated because no interaction occurred between race/ethnic group and year. Instead, we report the overall OR for year across all race/ethnic groups (see footnote below).
The OR for year, which represents the change in obesity between successive years for girls of all race/ethnic groups, was calculated from a sex-specific logistic regression analysis that modeled obesity on year (continuous) while adjusting for age group and race/ethnic group.
OR, odds ratio; CI, confidence interval.
For girls, obesity prevalence increased over the years from 12.0% obese in 2005 to 13.6% in 2010 (Table 2). Logistic regression estimated a consistent increase in obesity each year for all racial/ethnic groups (annual OR, 1.02; 95% CI, 1.01–1.03). Though the trend increased for all girls, disparities in obesity prevalence were detected among the racial/ethnic groups. Hispanic girls had the highest prevalence of obesity, ranging from 16.6% to 17.2% from 2005 to 2010, and the odds of obesity among Hispanic girls, in any given year, were 1.68 times those of white girls (95% CI, 1.62–1.75; Table 3). American Indian girls also had higher odds of obesity than white girls (OR, 1.47; 95% CI, 1.35–1.59) throughout the study period. However, the odds of obesity among African American girls, in any given year, were only 0.91 times those of whites (95% CI, 0.85–0.97).
Odds Ratios (ORs) of Obesity by Race/Ethnicity and Sex among Oklahoma WIC Study Participants, 2005–2010
Because of an interaction between year and race/ethnicity, we report ORs of obesity for boys for each year. ORs were calculated from sex- and year-specific logistic regression analyses, adjusting for race/ethnicity and age group.
ORs of obesity for girls were calculated from a sex-specific logistic regression analysis, adjusting for age, race/ethnicity, and year (continuous).
OR, odds ratio; CI, confidence interval.
Among boys, an interaction between race/ethnicity and year (p=0.09) indicated that trends over time in obesity prevalence differed among these groups (Fig. 1). Race/ethnic specific regression models were performed, adjusting for age. African Americans showed a significant annual increase in the odds of obesity (adjusted annual OR, 1.04; 95% CI, 1.01–1.07), whereas other racial/ethnic groups did not (Table 2). Although obesity prevalence increased among African American boys (10.1% in 2005 to 11.8% in 2010), year-specific models examining obesity, adjusted for race/ethnicity and age, showed that African Americans had significantly lower odds of obesity than whites from 2005 to 2007. By 2008, however, their odds of obesity were similar to white boys (Table 3). In contrast, Hispanic and American Indian boys had consistently higher odds of obesity than whites across all years studied.
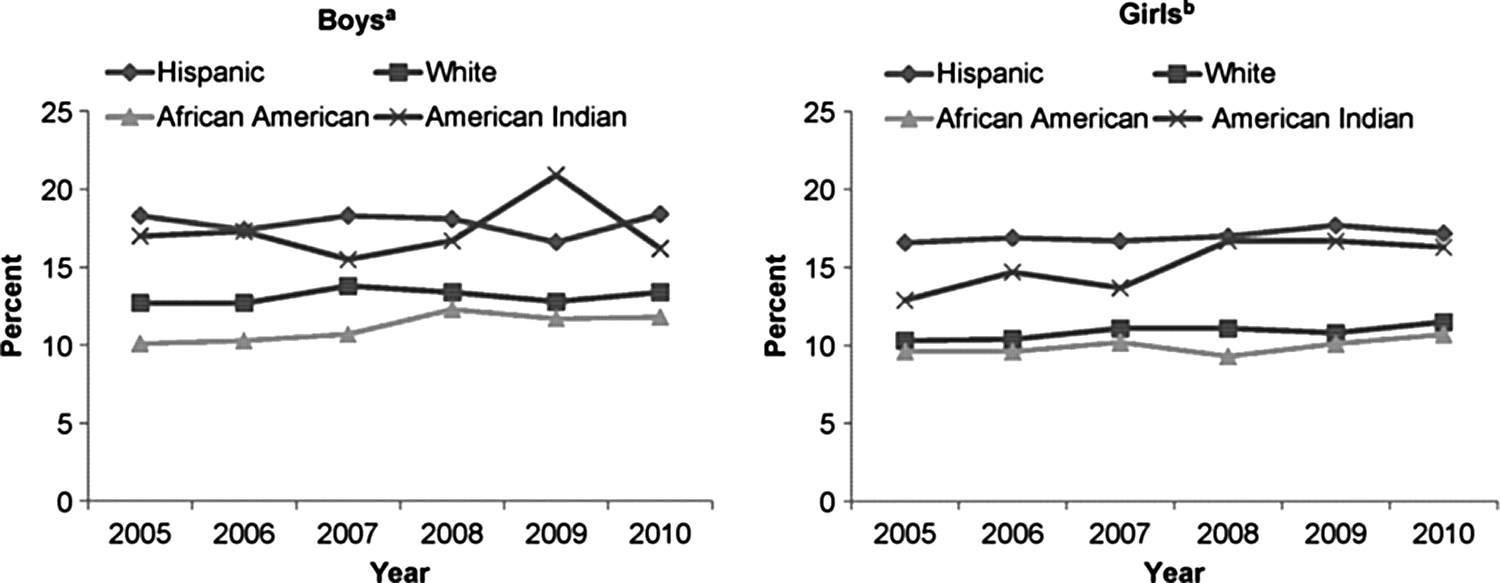
Obesity by race/ethnicity for boys and girls among the WIC (the Special Supplemental Nutrition Program for Women, Infants, and Children) study population, 2005–2010. aAfrican Americans had a significant increase in obesity prevalence over time, whereas other racial/ethnic groups did not. bNo significant differences in obesity prevalence over time between racial/ethnic groups; all girls had an increase in obesity prevalence over time.
Discussion
This study describes racial/ethnic disparities in the prevalence of obesity, and in obesity trends, among preschool-aged children participating in the Oklahoma WIC program. Although specific to Oklahoma, these data are consistent with overall national WIC obesity estimates (14.3% in Oklahoma vs. 14.4% in PedNSS in 2010). 30 This study is one of few that report obesity prevalence in American Indian children from measured height and weight and, to our knowledge, is the only state-specific study to report obesity trends in low-income American Indian preschool children.
Significant racial/ethnic differences among children enrolled in the Oklahoma WIC throughout the study period were similar to those reported previously for 2009. 31 Among both boys and girls, Hispanics and American Indians had significantly higher odds of obesity than white children throughout the study period. Hispanic children had the highest obesity prevalence, across all years. This finding contrasts with data from PedNSS, which show that obesity was highest among American Indian children from 2005 to 2010.23,30 This inconsistency may be explained if obesity prevalence among Oklahoma American Indian children is lower in those who participate in the state WIC program than those enrolled in tribal WIC programs, which do not report their data to the state WIC program. Eligible American Indian children may participate in either the state or their tribal-specific WIC program; the proportion of American Indians enrolled in the nine tribal WIC programs, compared to the state WIC program, is unknown.
This study's findings that African Americans had the lowest prevalence of obesity for both boys and girls is consistent with PedNSS data, 30 but differs from that of NHANES. 1 For example, in this study, for 2010, 11.8% of African American boys and 10.7% of African American girls were obese, compared to 13.4% obese white boys and 11.5% obese white girls. For 2009–2010, NHANES reports that 20.5% of non-Hispanic black boys and 17% of non-Hispanic black girls 2–5 years of age were obese, compared to 11.9% and 6% of obese white boys and girls, respectively. 1 In addition, this study showed that African American girls have the lowest odds of obesity among the four racial/ethnic groups throughout the years studied, whereas odds of obesity among African American boys did not differ from white boys in the most recent years of the study. In contrast, NHANES reports a higher odds of obesity for both non-Hispanic black boys (OR, 1.27; 95% CI, 1.09–1.48) and girls (OR, 1.99; 95% CI, 1.69–2.35), compared to white girls and boys. 1 NHANES data represent a nationally representative sample of preschool children whose socioeconomic status may differ from that of Oklahoma WIC participants, which may explain these differences. State-specific studies of low-income preschool children, however, also report high obesity prevalence in African American children, indicating that regional variations exist in race-specific obesity prevalence.16,32
In regard to obesity trends, an increase in obesity occurred in girls for all racial/ethnic groups. Among boys, a significant trend toward increasing obesity was identified only for African American boys. NHANES also reports an increase in obesity prevalence among African American males ages 2–19 years from 1999 to 2010, with an annual increase in the odds of obesity prevalence of 1.05 (95% CI, 1.02–1.08). 1 No other racial/ethnic group showed a trend in change in obesity prevalence over the years examined.
Obesity trends among low-income children in this study differ from those reported in a 2009 study from PedNSS, which showed that obesity remained stable among all racial/ethnic groups from 2003 to 2008, except among American Indian children, whose rates continued to climb. 23 Though obesity prevalence in American Indian girls increased over the years in this study, obesity rates also increased for all racial/ethnic groups. Among American Indian boys, no significant increase in obesity prevalence occurred. This discrepancy may be because of lower numbers of American Indians in this study, compared to PedNSS, resulting in less-precise estimates for obesity trend, or differences in obesity among different tribes and study time frame.
State-specific studies on low-income preschool children have reported a recent plateau or decline in obesity prevalence. Harbaugh and colleagues showed no significant change in obesity between 2005 and 2010 in Head Start programs in Mississippi 14 ; Sekhobo and colleagues report a decline in obesity from 2002 to 2007 among Hispanic and Black children in the New York WIC program 15 ; and Wen and colleagues report obesity prevalence declined for all preschool children participating in a Massachusetts health maintenance organization (HMO) from 2004 to 2008, including those on Medicaid. 16 None of these studies report significant changes over time in obesity prevalence between racial/ethnic groups. Our findings, however, suggest that obesity prevalence is increasing among all races/ethnicities of girls and in African American boys in Oklahoma WIC. Though differences in sample sizes and years studied may partially explain the differences in these studies' findings, the different results likely indicate variations in state-specific obesity prevalences and trends. For example, Singh and colleagues report a significant increase in obesity prevalence among school-aged girls in Oklahoma from 2003 to 2007, whereas other states showed significant declines in obesity prevalence during this same time frame. 33
Differences in obesity trends between preschool girls and boys in Oklahoma WIC may be a result of individuals' obesity-related lifestyles, such as differences in screen time and physical activity. For example, the 2007 National Survey of Children's Health Study reported that 21% of preschool-aged girls watched 4 or more hours of television daily, compared to 16.6% of preschool-aged boys. 34 No state-wide information is available on racial-specific behaviors that may contribute to obesity and account for differences in obesity among racial/ethnic groups. Further research is needed to identify obesigenic behaviors in preschool-aged children in high-risk populations.
The Oklahoma WIC data have limitations. WIC data were collected routinely from participants in a federally funded program serving low-income children and, therefore, are not necessarily representative of all low-income children in Oklahoma. Specifically, these data do not include American Indians participating in tribal WIC programs and, therefore, do not represent all American Indian children in Oklahoma. In addition, data were collected in a standardized, but not rigorously controlled, manner; however, the reliability of anthropometric measurements in a subset of WIC programs has been established, indicating that height and weight measurements collected by trained WIC staff are sufficiently accurate for monitoring and research purposes. 35
The accuracy of the reported trends from these WIC data were possibly affected by demographic changes among Oklahoma's WIC participants during the study period. The Oklahoma WIC population increased from 35,424 in 2005 to 40,121 in 2010, likely as a result of the economic downturn that began in 2008. Though male-to-female proportions over the years were similar, the distribution of racial/ethnic groups changed, most notably with an increase in Hispanic participants between 2005 and 2010. An influx of previously higher-income and potentially normal weight Hispanic children into the WIC population may confound between race comparisons; however, Ogden and colleagues report that obesity is not associated with income among Hispanic children. 36
Conclusions
These findings shed the first light on obesity trends and racial/ethnic disparities among low-income preschool children in Oklahoma. We show an increase in obesity among all girls and among African American boys participating in Oklahoma WIC from 2005 to 2010, indicating the importance of both sex- and race/ethnic-specific evaluation of obesity trends. These findings highlight two important points: Racial/ethnic disparities in obesity are complex and are already prevalent at very young ages. They also emphasize the need for both targeted and population-based approaches to obesity prevention, as the Institute of Medicine recommends. 6 State-specific obesity surveillance is important in gauging the success of the implementation of the recommendations, especially among young disadvantaged and minority children.
Footnotes
Acknowledgment
The authors thank Carrie Zeman for her collaboration, providing the data, and technical support.
Author Disclosure Statement
No competing financial interests exist.