
Abstract
Abstract
Background:
Publicly funded recreation and sports facilities provide children with access to affordable physical activities, although they often have unhealthy food environments that may increase child obesity risk. This study evaluated the impact of a capacity-building intervention (Healthy Food and Beverage Sales; HFBS) on organizational capacity for providing healthy food environments, health of vending machine products, and food policy development in recreation and sport facilities in British Columbia, Canada.
Methods:
Twenty-one HFBS communities received training, resources, and technical support to improve their food environment over 8 months in 2009–2010, whereas 23 comparison communities did not. Communities self-reported organizational capacity, food policies, and audited vending machine products at baseline and follow-up. Repeated-measures analysis of variance evaluated intervention impact.
Results:
Intervention and comparison communities reported higher organizational capacity at follow-up; however, improvements were greater in HFBS communities (p<0.001). Healthy vending products increased from 11% to 15% (p<0.05), whereas unhealthy products declined from 56% to 46% (p<0.05) in HFBS communities, with no changes in comparison communities. At baseline 10% of HFBS communities reported having a healthy food policy, whereas 48% reported one at follow-up. No comparison communities had food policies.
Conclusions:
This is the first large, controlled study to examine the impact of an intervention to improve recreation and sport facility food environments. HFBS communities increased their self-rated capacity to provide healthy foods, healthy vending product offerings, and food policies to a greater extent than comparison communities. Recreation and sport settings are a priority setting for supporting healthy dietary behaviors among children.
Introduction
Food environments can promote both unhealthy and healthy dietary behaviors and body weights by providing, or, alternatively, by limiting, children's access to energy-dense, nutrient-poor foods.1,2 Consequently, governments worldwide have initiated action to improve food environments within their respective jurisdictions. Although understanding of how to improve food environments is growing, particularly in school settings, 3 there are many community settings where the evidence is limited. There is a need for community-based interventions to inform productive action in these contexts.
Publicly funded recreation and sports facilities provide access to a variety of affordable physical activities and are a gathering place for community members for meetings and events. Their substantive contact with children and families makes these facilities an ideal venue for promotion of health and wellness among children.4–7 However, despite their health mandate,8,9 many have unhealthy food environments that may paradoxically increase children's obesity risk.10–16 Some recreation stakeholders are willing to improve the quality of their food environments; however, barriers, including the provisions of foodservice contracts, fears of reduced profitability, and lack of resources and knowledge, limit their opportunities for change.11,12,15,17
To improve the quality of community food environments, the provincial government of British Columbia (BC), Canada, developed nutrition guidelines for food sales in public buildings, including recreation and sports facilities. 18 At the time of the study, these voluntary guidelines stipulated that at least half of available vending products should be from the healthiest “choose most” (i.e., nutrient-dense foods with little to no added fat, sugar, and salt) category, up to half from “choose sometimes” (i.e., foods that contain important nutrients, but that are higher in fat, sugar, and/or salt), and none from the least healthy “choose least” and “not recommended” (i.e., foods with little nutritive value) categories. 18 Further details about the food classification system can be found at: www.health.gov.bc.ca/healthyeating/vending.html.
To support guideline implementation, the BC Healthy Living Alliance, under the leadership of the British Columbia Parks and Recreation Association (BCRPA), developed the Healthy Food and Beverage Sales in Recreation Facilities and Local Government Buildings (HFBS) initiative.19,20 The HFBS initiative has been described in detail previously 12 and was a capacity-building intervention to: (1) support voluntary implementation of the vending guidelines and 2) encourage healthy food and beverage options across all areas of recreation operations (Fig. 1).
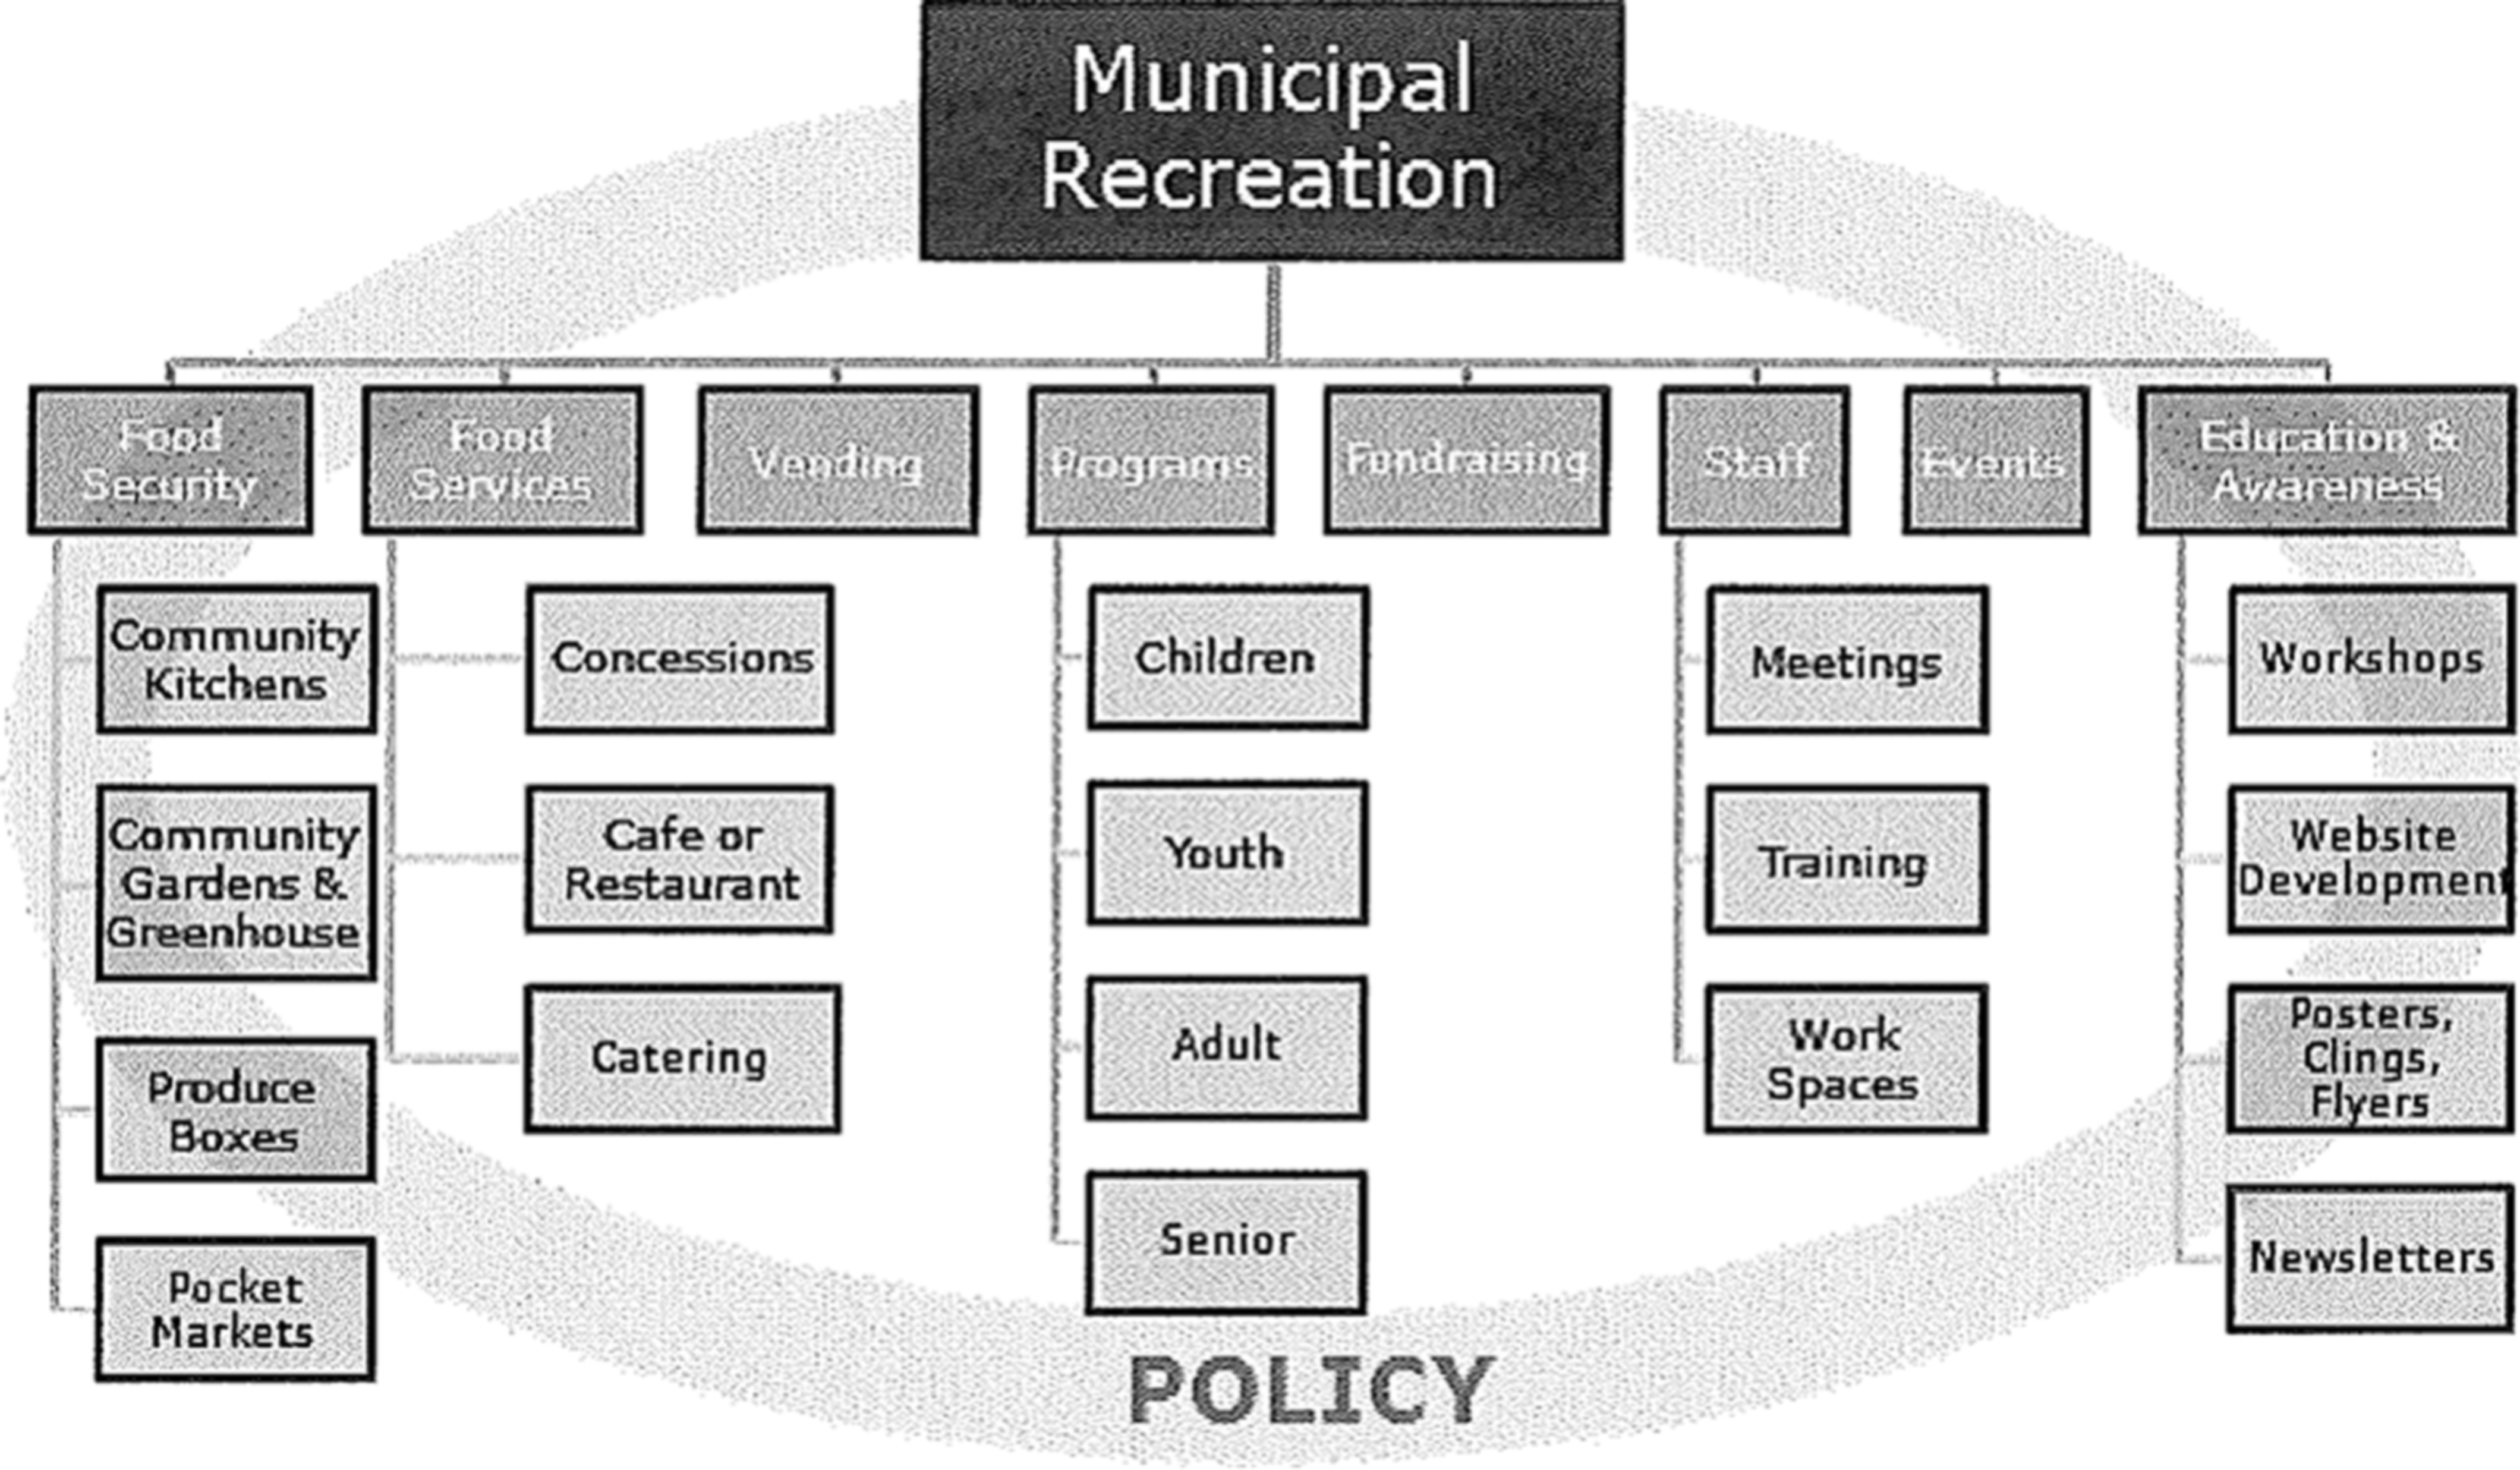
Operational areas within municipal recreation facilities where opportunities for healthy food and beverage policy, provision, and promotion are present. Adapted from Naylor and colleagues. 11 Copyright by the International Journal of Environmental Research and Public Health. Reprinted with permission.
As part of the HFBS initiative, communities in BC were invited to apply for grants to support change within their local recreation and sport facilities. A pilot study in the first 10 grant communities (phase I) showed that when adequate buy-in, organizational readiness, and supports for implementation were in place, modest, but significant, improvements in facility food policies, practices, availability of healthier foods, and patron awareness of healthy eating promotions could be achieved. 12 Subsequent to this, three additional grant/intervention phases of the HFBS initiative were funded. This “natural experiment” provided the opportunity to conduct a comparison trial and advance the evidence base for action in this setting. Thus, the aim of this study was to evaluate the impact of the HFBS intervention on the food environment in recreation and sport facilities that received funding and support to implement the intervention during the second and third grant phases, compared to facilities that did not. Specifically, we examined the impact of the HFBS on: (1) organizational capacity for providing a health-promoting food environment; (2) vending products offered for sale; and (3) food policy development.
Methods
Study Design
We used a quasi-experimental, controlled, pre-post comparison design to assess the impact of the HFBS initiative over an 8-month period. Given that this was a natural experiment, intervention communities had applied for grant funding from the BC Healthy Living Alliance, and the research team, in conjunction with the BCRPA, recruited volunteer facilities in comparable communities to act as “usual practice” comparison sites. Recruitment occurred by website and newsletter advertisements and targeted e-mails. This study received ethical approval from the University of Victoria Human Research Ethics Board and adhered to the ethical standards of the Helsinki Declaration. Participants provided written informed consent to provide data for the study.
Participants
All 21 communities, representing 71 recreation and sport facilities that received funding in phase II and III of the HFBS initiative, participated in the study. Twenty-three communities (n=35 recreation and sport facilities) of 66 that were not currently participating, and had not previously participated, in the HFBS initiative served as a comparison group.
HFBS grant and comparison groups were similar in size (Table 1) and represented communities from the province's five major health regions, with a mix of small/rural and large/urban communities. A variety of types of recreation and sports facilities participated within each community, including ice arenas, curling rinks, pools, fitness gyms, outdoor sporting facilities, and multiplexes that housed several of these within a single facility.
Communities that Participated in the Healthy Food and Beverage Sales Initiative by Population Size
Population centers were defined according to Statistics Canada standards (www.statcan.gc.ca/subjects-sujets/standard-norme/sgc-cgt/notice-avis/sgc-cgt-06-eng.htm). The Healthy Food and Beverage Sales initiative comparison trial took place in recreational and sport facilities in communities in British Columbia, Canada, from February 2009 to March 2010.
Intervention
As detailed in Naylor and colleagues 12 and described below, the HFBS was a capacity-building initiative. HFBS communities received a grant ($7,500 CDN) and were provided with a framework for action (Fig. 1), training, resources (written and electronic), and ongoing technical support to develop and implement individualized action plans to improve the food environment in their recreation and sports facilities. As part of capacity building, designated representatives from HFBS communities (typically recreation facility staff or regional managers) also attended an orientation/training session that provided: (1) an introduction to the HFBS model; (2) a lesson on the use of the study's self-assessment tools (i.e., Facility Assessment Questionnaire [FAQ] and four-step vending audit); (3) resources and information related to goal setting, as well as developing policies and requests for proposals/contracts; (4) templates for presentations to stakeholders; (5) marketing materials; and (6) examples of what had been done in other communities to improve the food environment in their recreation and sports facilities. Communities could also access these and other resources on the HFBS website. 21
Subsequent to baseline data collection, communities developed individualized action plans to improve the food environment within their local recreation and sports facilities. Communities were specifically asked to address provision of healthier items in vending machines, concessions, and children's programs. Communities then implemented these plans over an 8-month time frame between February 2009 and March 2010. Some communities chose a target facility and others made changes across a number of facilities.
Technical support and individual consultations were provided to all communities according to their needs (from the project team and a provincially funded telephone support service). 22 A minimum of two phone calls per community were made to discuss progress and ongoing activities, with additional consultations as needed. Comparison communities did not participate in the HFBS program or receive training or technical support. These communities were provided with funds to support evaluation activities, but were asked to maintain their usual practices until follow-up.
Measurement Instruments
Designated recreation managers or facility staff in all 21 intervention communities completed all aspects of the data collection. A total of 17 comparison communities (74%) completed all evaluation components, with six having vending audits only. Baseline assessment was completed within 1 month of the initial HFBS orientation for intervention communities and a follow-up assessment approximately 8 months later. Three measurement instruments were used at both time points to assess: (1) organizational capacity for providing a health-promoting food environment; (2) the health of vending machine products for sale; and (3) healthy food and beverage policy development.
Organizational Capacity
Organizational capacity to support provision and promotion of healthy foods was evaluated using an FAQ adapted from two existing tools and used in a previous study. 12 The questionnaire contained 19 statements about food-related activities across three categories: strategic planning; supportive environments; and communication and education (Supplementary File 1) (see online supplementary material at http://www.liebertpub.com). A staff member or planning committee from each facility rated the facility's status in relation to each statement on a scale of 0–3 (0=not in place; 1=under development; 2=partially in place/could be improved; and 3=fully in place). Scores for the three subscales (total possible scores: strategic planning=12; supportive environments=27; and communication and education=18) were added together to derive an overall score, with a total possible score of 57. Scores were averaged across facilities in communities with multiple recreation and sports facilities.
Vending Products for Sale
Facility staff also completed a four-step vending audit to assess products available for sale. First, staff compiled a list of vending machines in each facility (excluding ice cream and hot beverage machines) and their physical locations. Next, the research team used a computer-generated randomization sequence to randomly select four machines for staff to audit (if possible, two snack and two beverage; all machines were audited in facilities that had less than four machines). 23 Staff then recorded the number of slots in the machine and a detailed description of each item within the slots of the assigned machines, including product type, brand, flavor, size, and price. Finally, staff entered this information into the Brand Name Food List (BNFL; a standardized online tool for rating packaged foods and beverages according to BC nutrition guidelines) 24 to generate a scorecard containing the percentage of products from each “choose category” (e.g., choose most, and so on) for each machine. A reliability assessment completed during the pilot study showed that test-retest and inter-rater reliability for the audit process was high (≥0.88). 12 Product lists and BNFL score cards were faxed to the research team.
Policy Development
Progress in developing a healthy food and beverage policy was assessed by a single question on the FAQ in which facilities indicated whether they had a healthy food and beverage policy in place. At follow-up, communities that aimed to change policy completed a standardized policy assessment tool where staff provided details about their policy by responding to specific statements related to issues of food provision, programs and events, and staff. For example, staff were asked to indicate what proportion of food in each choose category was required by their policy and to respond yes or no to statements such as “our policy indicates that foods served at special events should meet the healthy guidelines” or “staff must be given training on how to appropriately encourage healthy snacks.” Staff were also asked to send their policy to the research team. HFBS communities' final report to the BC Healthy Living Alliance and responses to an open-ended interview question (HFBS and comparison communities; qualitative findings have been previously described) 25 were also used to confirm the state of policy development.
Process Evaluation
A thorough description of the implementation process was obtained from HFBS sites through in-depth examination of project proposals, final reports, and semistructured telephone interviews conducted with key recreation staff at follow-up. Project proposals and final reports were hand searched, and phrases were copied verbatim and categorized to provide an overview of the activities that were planned and ultimately implemented in each community. During interviews, staff were asked a series of seven implementation-related questions, including: What was the process to date?; What were the barriers and facilitators?; Which HFBS resources were used?; What were the necessary supports?; What was the impact of the HFBS?; and What were their future plans? Comparator community recreation staff also participated in semistructured telephone interviews. All interviews were recorded digitally and transcribed verbatim.
Statistical Analyses
All quantitative data, including FAQ scores, vending audit scorecard percentages, and policy assessment scores were entered into Excel and then SPSS software (version 17.0; SPSS, Inc., Chicago, IL) to generate descriptive statistics (means and standard deviations [SDs]) and conduct a chi-square test of association to determine whether community size, type, and region were associated with condition (HFBS vs. comparison) and repeated-measures analysis of variance (ANOVA) to determine whether there was a significant main effect of time and time by condition for outcomes of interest (organizational capacity, vending product offerings, and policy scores). Post-hoc ANOVAs and related-samples t-tests were conducted on the change in scores over time and baseline and follow-up scores, respectively, to determine where change occurred. Data were analyzed at the community level. Statistical significance was set at p<0.05.
A process of open coding was used to identify initial codes and categories within the qualitative data, followed by axial coding and constant comparison 26 to generate themes. NVivo software (version 8; QSR International Ltd, Doncaster, Australia) was used to organize the data and provide an audit trail of the analytical process.
Results
Although the demographic data displayed in Table 1 showed that slightly more (n=2) intervention communities were medium in size whereas slightly more comparison communities had less than 10,000 people or over 100,000 (large cities), the proportion in each category was not significantly associated with condition. Nine intervention communities were classified as urban versus 11 comparison communities. There appeared to be a different proportion of facilities participating by region with a larger percentage (33%) of intervention communities from Vancouver Island and more comparison communities from Fraser Valley (46%). Most communities were cities, with only four communities classified as villages or towns (one HFBS and three comparison).
Organizational Capacity
At baseline, overall FAQ scores did not differ between HFBS and comparison communities (mean [SD]=20.14 [8.6] vs. 19.1 [9.95], respectively). There was a significant difference on one subscale score, strategic planning (F(37)=11.196; p<0.01; mean [SD]=5.00 [2.96] in HFBS vs. 2.06 [2.33] in comparison). HFBS grant communities scored higher on having committees and plans in place.
At follow-up, there was a significant main effect of time (F(34)=44.10; p<0.001) and time by condition (F(34)=16.5; p<0.001) for overall and all subcategory FAQ scores (Table 2). Post-hoc t-tests showed that, at follow-up, intervention communities had significantly higher scores overall (follow-up mean=32.83 vs. 20.14 at baseline; t(20)=6.452; p<0.001) and in all three subcategories of the FAQ, compared to baseline (follow-up means for strategic planning=8.77 vs. 5.0 at baseline; for supportive environments=13.26 vs. 8.73; and communication and education=10.81 vs. 6.4; p<0.001), whereas comparison communities had significantly higher scores overall (22.18 vs. 19.12; t(16)=3.031; p<0.01) and on two subcategories of the FAQ, compared to baseline (strategic planning and supportive environments; p<0.05 and p<0.01, respectively). However, compared to comparison communities, the amount of change in HFBS communities was significantly greater overall (12.80 vs. 3.10; p<0.0001) and for each subcategory of the FAQ (Table 2).
Change in FAQ Scores from Baseline to Follow-up
The Healthy Food and Beverage Sales initiative comparison trial took place in recreation and sport facilities in British Columbia, Canada from February 2009 to March 2010. One-way analysis of variance was used to assess change in intervention, compared to comparison, communities.
FAQ, Facility Assessment Questionnaire; SD, standard deviation.
Vending Products for Sale
A total of 320 vending machines were present in participating communities: 189 in HFBS and 131 in comparison sites. At baseline, 73 machines (n=1842 products) from HFBS and 101 (n=2259 products) from comparison communities were audited, whereas 71 (n=1846 products) from HFBS and 100 (n=2314 products) from comparison communities were audited at follow-up. Fewer machines and products were audited at follow-up because machines were removed (HFBS) and one facility was shut down (comparison).
At baseline, vending product mix (by choose category) did not differ between HFBS and comparison communities (Fig. 2). No communities met provincial nutrition guidelines. Just over half of the products in both HFBS and comparator communities were from the not recommended category at baseline, whereas nearly one third were choose most or choose sometimes.

Percentage of vending machine products by choose category at baseline and follow-up in intervention (n=21) and comparison communities (n=23). The Healthy Food and Beverage Sales initiative comparison trial took place in recreational and sport facilities in communities in British Columbia, Canada, from February 2009 to March 2010. Scores were averaged across facilities in communities with multiple recreation and sports facilities. Values represent means±standard deviation.
At follow-up, there were significant time effects for choose sometimes products (F=7.28; p=0.010) and not recommended products (F=6.52; p=0.015; Fig. 2). There was also a significant time by group effect for choose most (F=7.65; p=0.009) and not recommended products (F=11.16; p=0.002), with HFBS communities decreasing not recommended products by 10%, compared to a 1% decrease in the comparator communities, and increasing choose most products 4%, compared to a 1% decrease in comparator communities.
Sixteen of 21 HFBS proposals indicated that changing vending was a goal; six specifically stated that they aimed to change their vending contract, because their current contract did not allow them to require compliance with the provincial guidelines; two were successful during the time period. In the two communities that succeeded in changing their vending contracts during the study, the positive changes were far more substantive. For example one community increased the percentage of choose sometimes products from 25% to 79%, eliminated choose least products (5–0%), and reduced not recommended products from 58% of the product mix to 11%. The percentage of choose most products did not shift, however (12% at baseline and 10% at follow-up). Three further communities reported being able to negotiate with their vending company while a contract was in place and increases in their percentage of healthier products were nearly 20%. None of these shifts met the provincial guideline of 50% choose most and 50% choose sometimes, however.
The following barriers to changing vending were identified in the follow-up interviews:
• Being locked into existing contracts • Lack of cooperation or willingness by vendor to make changes • Limited healthy choice product variety • Limited suppliers with healthy choices who serve area • Product expiration dates and low product turnover in low-traffic facilities • Monitoring and ensuring machines are stocked correctly with healthy choices • Healthy choice vending products not being purchased by patrons (either too expensive or not palatable) • Lower profit margins on healthy choice products
Policy Development
At baseline, 43% of HFBS and 35% of comparison communities reported that policy development was underway; only 10% of HFBS communities already had a policy in place and no comparison communities had one. At follow-up, nearly half (48%) of HFBS communities reported officially approving a policy. Eight of these 10 communities provided detailed information about the scope of their policy, with four policies sent to researchers. In contrast, no comparison communities reported formally adopting food and beverage policy, although 65% indicated that development of such a policy was underway.
Process Evaluation
Interview participants reported both facilitators and barriers to implementation of healthier choices, and key themes and sample quotes from the HFBS communities are displayed in Tables 3 and 4. HFBS interviewees identified very similar barriers as comparison communities. The number 1 perceived challenge for both the comparison and HFBS Grant communities was potential costs and revenue loss associated with transitioning to healthier choices, and this related to stakeholder buy-in (decision makers, managers, and vendors). Finding available products that patrons and staff would buy was also a commonly cited challenge. Staff recognized that a lack of education or awareness may also be a barrier to gaining greater public buy-in to offering healthy choices in recreation facilities. Buy-in from management and local decision makers was mentioned as a barrier by some staff from the comparison communities, but this barrier was much more pronounced in interviews with staff from HFBS sites. Having this support was also cited as a key facilitator. One area of challenge that was more pronounced in interviews with comparison communities was a lack of resources, support, or information required to make change. These communities appeared more apprehensive about investing in change without knowing the reaction from patrons or the impact on the bottom line. One interviewee in a comparison community summarized their apprehensions well:
Facilitators and Barriers to HFBS Implementation as Reported by Staff Involved in the Change Process
HFBS, Healthy Food and Beverage Sales in Recreation Facilities and Local Government Buildings; BC, British Columbia.
Key Barriers to Implementing Healthy Choices in Comparison Communities
“To be quite frank, I don't think we have a clear indication of where this is going. Province-wide and where the market trends are going…We rely on others to give us the information which will allow us to make informed decisions. We're not going to make change that isn't going to make sense, isn't going to have success…not potentially being what [patrons] want and affecting our bottom line.”
Discussion
To our knowledge, this is the first large, controlled study to examine the impact of an intervention to improve the food environment in publicly funded recreation and sport facilities, key settings in which children and their families are regularly present. Despite relatively short time frames for action, HFBS communities appeared to have developed their capacity to support the provision and promotion of healthy foods and beverages to a greater extent than comparison communities. HFBS intervention community self-assessments showed greater progress related to strategic planning, creating supportive environments, and providing information and education related to healthy eating. These communities also reported offering more healthy and fewer unhealthy choices in their vending machines, and a greater number of them either reported having a healthy food and beverage policy in place or under development. Thus, the HFBS initiative appears to have served as a catalyst for positive change in recreation and sport facility food environments, although both facilitators and challenges to change were highlighted. We discuss these findings in detail and in the context of the literature below.
At baseline, HFBS and comparison communities indicated a very similar starting place with respect to supportive environments, as well as communication and education supporting healthy eating. By contrast, HFBS communities reported a higher level of development in the area of strategic planning. This finding was not unexpected, given that communities participating in the initiative would have had to engage in planning activities in order to apply for a HFBS grant. When interviewed at the end of the study, comparison communities reported that although they were interested in the HFBS initiative, they had either been unaware of the grant opportunity, lacked capacity to apply, or were not ready to make changes at the time the call for HFBS grant proposals was issued. 25
At follow-up, both HFBS and comparison communities reported a higher level of development overall, and in all three subcategories of the FAQ, with significantly greater improvements in HFBS than in comparison communities. In particular, HFBS communities made greater progress related to strategic planning. The process evaluation (some of which is described elsewhere) revealed that HFBS communities devoted substantial attention to this area because they believed plans and policies would provide a solid foundation for a long-term commitment to providing healthy food environments within their recreation and sports facilities. 25 That comparison communities reported progress in all areas assessed by the FAQ, despite being asked not to, is also significant. Self-assessment has proven a strong driver of positive change in similar studies,27–29 although it is also possible that changes reflect testing effects or reporting biases.
A key area of success was in the area of policy development, given that nearly half of HFBS communities indicated that they had a healthy food and beverage policy in place at follow-up, whereas no comparison communities had one. Recreation stakeholders have emphasized the importance of policy as a key prerequisite for making healthier options available. 11 Stakeholders in HFBS communities indicated that they focused on policy development because they perceived that policies, together with their plans, would provide a basis for sustainable change in their facilities. 25
Progress in implementing policy was less evident, however, given that shifts in the health quality of vending machine items were modest, consistent with findings from the pilot intervention. 12 The proportion of unhealthy vending items in recreational facilities that claimed to be adhering to nutrition guidelines in another study was similar (at 59%). 30 The modest changes observed in vending product mix may be related to study timelines, which were reportedly too short to get policies approved or fully enact them by renegotiating vending contracts. Thus, some of the potential positive impacts of the HFBS initiative on the food environment may have gone unrealized. Indeed, recreation stakeholders in this study and the pilot study emphasized that change takes time. 12
In interviews, intervention communities reported a number of barriers that may have influenced the amount of change that they were able to achieve in their vending 25 and that are similar to those reported in other studies,11,12,15,31 including: (1) limited availability of healthy vending machine products; (2) being locked into contracts that did not require vendors to offer healthier choices; (3) unwillingness of vendors to make changes; (4) few suppliers of healthy options; (5) low sales of healthy options; (6) concerns about lower profit margins on healthy products (although sales data were not collected in this study to validate this concern); and (7) limited time to ensure machines contained healthy choices.
Implementation of the HFBS initiative reflected over 2 years of engagement with public health, recreation, and industry stakeholders through a provincial needs assessment, development and pilot of a toolkit resource, and a pilot of the capacity-building approach and evaluation methods in 10 mentor communities. 12 The literature suggests that interventions that promote community ownership along the research process can enhance an intervention's acceptability, compatibility, and ultimate success.27,32,33 In keeping with this bottom-up approach, specific changes were not prescribed to HFBS communities; rather, communities were free to pursue changes consistent with their own priorities, stage of readiness, and capacity to implement change. As a result, changes were reported across areas not assessed in this study, ranging from implementing food policy for children's programs and staff meetings to addressing food security (e.g., building community gardens). 25
The HFBS initiative is an example of a program that sought to harness voluntary cooperation of industry to achieve child-focused public health objectives. Other research suggests that cooperation from industry is important in efforts to implement nutrition guidelines in this setting. 15 Our experience is consistent with these findings, given that some vending machine operators modified the products provided through their existing contracts to support greater provision of healthier options in HFBS communities. Thus, ongoing efforts to engage industry may be critical in efforts to improve these food environments. Importantly, HFBS communities that succeeded in changing their vending contracts improved the quality of their vending machine product mix to a greater extent than HFBS communities that were unable to change their contracts, consistent with findings from the pilot study. 12
This study demonstrates that capacity-building activities focused on improving problem recognition, engaging key stakeholders, and providing training, resources, and technical support are key facilitators of positive change in food environments in the recreation and sport sector (when nutrition guidelines are in place). Beneficial outcomes of this approach were particularly evident at the policy level. By contrast, others have observed that when few resources are provided to support implementation of nutrition guidelines in the recreation and sport sector, awareness, adoption, and implementation of nutrition guidelines remains low. 14 Increasing the availability of healthy items in recreational sports settings may be a powerful means to support their sale (data submitted for publication) and thus efforts to ensure healthy options are highly available in this setting should be prioritized.
Strengths and Limitations
This evaluation occurred within the context of a “real-world” government-funded intervention in the recreation and sport sector, enhancing its external validity and policy relevance. The HFBS approach was designed in partnership with recreation stakeholders and was flexible to permit local tailoring according to context, enhancing the likelihood of adoption and sustainability.34,35 Notably, although some comparison communities did not complete all aspects of the follow-up assessment, no communities withdrew from the study, an important outcome in a study of this nature and size.
This real-world intervention was not without its challenges—challenges, however, that are common to other social change initiatives and implementation trials. 34 Inclusion of comparison communities was a strength of this evaluation; however, communities could not be randomized and therefore self-selected into treatment and comparison conditions. Randomization of sites would have allowed a greater number of threats to internal validity to be ruled out, such as history (communities differed at baseline) and maturation (change occurred owing to factors unrelated to the intervention). Self-selection into treatment and comparison conditions may also limit the generalizability of findings, given that it remains unclear whether the intervention is effective in all types of communities, or only in those with a certain level of readiness for change. Moreover, although communities appeared similar at baseline on a small number of measured characteristics, the potential for confounding from unmeasured characteristics is always significant in community-based trials. Control over these factors cannot realistically be achieved in studies of this type.
The evaluation was also designed to be feasible for communities to use beyond the study period and therefore relied on self-report. Community-based data collection procedures may have introduced a positive response bias and/or measurement error. Our ability to assess environmental change was limited because we only assessed changes in vending machine product mix and not in concession-based food services. In addition, the time frame for project implementation and evaluation was short, and the degree of change that could be made within the grant phase was limited for many facilities. Longer-term studies are needed.
Conclusions
The HFBS initiative engaged key stakeholders to build their capacity to improve the food environment in recreation and sport settings using a bottom-up, whole-setting, and context-specific change process. The effectiveness of this approach was evident in the significantly greater changes in strategic plans, education and communication, supportive environments, policy, and provision of healthier vending machine options reported in intervention, compared to comparison communities. These changes occurred in the face of some very real-world challenges (e.g., concerns related to the potential for a decline in revenues, restrictive provisions of existing vending contracts, and lack of stakeholder buy-in). Given the overwhelmingly unhealthy nature of the food environment in many recreation and sport settings, guidelines and implementation supports in the form of training, resources, and technical support are a high priority to ensure that these environments support healthy dietary behaviors and body weights among children.
Footnotes
Acknowledgments
The Healthy Food and Beverage Sales initiative and evaluation was funded by the British Columbia Healthy Living Alliance with funding from the British Columbia Ministry of Health and through the British Columbia Parks and Recreation Association. The authors acknowledge the communities and facility staff for their participation in the initiative and contributions to the data collection process. The authors also acknowledge the contributions of Barbara Dobson, who, in her role as Principal Researcher at the Social Research Demonstration Corporation during phase II of HFBS, advised on and reviewed evaluation reports.
Author Disclosure Statement
No competing financial interests exist.
References
Supplementary Material
Please find the following supplemental material available below.
For Open Access articles published under a Creative Commons License, all supplemental material carries the same license as the article it is associated with.
For non-Open Access articles published, all supplemental material carries a non-exclusive license, and permission requests for re-use of supplemental material or any part of supplemental material shall be sent directly to the copyright owner as specified in the copyright notice associated with the article.