
Abstract
Abstract
Background:
Messaging to reduce unhealthy beverage intake is often targeted to overweight and obese children; however, there is little evidence to show that healthy weight children have healthier beverage intake patterns. Further, data on consumers only may further elucidate beverage intake patterns.
Purpose:
The aim of this study was to update the current body of literature describing beverage intake in children by weight category, with the addition of consumer-only data.
Methods:
Day one 24-hour recalls from the National Health and Nutrition Examination Survey 2005–2010 were analyzed to assess beverage intake of children 2–18 years old and differences by weight category. Beverages were coded as water, milk, 100% juice, coffee/tea, fruit drinks, soda, or low-calorie/diet drinks.
Results:
On average, 18.7% of total daily calories for 2- to 18-year-old children came from beverages; 60% of total daily calories from added sugar came from beverages. Mean calories from beverages were 359, 358, and 386 kcal for normal weight, overweight, and obese children, respectively. Across all weight categories, there were clinically significant differences between overall means and means for consumers only. There were overlapping confidence intervals for intake of calories from soda and fruit drinks consumed by 2- to 5-year-olds and 12- to 18-year-olds, suggesting nonsignificant differences in intake across weight categories for these age groups.
Conclusions:
Messaging around beverage intake may be beneficial for children of all weights, particularly for those known to consume sugar-sweetened beverages. The per-consumer estimates may represent a better measure of intakes in future examinations of 24-hour recall data.
Introduction
Beverages are an important component of children's diets and are a source of energy (i.e., calories) and nutrients. The nutritional quality of beverages varies, and some beverages (e.g., unsweetened milk and water) are encouraged as a healthful part of a child's diet. Other beverages (i.e., soda and other sugar-sweetened beverages [SSBs]) are a source of “empty calories” because they do not contain needed nutrients and thus could be eliminated from children's diets without harm. Reducing consumption of SSBs is recommended for obesity prevention; pediatricians and other primary care providers frequently assess children's beverage intake and counsel patients who are overweight to reduce intake of SSBs.1–3 SSB intakes have received increased scrutiny since the mid-1980s 4 and remain a target area for behavior change for weight management. Given this background, one might assume that the beverage consumption patterns of overweight and obese children differ from those of children at a healthy weight status. However, there has been little epidemiological research to address this question. A greater understanding of the patterns of SSB intakes, especially by weight status, will provide more-salient information to guide clinicians as to the most poignant messages to deliver to their patients during brief encounters.
Few studies report on energy from, and volume of, beverage intakes, including non-SSBs, by weight category. Those that have include only young children 5 or examined data that are now two decades old. 6 Further, many existing reports on beverage intakes focus on national per-capita estimates. Reports of per-capita estimates are often severely diluted when they are calculated across the entire population without accounting for the proportion of the sample who do not consume. Lasater and colleagues used the “consumer-only” method of calculating beverage intakes for 6- to 11-year-old children; however, the child's weight category was not included in their analysis. 7 Pinpointing the relationship between obesity and beverage intakes will require a more accurate estimation of actual consumption patterns by weight status, which can be achieved by examining intakes for consumers only, in addition to the overall means.
Childhood obesity remains a major public health concern, and beverage intakes have been commonly identified as one of the primary intervention points. However, the presence of obesity is commonly perceived to be a functional outcome of high SSB consumption; it is also assumed that those with healthy weights have healthier beverage consumption patterns. Assessing beverage consumption for all children will help elucidate whether targeted interventions for healthy weight children are warranted as a means to prevent future obesity. The aim of this study was to examine beverage intake patterns, by weight status and age category, for children in the United States during the years of 2005–2010 using both population-based and consumer-only analyses.
Methods
Study Population
We analyzed beverage intake from the 2005–2010 National Health and Nutrition Examination Survey (NHANES). NHANES is a stratified, clustered, survey of health and nutrition, and each 2-year wave is designed to be nationally representative of the US noninstitutionalized population. 8 Participants were included in these analyses if they were 2–18 years of age and provided a valid, reliable 24-hour dietary recall data (n=9477). Human subjects approval was received by the National Center for Health Statistics Research Ethics Review Board for data collection; the analyses of deidentified data presented in this article were exempt from institutional review board review.
Height and weight were measured using standardized procedures, 9 and BMI was calculated as kg/m2. The sex-specific CDC BMI-for-age growth charts were used to categorize children's weight status as normal weight (5th through <85th percentile), overweight (≥85th through <95th percentile), or obese (≥95th percentile). Underweight children (n=308) were excluded from our analyses.
Dietary Data
The procedures for collection of dietary data are described in detail elsewhere. 8 Briefly, a trained interviewer conducted a 24-hour dietary recall using the validated multiple-pass technique.10,11 Recalls were conducted with participants themselves if over age 11 years. For children younger than 6 years, a proxy provided this information, and for children between 6 and 11 years, the participant and a proxy were interviewed together. Measurement guides were used to assist in estimating portion size throughout the interview.
Nutrients from each reported beverage were computed using the USDA's Food and Nutrient Database for Dietary Studies (FNDDS), using the corresponding FNDDS version for each survey cycle (versions 3.0, 4.1, and 5.0), and dietary guidance systems food group intakes. 12 Added sugars were estimated for all beverages using the Food Patterns Equivalents database (FPED). 13 Because the FPED version 2 was developed for dietary data through 2003–2004, an addendum from the USDA Center for Nutrition Policy and Promotion was used to produce FPED data for 2005–2006. 14
Coding the Beverages
All beverages were manually coded by a research dietitian into eight mutually exclusive categories: water (from all sources; e.g., tap, bottled, and seltzer); milk (including sweetened milk and nondairy milks; e.g., soy milk); 100% fruit and vegetable juice; coffee and tea; fruit drinks and ades (e.g., cranberry cocktail and regular sports drinks); soda; and reduced-calorie/diet drinks (e.g., diet soda, diet sports drinks, and diet energy drinks). Regular energy drinks were coded as such, but excluded from further analysis because they were consumed by only 74 participants (0.7% of the sample), precluding nationally representative estimates. Additives to beverages, such as sugar or cream, were manually recoded into the beverage category (e.g., coffee) with which they were consumed. Milk as an addition to food (e.g., cereal with milk) was not included in our analyses. Any beverage containing >0 g of added sugar (estimated using FPED) was considered an SSB, regardless of the beverage category to which it was assigned.
For each participant, we summed the total energy, energy from added sugar, and grams from each beverage category. Consumers were defined as a child who reported the particular beverage on the day of the dietary recall.
Statistical Analyses
Data from the three 2-year cycles were combined for analysis into a single, nationally representative sample, as recommended by the NHANES analytic guidelines. 15 Proportion of consumers of each beverage were computed across age and weight status categories. The energy, energy from added sugar, and grams obtained from beverages were summed across all beverages per participant; means and 95% confidence intervals were calculated for each age and weight category. Finally, the percent of total daily energy and total daily energy from added sugars (from all foods and beverages) obtained from beverages was computed. Total daily energy and energy from added sugar from all foods and beverages were estimates using FNDDS and FPED. All analyses were weighted using appropriate NHANES examination weights, which account for planned oversampling and adjust for nonresponse. Variance estimates account for the complex, multistage, clustered sampling design using Taylor series linearization, as implemented in SPSS Complex Samples. All analyses were weighted using a formula for combining multiple survey cycles in order to achieve nationally representative data. 15 SPSS Complex Samples (SPSS version 21.0; IBM SPSS Inc., Chicago, IL) was used to account for the complex sampling design.
Results
Overall Per-Capita Beverage Intakes
When examining the per-capita means for all children (2–18 years old, all weight categories), water, milk, and soda were the most highly consumed beverages based on grams of intake (559, 230, and 218 g/day, respectively). On average, 18.7% of total daily calories from all foods and beverages for 2- to 18-year-old children came from beverages; 60% of total daily calories from added sugar from all foods and beverages came from beverages. When we examined only children who consumed at least one SSB (n=7596; 77.6% of the weighted sample), the percent of total daily added sugar from beverages rose to 77%.
The top three sources of calories from beverages were milk, soda, and fruit drinks (134, 85, and 57 kcal/day, respectively). For all children ages 2–18 years, mean energy intake from all beverages was 359, 358, and 386 kcal for normal weight, overweight, and obese children, respectively. Of the eight beverage categories, soda, fruit drinks, and milk were the three largest sources of energy from added sugar, providing an average of 78, 44, and 16 kcal/day, respectively.
Proportion of Children Consuming Each Beverage
The youngest children (2–5 years) were nearly 2-fold more likely to drink milk (72.8%) and 100% fruit juice (54.1%), compared to 12- to 18-year-old children (39.9% and 22.3%, respectively). The proportion of children consuming soda and the proportion consuming coffee and tea were greater in each ascending age group; twice as many 12- to 18-year-olds consumed soda (50.0%) and coffee or tea (23.3%) on the day of record than 2- to 5-year-old children (soda, 24.4%; coffee or tea, 9.6%).
The percent of consumers by weight category are shown for 2- to 5-year-olds, 6- to 11-year-olds, and 12- to 18-year-olds in Figure 1A, 1B, and 1C, respectively. Within each of the age groups, proportions of children consuming each of the beverage types were generally similar across weight status categories. Obese children were more likely to consume soda and less likely to consume milk than normal weight children across all age categories. Fewer normal weight children consumed low-calorie beverages, compared to obese children across all age categories. Within the 2- to 5-year-old age group, nearly twice as many obese children reported drinking coffee and tea, compared to normal weight children.
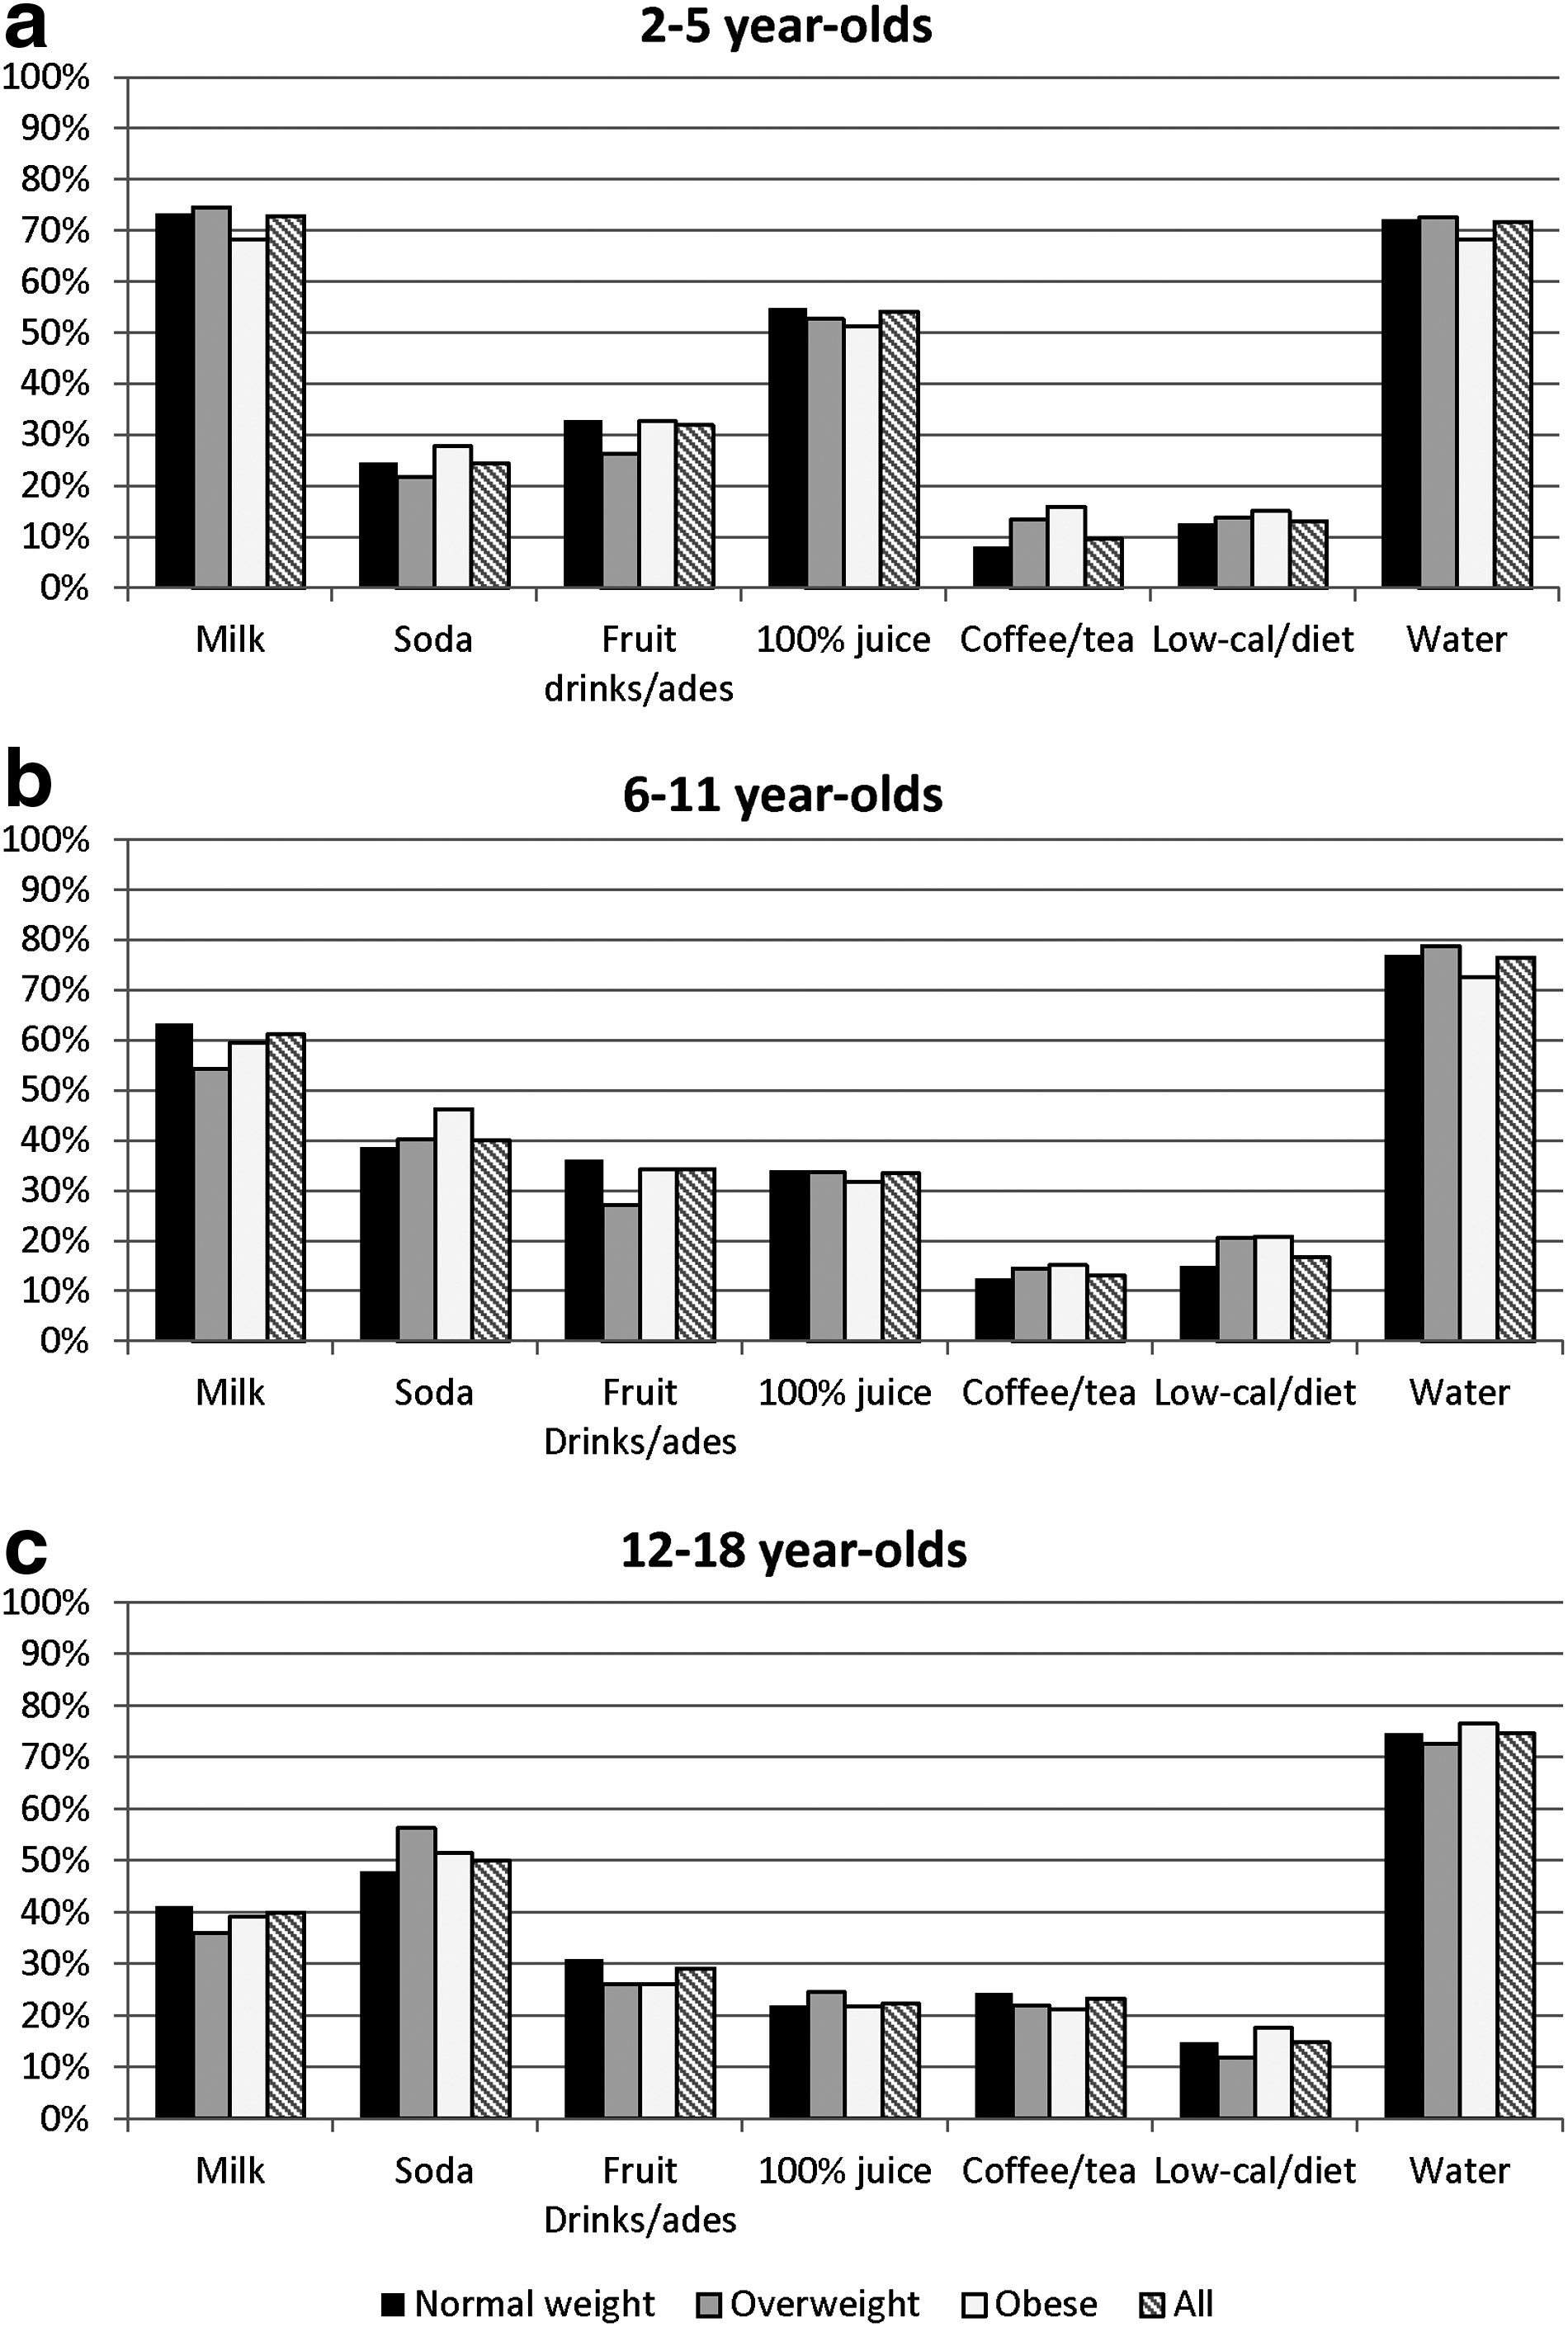
Proportion of children in each age group who reported consumption of each beverage during their 24-hour dietary recall (National Health and Nutrition Examination Survey 2005–2010).
Calories From Beverages: Per-Capita Means Versus Consumer-Only Means
Marked differences were evident in the contribution of beverages to total dietary intake when comparing mean per capita intakes to mean intakes for only those children who consumed each beverage type (Tables 1–3). Mean per-capita intake includes zero values for the intake of children who did not consume a particular beverage on the reference day. The consumer-only mean intake excludes these zero intakes and thus these averages are higher. For example, the per-capita mean energy from soda for 2- to 18-year-old normal weight children was 77 kcal/day. However, the mean energy from soda for 2- to 18-year-old normal weight children who consumed soda was 201 kcal/day.
All values are mean (95% confidence interval).
Water excluded from analyses based on unstable confidence intervals resulting from the relative absence of nonzero values.
y, years; NHANES, National Health and Nutrition Examination Survey.
All values are mean (95% confidence interval).
100% juice and water excluded from analyses based on unstable confidence intervals resulting from the relative absence of nonzero values.
y, years; NHANES, National Health and Nutrition Examination Survey.
Grams of Beverage for Normal Weight, Overweight, and Obese Children (NHANES Survey Years 2005–2010) a
All values are mean (95% confidence interval).
y, years; NHANES, National Health and Nutrition Examination Survey.
Differences in Consumer-Only Means Across Weight Categories
Mean energy (kcal), energy from added sugar, and grams of intake from each beverage for consumers only are presented in Tables 1–3, respectively. When examining the consumer-only means, the largest differences in energy intake across weight categories were observed for soda and fruit drinks. Obese children consumed approximately 13–47 more kcal from soda and 7–24 more kcal from fruit drinks, compared to normal weight children, depending on age group (Table 1). Within each age category, energy from added sugar in milk was generally similar across weight categories. Six- to 11-year-olds in all three weight categories consumed the most energy from added sugar in milk (34.6–37.6 kcal). In general, the largest differences in volume (g) of intake between normal weight and obese children were observed for water, low-calorie drinks, soda, and fruit drinks, with obese children across all age groups consuming a greater volume than normal weight children (Table 3).
Differences in Consumer-Only Means across Age Categories
Although there was a much larger proportion of 2- to 5-year-old children who reported drinking milk, mean calories from milk for only those who consumed milk was similar across age categories (Table 1). The proportion of children who consumed 100% fruit juice was also highest for 2- to 5-year-old children and lowest for 12- to 18-year-old children. However, the consumer-only mean calories from 100% fruit juice were highest for 12- to 18-year-old children across all weight categories. Mean energy intakes per consumer of soda, fruit drinks, and coffee and tea were higher in older children. For example, in almost every weight category, 12- to 18-year-old consumers drank 3 times the amount of energy from soda and coffee and tea as 2- to 5-year-old consumers. Mean volume (g) per consumer of low-calorie drinks was higher for the older age categories, particularly for normal weight children (278 g/day for 2- to 5-year-old consumers vs. 521 g/day for 12- to 18-year-old consumers). Mean volume of water intake per consumer was also higher for older age groups; 12- to 18-year-old consumers drank at least twice as much water as 2- to 5-year-old consumers across all weight categories (Table 3).
Discussion
With the recent interest in how energy obtained from beverages can tip the scales of energy balance, there is a growing need to gain better assessments of beverage intakes among groups. Reducing intakes of SSBs is a public health message that has been widely promoted during the past decade,3,16 frequently targeting obesity prevention,1,2 but also targeting improving nutrition and oral health.17,18 Declines in SSB intakes for youth in the United States over the past decade have been documented, 19 yet many youth continue to consume these beverages. It is critical to evaluate the intakes of individuals who continue to consume SSBs, which can be assessed by examining consumer-only means. Across all weight categories, stark differences were evident between the population estimates versus consumer-only estimates of the contributions of beverages intakes. Similar differences between per-capita versus per-consumer means have been demonstrated previously, although differences across weight categories were not examined, 7 and the per-consumer means may be a better measure of intake in future examinations of 24-hour recall data. In addition, examining the per-consumer data helps to understand whether differences in overall means across age and/or weight categories are owing to a higher percentage of consumers, a higher intake per consumer, or both. For example, the proportion of 100% fruit juice consumers was lowest among 12- to 18-year-old children; however, the per-consumer mean energy from 100% fruit juice was highest among 12- to 18-year-olds.
Our analysis included two beverage categories that are invariably sugar-sweetened: soda and fruit drinks. In all age categories, soda and fruit drinks contributed more energy and energy from added sugars for obese consumers, compared to normal weight consumers. However, there was not a uniform trend of higher intakes among children in heavier weight categories. For example, overweight children had the lowest per-consumer volume of intakes of soda and highest of fruit drinks. These findings vary slightly from previous studies examining beverage intakes by weight category. One study of 2- to 5-year-olds using NHANES data found no differences in soda consumption by weight status. 5 Studies of earlier NHANES data (1988–1994) for 2- to 19-year-old children did show differences in caloric intake from soda across weight categories. 6 It is important to note that, regardless of differences across weight categories, even normal weight children consumed between 89 and 278 calories from soda and 130 and 227 calories from fruit drinks, depending on age, on their day of dietary recall. Further, overall mean caloric intake from beverages was greater than 350 calories for children in all weight categories. Therefore, messages to limit SSB consumption are relevant for children of all sizes and may be important for the prevention of overweight and obesity in healthy weight children.
One misinterpretation of obesity messaging is that high intakes of SSBs are only a problem for overweight and obese youth. Our analyses of data from NHANES 2005–2010 caution against the assumption that obese children drink SSBs and normal weight children do not. Though we saw some trends toward a higher percentage of obese children who consumed soda on the day of recall, the proportion of children reporting soda and fruit drink, the two beverage categories made up entirely of SSBs, was strikingly similar across weight categories. For example, roughly half of all 12- to 18-year-olds in all weight categories consumed soda on the day of recall.
The finding that soda and fruit drink consumption is frequently consumed by children in all weight categories is important for pediatricians and other healthcare practitioners given that there may be an assumption that aggressive messaging to reduce SSBs should always be delivered to children with obesity and that the contribution of energy from beverages is not relevant to normal weight children. Healthcare providers may not deliver the message to limit SSBs as aggressively to normal weight children as a means of obesity prevention, many of whom would benefit from this message.
Whereas national nutrition monitoring data can provide population estimates of intakes across groups, the zero-values of volume and energy intakes of nonconsumers can dilute the estimates that represent per-capita intakes, especially across weight and age categories. Because the public is generally interested in assessing mean intakes for children who consume a particular beverage, consumer-only means may provide a more accurate picture of beverage intakes among those who are actually consuming the beverages of interest.
There has been some debate over the role of noncaloric sweeteners in obesity.19–22 Dodd and colleagues showed that a higher percentage of obese children consumed low-calorie beverages, as compared to normal weight children. 23 Our data supported this as well; we saw a trend toward a higher percentage of consumers of low-calories drinks in the obese weight category. These may point to the success of the bountiful messaging about reducing SSBs in youth. Further research is needed to explore whether the overweight and obese children that drink reduced-energy beverages exhibit other patterns of healthier eating than their peers who drink SSBs.
The study has limitations that must be considered when interpreting the findings. Because the data represented a cross-sectional analysis of a single day of intakes, it cannot be assumed that the 24-hour recall represented the children's regular dietary habits. Children were classified as consumers of beverage types based on the single day's intakes and may not represent their beverage choices and usual quantities consumed. Because only 1 day of intake was assessed in this study, mean intakes for consumers represent intake on any given day of consumption and does not speak to the frequency of consumption. We recommend that clinicians complete a brief food-frequency assessment (e.g., “How many days per week do you drink soda?”), while also considering portion sizes of beverages consumed. As well, it cannot be asserted that the dietary intakes caused the weight status used in these stratifications. Finally, the interviews of younger children were conducted through or with a proxy respondent who may not have witnessed all of the foods and beverages consumed on the day of record.
Conclusions
This study underscores that certain patterns in beverage intakes exist across age and weight status categories; however, it is equally important to identify the beverage intake patterns of a child to better evaluate the risk of obesity, regardless of weight status. Consumer-only intake data should be interpreted along with frequency of consumption when assessing beverage intake behaviors to better assess the potential link between beverage consumption and obesity. Overall, beverages can contribute greatly to the total energy and added sugar intakes in children, which reinforces the appropriateness of public health initiatives encouraging healthier beverage choices, even for children with a healthy weight.24,25
Footnotes
Author Disclosure Statement
No competing financial interests exist.