




Abstract
Abstract
Background:
Factors at birth and infancy may increase risk of being overweight in childhood. The aim of this study was to examine the relationship of birth size and infant growth (2–24 months) with BMI at age 5 years in a multiethnic population.
Methods:
This was a retrospective study (using electronic medical records of a health maintenance organization in Hawaii) of singleton children born in 2004–2005, with linked maternal and birth information, infant weights (n = 597) and lengths (n = 473) in the first 2 years, and BMI measures at age 5 years (n = 894). Multiple regression models were used to estimate the association of BMI at age 5 years with birth size and infant growth.
Results:
Birth weight was positively associated with BMI at age 5 years, adjusting for gestational age, sex, race/ethnicity, and maternal prepregnancy weight, age, education, and smoking. A greater change in infant weight was associated with a higher BMI at age 5 years, though the effect of birth weight on BMI was neither mediated nor modified by infant growth rate. Birth weight, change in infant weight, and BMI at age 5 years varied by race/ethnicity. Change in infant BMI in the first 2 years was higher in other Pacific Islanders and whites (Δ = 0.966; confidence interval [CI] = 0.249–1.684; p = 0.02) than in Asian, other, and part Native Hawaiian race/ethnic groups.
Conclusions:
Early biological measures of birth weight and infant weight gain varied by race/ethnicity and positively predicted BMI at age 5 years.
Introduction
Birth size and infant growth patterns are early life factors reported to be associated with child overweight. In previous studies, BMI increases were 0.5–0.7 kg/m2 for each 1-kg increase in birth weight. 1 However, these studies had limited data on gestational age, birth length, parental body size, maternal smoking, and socioeconomic status (SES). Other studies reported that the positive relationship of birth weight with child overweight could be explained by accelerated growth during infancy.2–6 A summary of 21 studies reported an increased adjusted risk (odds ratio = 1.84) for obesity with rapid weight gain during the first 2 years. 7
Racial/ethnic group representation in these studies was mostly white children, with more recent studies including Asians8,9 and Mexican American children. 10
Racial/ethnic disparities in early-life risk factors for child obesity are present in the prenatal, birth, infancy, and preschool years. 11 In a study of 12,903 term infants, 12 Asian children were born lighter and grew slower from 0 to 9 months, compared to white children. In another study, African American and Hispanic children grew rapidly in the first 6 months compared to white children. A study among 4608 multiethnic children, 5–8 years old from a health maintenance organization in Hawaii, reported that Samoan, part Native Hawaiian, Filipino, and other children of mixed ancestries had higher levels of overweight and obesity than whites or Asians. 13
This study examined the association of birth size and infant growth, with child overweight, race/ethnic differences, adjusting for maternal factors, in a multiethnic population. Specifically, this study hypothesized that a higher birth size (birth weight and birth length adjusted for gestational age) and infant growth was associated with a higher BMI at age 5 years, and that these early associations varied by race/ethnicity.
Methods
Study Design and Sample Selection
The study was a retrospective, longitudinal study using Kaiser Permanente Hawaii (KPH) electronic medical records (EMR). Child data inclusion criteria included: (1) all members of KPH as of January 2010; (2) born at KPH in 2004–2005; (3) birth information (weight, length, and gestational age); (4) singleton birth (98% of births); (5) weight/length/height measures at three time points (2–4 months, 22–24 months, and 4–6 years); and (6) Hawaii state birth certificate information (birth data for non-Kaiser births and maternal information).
A total of 5074 children were born at KPH during the years 2004–2005 with parents who were current health plan members as of January 2010. Of this sample, 4252 children had plausible birth weight and gestational age information and 2946 children had all three birth measures (birth weight and length and gestational age). A resultant 1720 children had plausible birth size information as well as weight and height data that had been measured at their 5-year (5y) well-child visit.
Preliminary analysis of BMI at age 5y regressed on birth weight, birth length, and gestational age (n = 1720) demonstrated that birth weight and gestational age, but not birth length, independently predicted BMI at age 5y. 14 In addition, there was no interaction between birth weight and birth length; therefore, subsequent analysis was completed with the larger sample (n = 4252) that was not limited by birth-length information. Further addition of required covariates, including maternal variables (e.g., prepregnancy weights) and BMI at age 5y resulted in a final sample of 894 children, of which 597 children had recorded infant weights, and 473 had both infant weights and lengths. Table 1 summarizes the data sampling flow for this study. The KPH Institutional Review Board and University of Hawaii Committee on Human Subjects approved the protocol for this study.
Data Sampling Flow from Kaiser Permanente Hawaii (KPH)
Main Outcome
BMI is a moderate indicator of fatness in children 15 and therefore is more informative to study BMI as a continuous variable as opposed to using arbitrary intervals, assuming health risks increase with increasing body fatness. BMI at age 5y was calculated using weight and height taken at a well-child visit. A range of 4–6 years was selected, given that visits do not occur exactly at the recommended age of 5y.
Predictors of Interest
Birth weight was measured in grams and birth length in inches. Gestational age at delivery (in weeks) was initially determined by the last menstrual period and was later verified with ultrasound measures.
The first 2 years of life was selected as the time period for measuring rate of infant growth given that this has been shown to be related to later child overweight. 16 To measure change, data were sampled in two age ranges: early infancy (2–4 months) and at the end of infancy (22–24 months).
Rate of infant growth was measured as change in infant weight, length, and BMI divided by unit time (change in age). Data cleaning was conducted using the SAS program for CDC growth charts 17 to identify biologically implausible values. Values that fell within five z-score units from the observed mean z-score, with maximum height-for-age z-score of +3.0, were identified as biologically plausible. Weight-for-height flexible exclusion range <−4.0 and >+5.0 was recommended for application with BMI-for-age. Visual inspection of the sequence of infant and length measures were also conducted.
Race/ethnic information was reported by the parent for the child and was added to the database (at least 80% complete). Race coding for the race/ethnic variable was based on the methodology used by Surveillance Epidemiology and End Results. 18 For each race/ethnic variable, there were 27 race categories, which were collapsed to six categories for analysis as follows: Asian, white, part Native Hawaiian, other Pacific Islander (other PI), other, and unknown. Asian race/ethnic group included Chinese, Japanese, Filipino, Korean, Asian Indian, Vietnamese, Thai, and Asian–none other specified. Part Native Hawaiian race/ethnic group was coded similarly to the Hawaii Health Survey algorithm where persons who recorded a combination of Native Hawaiian and any other race are coded as part Native Hawaiian. 19 Other PI included Guamanian, Tahitian, Samoan, Tongan, and Pacific Islander–none other specified. Other included black, American Indian/Aleutian/Eskimo, and other not specified. Unknown indicated that race/ethnicity information was missing.
Other Covariates
Maternal factors such as prepregnancy weight, gestational weight gain, gestational diabetes mellitus (GDM), and smoking during pregnancy have been reported to be associated with child overweight/obesity.20–23
Maternal information was collected by (1) linking children with their mother's medical record through parent membership (mother or father) information at KPH and (2) information collected from the Hawaii Department of Health birth certificates. An employee from the KPH vital statistics department gathered information for the birth certificate from the mom and/or the number of live births.
Electronic medical records
This information includes mother's age at delivery, maternal education, maternal smoking, and alcohol use during pregnancy, prepregnancy weight, and weight at delivery. Gestational weight gain was calculated on fields based on prepregnancy weight and weight at delivery. Mother's age was recorded in years and determined at the time of delivery. Children whose mothers were less than 16 years of age were excluded (2%) given that peak attained height is not usually attained until age 16 years 24 and maternal prepregnancy BMI would not be comparable with BMI from adult mothers. Maternal education was used as a proxy for SES25,26 and was available from the birth certificate.
Maternal prepregnancy BMI was calculated using prepregnancy weights and the last measured height before pregnancy. Women who were pregnant or delivered an infant during that year were excluded. Diagnosis of GDM was determined using International Classification of Disease, Ninth Revision coding for diagnoses of GDM at delivery. Birth order of the child was determined by parity. Breastfeeding has been reported to be associated with lower weight gain in infancy and less obesity in childhood and adolescence than formula feeding. 27 A coded field for breastfeeding was not available; therefore, common text/phrases related to breastfeeding available in chart notes were identified and used for searching the text fields of notes from birth to 24 months (“breast,” “breastfed,” “BF,” “nursing,” and “pumping”) and a categorical variable called “breastfeeding status” was created (breastfed = Y; not breastfed = N). Breastfeeding duration (months) was determined using the last report of breastfeeding at any encounter minus date of birth.
Statistical Analysis
Proportionality of birth size measures and normality of their distributions were examined for outliers. The core model included BMI at approximately age 5y as the dependent variable and birth weight adjusted for gestational age as an independent variable, along with the exact age at which BMI was measured (varying from 4 to 6). The covariates (child age, sex, and race/ethnicity) were added to the core model given that they improved the precision of the model. Child's age was centered at mean age of 5 years. Variables that modified the coefficient of birth weight by 10% or more28,29 in the core models and/or had p values less than 0.230,31 were included in subsequent multiple regression models. These variables included gestational age, prepregnancy weight, maternal age, maternal education, and smoking status. Tests of linearity and adequacy of the model were conducted by adding additional squared terms and cross-products and examining significance (p < 0.05). Multivariate tests for differences in means between included and excluded groups were tested using logistic regression models. Change in infant weight (g/month), length (cm/month, converted from inches), and BMI (kg/m2) were added separately to the final core model to examine the effect of infant growth on BMI at age 5y. Associations were considered nonsignificant if p > 0.05. Statistical analyses were conducted using the SAS software program, Enterprise Guide 4.3 (SAS Institute Inc., Cary, NC). 32
Results
Sample Characteristics
Descriptive data for 894 children are provided in Table 2. There were more male (54%) than female children. The average gestational age was close to term (38.7 weeks). Mothers had an average of 14 years of education and an average prepregnancy BMI of 26.5 kg/m2, which is overweight by CDC BMI cut-off points for adults. 33 The number of mothers who smoked (6%) or drank alcohol (2%) during pregnancy was low, according to linked birth certificate information. Most children were breastfed for at least 18 months (0.5–24.0 months) and were first born.
Descriptive Statistics of Birth Size, Child BMI, and Covariates (n = 894)
n = 888.
n = 461.
Chinese (15.5%), Japanese (27.7%), Filipino (47.3), Korean (1.9%), Asian Indian (0.8%), Vietnamese (1.5%), Thai (0.4%), or Asian-NOS (4.9%).
Person's race is recorded as combination of Native Hawaiian and any other race.
Guamanian (1.1%), Tahitian (1.1%), Samoan (14.4%), Tongan (1.1%), or Pacific Islander–none other specified (82.3%).
American Indian/Aleutian/Eskimo (17%), African American (26%), or other (57%).
Race/ethnicity information is missing.
GDM, gestational diabetes mellitus; NOS, none other specified.
In the initial models, maternal prepregnancy weight and maternal BMI modified the coefficient of birth weight by 10% in the birth weight core model, which improved the adjusted R2 from 0.08 to 15.6%. Prepregnancy weight (t = 8.83) was an overall better predictor of child BMI compared with maternal height (t = −0.16) and maternal BMI (t = 8.24). A higher maternal prepregnancy weight was associated with a higher child BMI at age 5y (β = 0.028; 95% confidence interval [CI] = 0.022–0.034).
Birth weight was positively associated with BMI at age 5y (n = 894; β = 0.707; 95% CI = 0.446–0.969) adjusted for gestational age, sex, race/ethnicity, and maternal covariates (prepregnancy weight, age at pregnancy, education, and smoking) and centered age at 5y. Mean birth weight was lowest among Asians (3.21 kg) and highest among white children (3.41 kg). The difference in birth weight between males (3.33 kg) and females (3.27 kg) was not significant (p = 0.06).
Birth weight remained positively associated with BMI at age 5y (n = 597) after adjusting for change in infant weight and other covariates (Table 3). A greater change in infant weight was also associated with a higher BMI at age 5y, such that for every 100-g/month increase in weight between 2 and 24 months, BMI at age 5y increased by 1.0 kg/m2. Addition of the change in infant weight variable added 12% to the model variance. Change in infant weight was significantly different among race/ethnic groups (Fig. 1; analysis of variance: F = 2.68; p = 0.02). White children had the greatest change in infant weight (313 g/month) and “other” children had the lowest (277 g/month).

Change in weighta during the infant period by ethnicity (n = 597). aChange in weight = between 2 and 24 months. Analysis of variance: F = 2.68; p = 0.02. *p < 0.05. PI, Pacific Islander.
Analysis of Multiple Regression of BMI at Age 5 Years on Birth Weight and Change in Infant Weight a (n = 597)
Models adjusted for gestational age, child age, child race/ethnicity, child sex, maternal prepregnancy weight, maternal age, maternal education, and maternal smoking.
Change in weight (100 g/month) = change in weight/age at 22–24 months – age at 2–4 months.
Infant period = 2–4 months to 22–24 months.
p ≤ 0.001.
CI, confidence interval.
Asian (β = 0.782; 95% CI: 0.292–1.273), other PI (β = 0.934; 95% CI: 0.400–1.468), and part Native Hawaiian (β = 0.504; 95% CI: 0.002–1.007) children had a higher BMI at age 5y compared to white children, adjusting for child age, sex, maternal prepregnancy weight, maternal education, maternal smoking, and infant rate of weight gain. Children of other and unknown race/ethnicity were not significantly different from whites. BMI at age 5y was not significantly different between males and females.
Change in infant length was positively associated with BMI at age 5y (β = 1.58; 95% CI: 0.668–2.498; p = 0.001). A 1-cm/month increase in length was associated with a 1.6-kg/m2 increase in BMI. Change in length did not vary significantly by race/ethnicity or sex.
Change in BMI between 2 and 24 months was not associated with BMI at age 5y and did not vary by race/ethnicity (range = 0.02–0.05 kg/m2) or by sex (p = 0.81). Race/ethnic differences in BMI growth patterns visually emerged at 2 years (Fig. 2). Thus, race/ethnicity groups were modeled to explain change in BMI to explore differences noted in the plot after 2 years of age (F = 3.10; p = 0.009). Differences were noted between other PI and Asians (Δ = 0.614; CI = 0.122–1.106), other PI and whites (Δ = 0.966; CI = 0.249–1.68), and part Native Hawaiians and whites (Δ = 0.683; CI = 0.012–1.353).
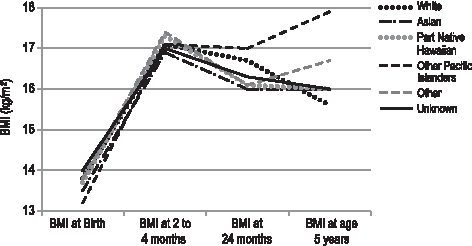
Change in BMI from birth to age 5 years by race/ethnicity (n = 473).
BMI plotted over time by sex varied at 2–4 months (males had a higher BMI than females), but later became equal at age 5y.
Birth weight was not associated with change in infant weight between 2 and 24 months (p = 0.39). Including change in infant weight in the regression model for BMI changed the regression coefficient for birth weight by only 7.6%. Similarly, including change in infant length and infant BMI changed the regression coefficient of birth weight by only 2.9% and 0.5%, respectively. We did not detect evidence that the effect of birth weight on BMI was mediated or modified by infant growth.
Discussion
Birth weight adjusted for gestational age and change in infant weight in the first 2 years was positively associated with BMI at age 5y and also varied by race/ethnic group, but not by sex. Another study conducted in a large community sample in Hawaii demonstrated that rapid weight gain from 12 to 23 months was associated with increased BMI at age 4–5 years of age in a sample of Native Hawaiian, Samoan, and Filipino children. 34 The first 2 years may be a continuation of the growth trajectory set during pregnancy and continuing through birth. Coupled with infant feedings, necessary growth adjustments can occur in the first 2 years to reach the expected growth trajectory. 35 Maximum catch-up growth occurs mostly up to 6 months postpartum, with possible continuation up to 2 years. 36 Catch-up growth begins within the first 3 postnatal months and is completed by around 12–18 months, whereas catch-down or “compensatory deceleration” 37 of normal growth, starts a little later and may not be complete until 18–24 months.38,39 Change in infant growth during this time period of 2–24 months was not associated with birth weight in these data and did not mediate the positive effect of birth weight on BMI at age 5y.
In the present study, differences in birth weight and change in infant weight were observed between race/ethnic groups. Differences in BMI were significant among race/ethnic groups after 2 years (F = 3.10; p = 0.009). Exploratory plots of BMI trajectories among race/ethnic groups suggest differences after 2 years of age (Fig. 2). These differences in BMI trajectories may be explained by cultural differences in early nutritional and behavioral factors, such as choice of infant feeding 40 transition time in infant feedings, 41 types of solid/table foods provided, and also maternal diet-related behaviors.42,43 Child-feeding practices in terms of beliefs, values, and behaviors related to different foods are influenced by culture43,44 that differ by race/ethnic groups. These cultural aspects, believed to contribute to disparities in childhood obesity, include patterns of shared understanding in terms of body image development and food consumption. 43
This study provides unique data from an integrated healthcare system and diverse population. KPH is demographically similar by age, sex, and race/ethnicity to the state of Hawaii population. 45 According to the US census reports, demographic shifts that are occurring in Hawaii are similar to the mainland, reporting higher numbers of Asians, Pacific Islanders, and mixed racial and ethnic groups. 46 According to the Hawaii Pregnancy Risk Assessment Monitoring System (PRAMS) trend report (2000–2008), 47 maternal age was similar between state and KPH populations, with the average age between 25 and 34 years of age. Most mothers had a high school education or lower compared with some college education for KPH mothers; maternal education did not influence study results. For prenatal care, mothers with private insurance was the most common, followed by Quest/Medicaid, Military, and no coverage. In the same report, race/ethnic groups of births consisted of a larger proportion of those with Native Hawaiian race, which is similar to KPH, though a higher Asian race is represented than whites in the KPH sample. The findings of this study are generalizable to Hawaii and the changing demography of the United States, informing the needs of these race/ethnic groups that are currently understudied.
The findings of this study may be limited by several factors. Breastfeeding duration data from the EMR was determined by using text searches for the last report of breastfeeding at any encounter up to 24 months. A limitation in this method is that the accuracy of ascertaining how long they breastfed is dependent upon consistent documentation by physicians at subsequent well-child visits. In addition, there is potential for error in the use of text words in searches. This may explain the much longer duration of breastfeeding (mean of 18 months) in this sample than what is reported nationally, where 27% are breastfed at 12 months (Hawaii = 36.5%). 48 We did not look at breastfeeding rates at 12 months, but rather the minimum duration of breastfeeding at which it is documented. Since May 1997, KPH has maintained the baby-friendly hospital designation where breastfeeding is largely encouraged, which could have contributed to the longer duration of breastfeeding and percent ever breastfed observed in this KPH sample. According to previous CDC breastfeeding report cards, the state of Hawaii has consistently been ≥25% for those breastfed at 12 months since 2001 and more recently at 39.3% in 2014, which does not explain the mean higher duration of breastfeeding at 18 months shown in this sample. A more extensive review of the EMR per individual for validation would have been helpful for confirmation; however, this was not available for this study.
Our sample also reported a high rate of ever breastfed (99%), which is similar to the Hawaii PRAMS data that 91% of mothers breastfed their infants. 49 Ever breastfed reported in the 2014 CDC report card for Hawaii was 89.5%. 48 However, even with the higher proportion of breastfed and longer duration of breastfeeding in this sample being greater than the norm, we still did not observe an effect on child BMI at age 5y. Studies have shown that breastfeeding is protective of risk for child obesity. 50
However, the magnitude of association of breastfeeding and child obesity we report may have attenuated with the inclusion of additional factors. 51 In addition, the contribution of exclusive breastfeeding to child BMI cannot be demonstrated in this study. Further work in the EMR is needed to separate out breastfeeding and/or formula feeding, which is also noted to be important to differentiate because formula-fed babies grow faster than breastfed babies. 52
Infant sleep patterns and excess television viewing have also been associated with child overweight.53,54 This information was also unavailable through the EMR. In addition, diet and physical activity patterns during childhood could influence BMI at age 4–6 years. Unhealthful eating habits in later childhood may be highly influenced by what is provided in the first 2 years of life.
Methods were developed for data cleaning, inspecting growth data, and processing data for use in this research study. However, there are certain issues that are beyond our control and should be acknowledged. For example, when measuring lengths of infants, they should be lying supine length up through age 24 months. It is possible that if the child was able to stand, clinical staff might measure the child's standing height, which could affect child measures by 0.4–2.3 cm from 18 to 36 months. 55 This is a limitation; however, only weights/lengths up through 24 months were examined, which would decrease the number of children measured using standing height. Ethnic data are self-reported and gathered from several sources for the EMR to assure completeness of the data. Coming from different sources may introduce bias, although most of the data now come from the personal history sheet and are coded by a standard method for the EMR.
A strength of this study is the access to actual versus self-reported measures for birth information and for maternal weights/heights. Underestimated maternal prepregnancy weights have been shown to overestimate associations of maternal BMI and birth outcomes. 56 The KPH EMR allows for capture of diagnostic medical information that is comprehensive and contains standardized language. However, although EMRs are used in routine medical care, these data are not without risk of data measurement and entry error. 57
Future studies would benefit by studying these biological and cultural relationships from a life course model perspective from preconception care to early childhood.58,59 This perspective suggests that race/ethnic health disparities result from varied developmental trajectories that may be set in motion during the critical periods, such as preconception, pregnancy, and the first 3 years of life. Further, application within a preventive healthcare system offers several points of opportunity in the life course to encourage prevention and early intervention. For example, in this study, a higher maternal prepregnancy weight was associated with a higher child BMI at age 5y. Kitsantas and colleagues reported that being overweight or obese before pregnancy was associated a child who was 1.4 times more likely to be overweight or obese by age 4. 58 Preconception care programs in a healthcare system can target the health of women of reproductive age to improve pregnancy-related health outcomes, setting mothers on a healthy trajectory for themselves and their child pre- and postpregnancy.
Transitional periods of infant feeding (from breast to introduction of complementary foods in later infancy, table foods for the toddler, and preschool age) are also key time points. During this time, children are still largely influenced by their parent's food choices and cultural practices.43,60 The years between 2 and 5 are also highly impressionable in terms of forming healthful habits61,62 and could be a crucial time period to influence chances for child overweight as compared to the first 2 years.
Conclusions
In conclusion, this study reported that early biological measures of birth weight and infant weight gain varied by race/ethnicity and positively predicted BMI at age 5y. Race/ethnic differences of birth size and infant weight gain should be further explored in relation to cultural aspects that may influence these differences. The development of a healthy child begins with a healthy mother, which is mostly dependent upon her choices and her environment, and should thus be informed and supported by national- and state-level maternal health agency and organizational policy. Public health prevention programs are available to improve overall maternal health during the reproductive years, through pregnancy, influencing the early infant and childhood years and the optimal growth trajectory. With provision of the necessary tools and support services, the family, together with the healthcare system, can work toward promoting optimal child health in the life course.
Footnotes
Acknowledgments
The data set for this study is part of a larger data set provided for the Pacific Kids DASH for Health (PacDASH) study. The PacDASH study is a 4-year USDA-funded study (Rachel Novotny, PI: 2008-55215-18821 [2/15/2008 – 2/14/2012]) under the Cooperative State Research, Education, and Extension Services, National Research Initiative Competitive Grants Program Award. This work was conducted at the Kaiser Permanente, Center for Health Research Hawaii. The authors acknowledge Valentyna Pishchalenko and Carmen Wong for providing programming support as part of the PacDASH study.
Author Disclosure Statement
No competing financial interests exist.