
Abstract
Abstract
Background:
Central obesity is associated with increased risk of type 2 diabetes.
Objectives:
The study objectives were to develop waist circumference (WC) percentiles, to determine if WC is associated with metabolic risk, and to compare our WC percentiles with those reported in the 2007–2010 National Health and Nutrition Examination Survey (NHANES).
Methods:
A cross-sectional study of 1232 children (606 boys ) 5–14 years was performed from 2011 to 2014 in indigenous Koya children from northwestern Argentina. Anthropometric characteristics, glucose, lipids, and insulin levels were measured. Sex-specific reference percentiles were computed using the Lambda-Mu-Sigma (LMS) method. We obtained 2007–2010 NHANES data for comparison with our results.
Results:
Compared with the NHANES 90th percentile, WC values for children in this study were lower by an average of 11.05 cm for girls and 12.66 cm for boys. The prevalence of low high-density lipoprotein cholesterol (HDL-C) was 11.8% in children with WC ≤50th percentile, 10.3% in children with WC >50th–70th percentile, 17.5% in children with WC >70th–90th percentile, and 21.3% in children with WC >90th percentile. The prevalence of high triglycerides (TG) was 19.5% in children with WC ≤50th percentile, 19.9% in children with WC >50th–70th percentile, 28.8% in children with WC >70th–90th percentile, and 39.7% in children with WC >90th percentile. Multiple logistic regression analyses showed that high TG values (>150 mg/dL) were significantly associated with WC [odds ratio (OR)] 1.05; 95% confidence interval (CI) 1.03–1.08; and low HDL-C values (<35 mg/dL) were significantly associated with WC (OR 1.04; 95% CI 1.01–1.06), adjusted for age and gender.
Conclusion:
We present for the first time WC reference data for indigenous Koya children ages 5–14 years. There was a significant association between WC and dyslipidemia in this community. Compared with the NHANES WC percentiles, our WC values were lower. These differences possibly reflect ethnicity or the lower prevalence of obesity.
Introduction
Developing countries are currently experiencing a higher prevalence of childhood obesity than ever before, and ethnic differences have been documented in this regard. Central obesity is also on the rise and is associated with increased risk for type 2 diabetes mellitus and cardiovascular disease. 1 Waist circumference (WC) percentiles, one of the anthropometric measures related to central obesity, are strongly correlated with cardiovascular risk factors and have become widely used in children.2,3 This study was performed in San Antonio de los Cobres (SAC) and its suburbs, located in the Altiplano region of Argentina. The Altiplano region lies in the central Andes mountains, with an average height of approximately 3750 m above sea level, mean annual temperatures below 10° C, and total annual rainfall less than 1000 ml. Chronic hypoxia due to high altitudes has conditioned a series of adaptive changes, some of which are anthropometric changes. 4 What is unclear is whether the environment, rather than genetic factors, mainly determines the phenotype of a high-altitude individual. Individuals living at high altitudes have raised hemoglobin concentration, enlarged lung volume, and blunted hypoxic ventilatory response, representing the successful human long-term adaptation to hypobaric hypoxia.
A previous study showed that Americans living at <500 m above sea level had approximately five times the risk of obesity compared with counterparts living >3000 m above sea level, 5 suggesting that reduced temperature at increased elevation may lead to weight loss through catabolic effects. Consistently, a large study found regional differences in BMI upon preliminary examination of state-level US maps published by the CDC. 6 Accordingly, a study performed in this community showed that Argentinean indigenous children living at high altitudes had significantly higher mean hemoglobin levels and lower prevalence of obesity than mixed population Argentinean children living at sea level. 7 Mechanisms relating elevation and obesity include hypoxia, leptin signaling, metabolic demands, norepinephrine levels and fetal/childhood growth. Hypoxia may modulate leptin levels through the hypoxia-inducible transcription factor, which regulates both iron metabolism and leptin gene expression. 8
Percentile reference charts are commonly used in pediatrics and can be used to screen children for appropriate growth by comparisons with those of the same age and sex. WC percentiles have been developed for children and adolescents in many countries.9–12 However, most studies in children have been limited to Western countries and infrequently include children from American indigenous populations. Indigeneous Koya children are generally not included in national surveys that monitor health status, or the numbers are too small to draw meaningful conclusions. Data, when available, are self-reported. No data are available for WC percentiles and their association with cardiovascular risk from a large population of Koya children. To our knowledge, no previous study has developed WC reference data for indigenous Koya children according to age and gender. The objectives of this study were to develop WC percentiles, to determine if WC is associated with metabolic risk, and to compare our WC percentiles with those reported in the 2007–2010 National Health and Nutrition Examination Survey (NHANES).
Methods
Data for the present study were derived from a follow-up school-based study performed from 2011 until 2014 and aimed to evaluate cardiovascular risk factors. All enrolled subjects were permanent Koya residents of SAC. Because none of the parents had any history of intermarriage with other ethnic groups in their family trees, the group was ethnically homogeneous. All children were selected from the three SAC elementary schools in order to avoid selection bias. Study design and sampling are reported elsewhere7,13 and will be summarized here.
SAC is a town with a population of 4274 inhabitants. 14 We covered SAC and its suburbs, which included 35% of the children from the towns of Rosario de Lerma, La Poma, and Los Andes. The villages were Aguadita de Lacay, Muniano, Tres Cruces, El Toro, El Palomar, Tipan, Cerrillos, and Cangrejillos. Data were collected by means of proportionate, stratified, random sampling, taking into account the location (region) and the number of students, according to age and gender. Given the limitations of funds and manpower, we could not evaluate children from other provinces.
Exclusion criteria included (1) measures of anthropometry not being performed; (2) not fasting for at least 12 h; (3) the use of medication that would affect blood pressure, glucose, or lipid metabolism; (4) and the informed consent form not being signed. The study was approved by the Human Rights Committee of the Salta Health Ministry. Data were collected on children from whom written informed parental/guardian consent was obtained (89% response rate). A total of 120 children (57 boys and 63 girls, 9.74% of sample size) were not included, as they met the exclusion criteria. Therefore, a cross-sectional study of 1232 (606 boys) indigenous children with an age range of 5–14 years was performed.
Given that the prevalence of overweight/obesity was approximately 8.1% among children in SAC, 7 the sample size was estimated to achieve that percentage with an error less than 0.02 with 95% confidence. Chronological age was calculated as the decimal age by subtracting the observation date from the birth date. Height and weight were measured with subjects wearing light clothing and without shoes. Weight was measured to the nearest 0.1 kg on a medical balance scale. Height was measured to the nearest 0.1 cm with a wall-mounted stadiometer.
WC was measured with a nonstretchable tape at the midpoint between the lowest rib cage and the iliac crest, to the nearest 0.1 cm, at the end of a gentle expiration. 15 The circumference was measured without clothing. The NHANES has proposed the 90th percentile as the cutoff for identifying central adiposity. 16 Because of the similarity between our WC measurement methodology and that of the NHANES, we compared our WC data with 2007–2010 NHANES data. 16 Children were classified as normal weight (BMI <85%), overweight (BMI ≥85%–<95%), or obese (BMI ≥95%) according to CDC norms. 17 Blood samples were obtained from subjects after a 12 h overnight fast for measurement of glucose, insulin, and lipid levels. All samples were analyzed in a single laboratory. We report the measurement methods in detail elsewhere.7,13 Lipid abnormalities were defined according to the reference standards from the American Heart Association which recommends TG concentrations of ≥150 mg/dL and high-density lipoprotein cholesterol (HDL-C) ≤35 mg/dL be considered abnormal for children. 18
Statistics
Descriptive statistics for raw variables are presented as mean ± standard deviation. Chi-squared tests were used to compare proportions. When more than 20% of the cells had expected frequencies <5, a Fisher's exact test was used. When comparing two groups with normally distributed data, Student's t test was performed. When the homogeneity of the variances could not be proven, the Brown Forsyth test was used. Variables with an asymmetric distribution were log transformed for analysis. Bonferroni's adjustment was carried out when many comparisons were performed. Sex-specific reference percentiles were computed using the LMS method.19,20 Each variable of interest was summarized by three smooth curves plotted against age representing the median (M), coefficient of variation (S), and skewness (L) of the measurement distribution. 21
Models were checked for goodness of fit using detrended Q-Q plots. 21 For comparison with the 2007–2010 NHANES, we obtained NHANES data for all US racial/ethnic groups from published sources. 16 To measure the strength of association between two variables, Spearman coefficients were used. Separate multiple logistic regression analyses were performed to examine the relationship between the high TG and low HDL-C as the dependent variables and WC, age, and gender as the independent variables. Observed associations were expressed as odds ratios (OR) and 95% confidence intervals (CI). P values <0.05 were considered statistically significant. Analyses were performed using SPSS 20.0 (Chicago, IL) statistical software package.
Results
Clinical and Metabolic Characteristics According to Gender
Of the 1232 children (606 boys), age range 5–14 years, 70 (5.7%) were underweight, 1016 (82.5%) normal weight, 102 (8.3%) overweight, and 44 (3.6%) obese. The prevalence of high TG was 23.9% (294) and of low HDL-C was 13.5% (166). There was not a significant difference in the prevalence of overweight/obesity between genders. Table 1 shows clinical and metabolic characteristics of the children according to gender. Glucose levels were significantly lower in girls than in boys. However, mean BMI percentiles, TG, and insulin levels were significantly higher in girls than in boys. There were not significant differences in mean age, WC, and HDL-C levels between genders (Table 1).
Clinical and Metabolic Characteristics by Gender a
Data are expressed as media ± SD.
p < 0.0.5
p < 0.01.
HDL-C, high density lipoprotein cholesterol; TG, triglyceride; BMI, body mass index; WC, waist circumference; LMS, Lambda-Mu-Sigma method; Z, Z-score is a quantitative measure of the deviation of a specific variable taken from the mean of that population. In particular, CDC Z-BMI and Z-Height take into account age and sex.
Clinical and Metabolic Characteristics According to Central Obesity
Children were divided according to WC percentiles into four groups: WC percentile ≤50th; WC percentile >50th and WC percentile ≤70th; WC percentile >70th and WC percentile ≤90th; and WC percentile >90th (Table 2). There was not a significant difference in age, gender, or mean cholesterol levels between groups. However, mean levels of height, BMI, TG, HDL-C, glucose, and insulin were significantly different between groups. Insulin levels increased more than twofold from the lowest WC percentile (≤50th) to the highest WC percentile (>90th).
Clinical and Metabolic Characteristics According to Central Obesity a
Data are expressed as media ± SD.
p < 0.05.
p < 0.01.
HDL-C, high density lipoprotein cholesterol; TG triglyceride; BMI, body mass index; WC, waist circumference; LMS, Lambda-Mu-Sigma method; Z, Z-score is a quantitative measure of the deviation of a specific variable taken from the mean of that population. In particular, CDC Z-BMI and Z-Height take into account age and sex.
Waist Circumference Percentiles According to Age and Gender
Descriptive statistics for WC by age and sex groups are shown in Table 3 and in Figures 1 and 2. In general, WC increases in both males and females, with similar mean values for males and females. Figure 1 shows the smoothed LMS curves for the 5th, 10th, 25th, 50th, 75th, 80th, 90th, and 95th percentiles of WC for Koya boys. Figure 2 shows the smoothed LMS curves for the 5th, 10th, 25th, 50th, 75th, 80th, 90th, and 95th percentiles of WC for Koya girls.

Smoothed percentile curves and smoothed Lambda-Mu-Sigma method curves for the 5th, 10th, 25th, 50th, 75th, 80th, 90th, and 95th percentiles of waist circumference for indigenous boys.

Smoothed Lambda-Mu-Sigma method curves for the 5th, 10th, 25th, 50th, 75th, 80th, 90th, and 95th percentiles of waist circumference for indigenous girls.
Values for the 5th, 10th, 25th, 50th, 75th, 80th, 90th, and 95th Percentiles for Boys and Girls
Comparison of the 90th WC Percentiles between Indigenous Children and Those from the United States (NHANES)
Comparisons of the age- and sex-specific 90th WC percentiles between Koya boys and those from NHANES are shown in Figure 3. Compared with the 90th percentile cutoff proposed by NHANES WC percentiles, WC values of children in the present study were lower by an average of 11.05 cm for girls and 12.66 cm for boys.
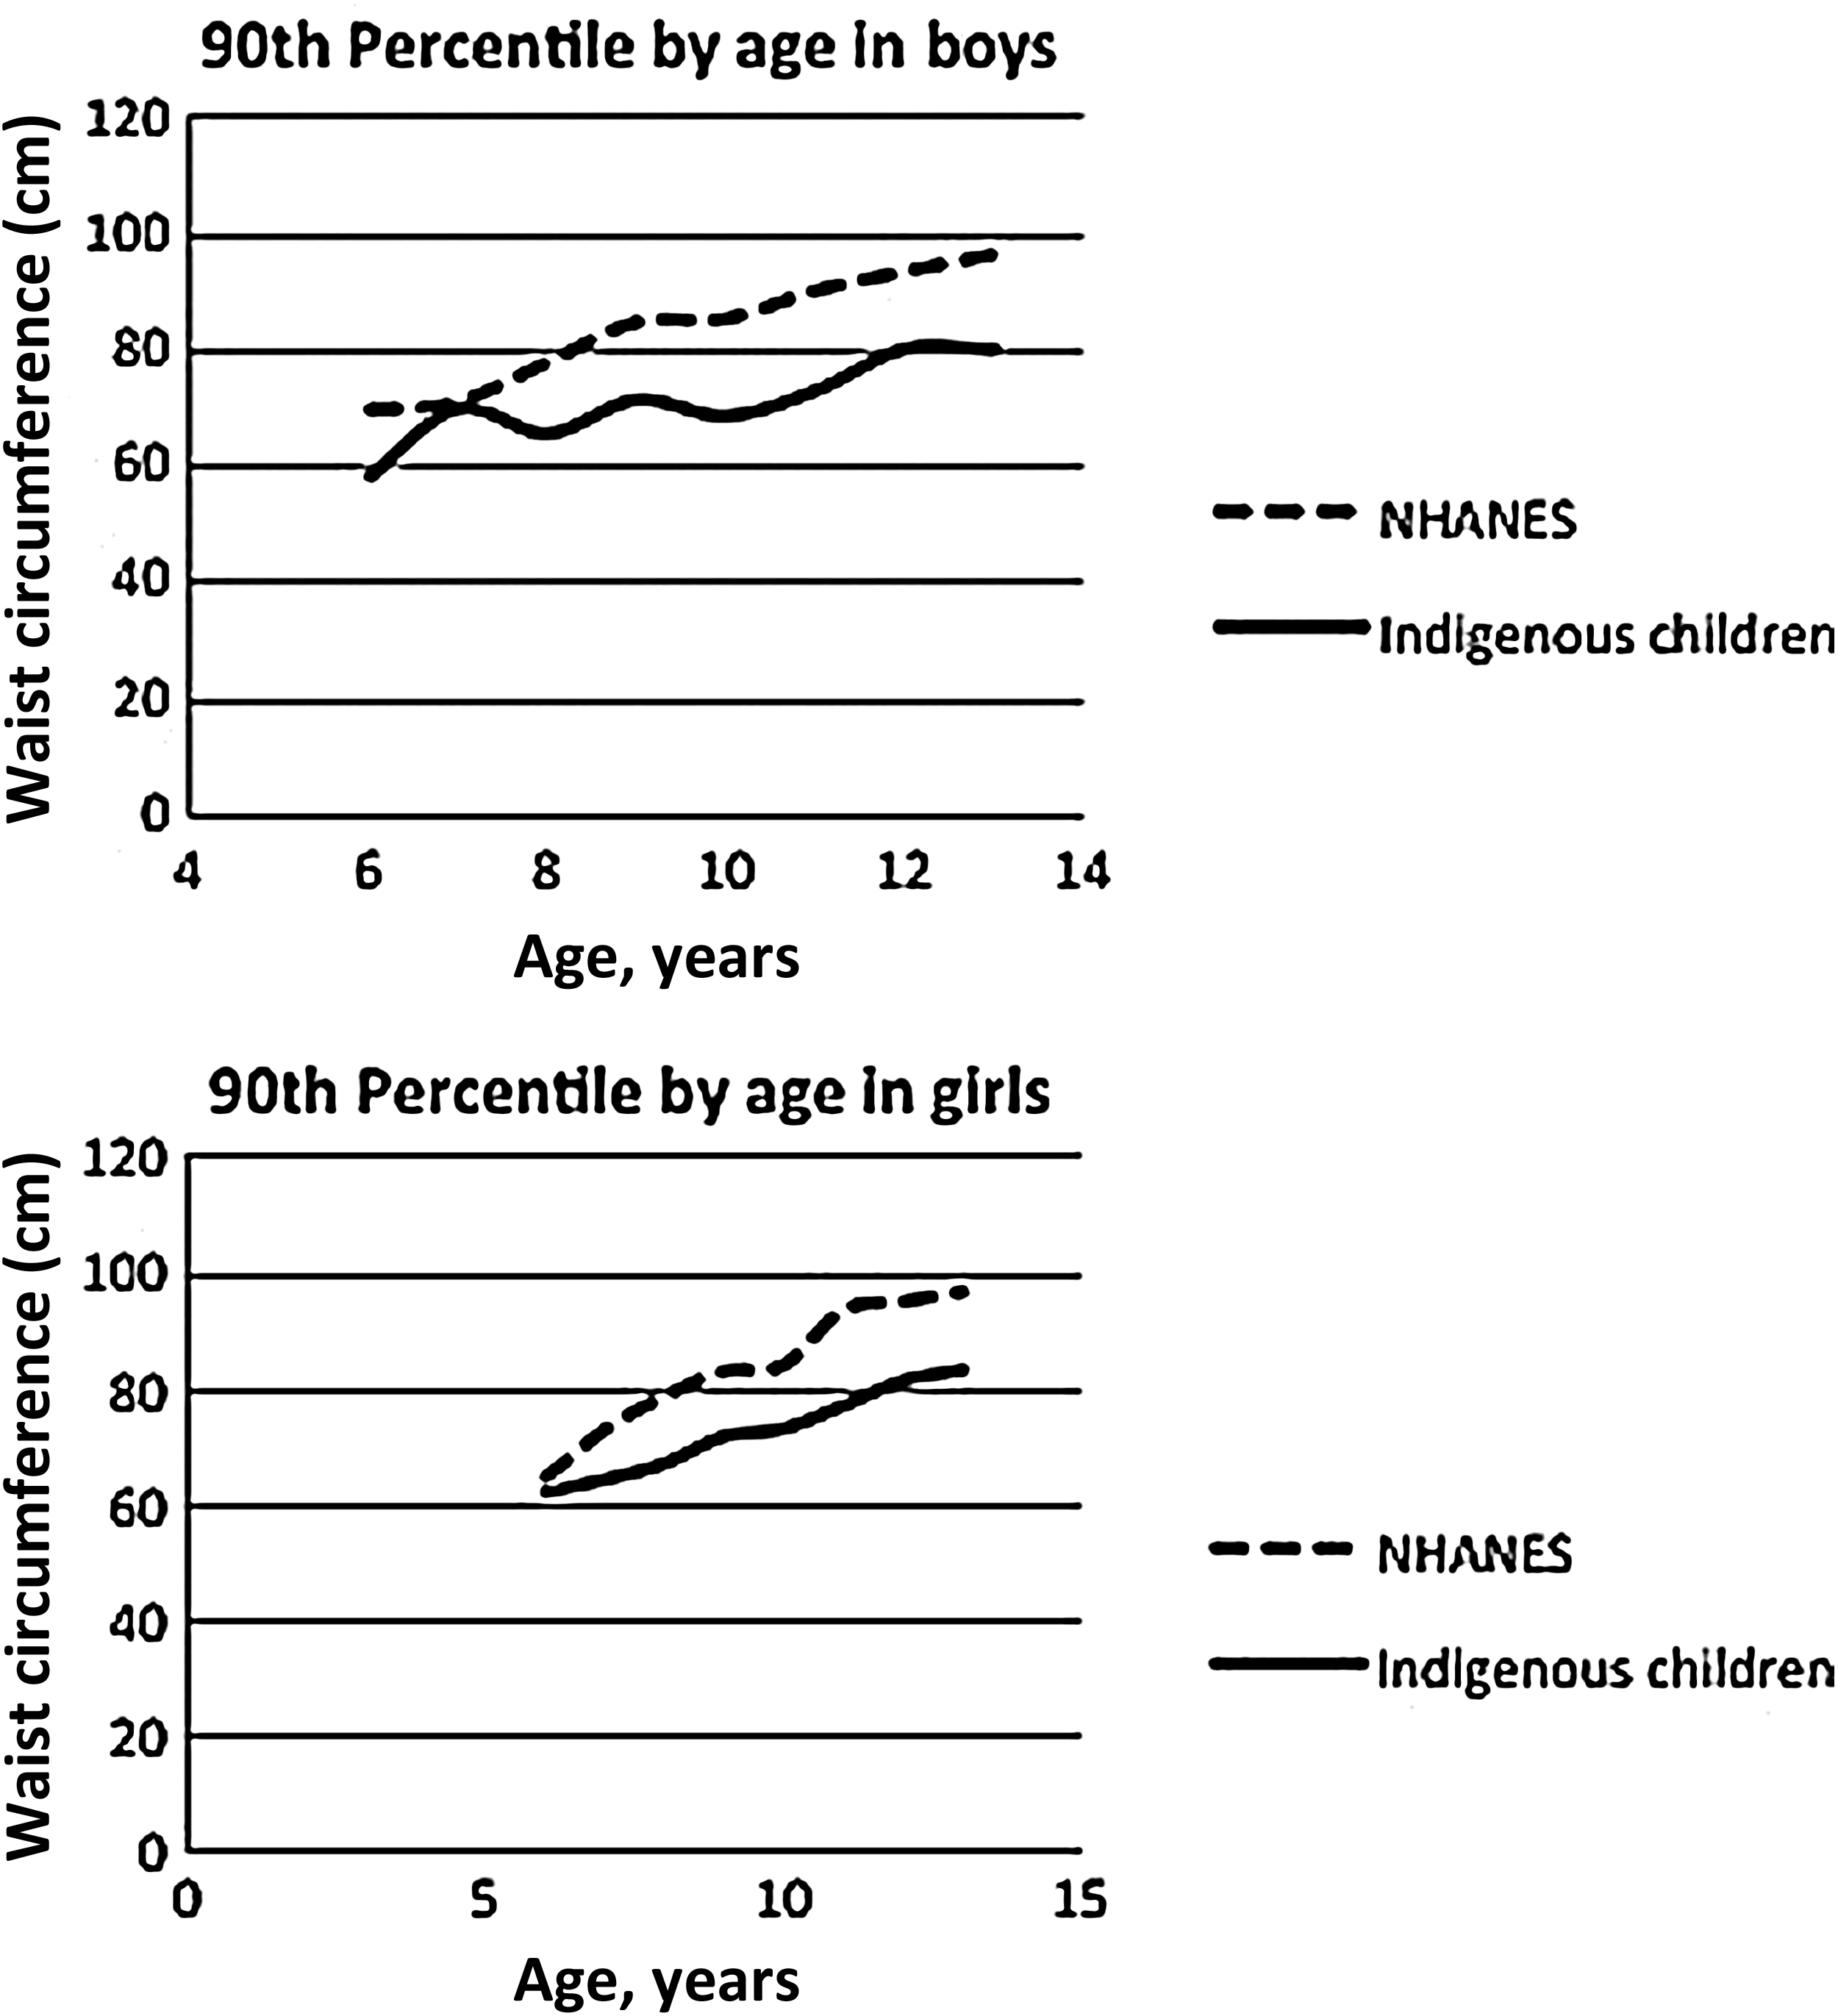
Comparisons of age- and sex-specific 90th percentile waist circumference between Koya children and those from National Health and Nutrition Examination Survey.
Prevalence of Dyslipidemia According to Central Obesity
The prevalence of low HDL-C was 11.8% in children with WC ≤50th, 10.3% in children with WC >50th–70th, 17.5% with WC >70th–90th, and 21.3% with WC >90th. The prevalence of high TG was 19.5% in children with WC ≤50th, 19.9% with WC >50th–70th, 28.8% with WC >70th–90th, and 39.7% with WC >90th. There was a significantly higher prevalence of dyslipidemia as WC percentiles increased (Figure 4).

Prevalence of dyslipidemia according to waist circumference percentiles.
Univariate and Multivariate Analyses
Univariate analysis showed an inverse association between WC percentiles and HDL-C concentration (r −0.14; p < 0.01). In addition, direct correlations were found between WC percentiles and TG (r 0.10; p < 0.01) and insulin levels (r 0.32; p < 0.01). No significant association was found between WC percentiles and total cholesterol or glucose levels.
Multiple logistic regression models showed that high TG values were significantly associated with WC [OR, 1.05 (95% CI 1.03–1.08)], adjusted for age and gender. Furthermore, low HDL-C was significantly associated with WC [OR, 1.04 (95% CI 1.01–1.06)], adjusted for age and gender.
Discussion
For the first time in the literature, this study presents reference data for WC percentiles for Koya indigenous children aged 5–14 years old. Our data can be added to the existing international reference values for WC of children and adolescents. Compared with the NHANES 2007–2010 WC percentiles, our WC values were lower. 16 These differences possibly reflect the highly variable nature of central adiposity in children, which might be related to genetic factors, ethnicity, or altitudes. To our knowledge, no previous study has developed WC reference data for Koya indigenous children according to age and gender.
Obesity increases the risk of a number of health conditions including adverse lipid concentrations and insulin resistance. 22 The prevalence of obesity in the United States began to increase during the last decades of the 20th century. 23 Almost 17% of children and adolescents in the United States were obese in 2009–2010. 24 In contrast, only 3.5% of the indigenous children in this study were obese.
Studies have shown that obesity prevalence is inversely associated with elevation.5–7 A number of variables could explain the lower prevalence of obesity in individuals living at high altitudes. Socioeconomic conditions, lifestyle behaviors, and ethnicity could be associated with the inverse association between obesity and elevation. Most of these children live in poverty at very low temperatures with limited access to a wide range of foods.7,13 One possible explanation is that reduced temperature at increased elevation may lead to weight loss through catabolic effects. 5 Exposure to hypoxia has been shown to stimulate the hypoxia inducible factor 1, which appears to be an important regulator for the expression of the leptin gene 25 which may be related with the low prevalence of obesity. Furthermore, the increased sympathetic tone at high altitudes may alter blood flow to the gut and thereby decrease appetite. 26 However, despite significant research into the environmental determinants of obesity, including the built environment, the reason for these macrogeographic differences is still unclear.
We present for the first time WC reference data for Koya children aged 5–14 years old. These data provide useful baseline information required to monitor trends and factors associated with central obesity in children and adolescents and could be compared with WC percentiles of other communities.9–12 Previous studies demonstrated that children with WC >90th percentile (central obesity) were more likely to have multiple risk factors for metabolic and cardiovascular disease. 27 Despite the fact that direct comparison should be avoided with other studies that used different WC measurement protocols, our results show that the shape of the percentile curves for Koya children seems to be quite similar to NHANES. 16 However, a comparison of the age- and sex-specific 90th WC percentiles between indigenous and US children ( NHANES) showed that WC values of indigenous children were lower.
WC is increasingly used for screening for central obesity and cardiovascular risk in children. 27 We have previously demonstrated that WC in Argentinean nonindigenous children showed a significant correlation with insulin resistance, 28 and therefore might be a valuable tool for identifying children at risk of developing metabolic and cardiovascular complications. 29
The present research found a high prevalence of dyslipidemia. Furthermore, dyslipidemia increased significantly as WC percentiles increased. Consistently, a previous study showed that children with central obesity have a higher risk of having low HDL-C (26.3% vs 18%) and high TG (23% vs 15%) compared with their peers with lower WC. 30 Diverse factors, such as genetics, chronic hypoxia, diet and lifestyle behaviors could have an influence on the high dyslipidemia rates of high-altitude natives. 4
High altitude has been reported to be associated with risk factors for cardiovascular disease (CVD), 31 and dyslipidemia plays an important role in the onset and progression of CVD. A study done in Cuzco, Peru (3380 m above sea level) found a stroke prevalence rate close to that of developed countries, indicating that CVD is a healthcare problem in high-altitude populations of Peru. 32 Consistently, approximately half of the adults living at 1500–2500 m above sea level on the Yunnan-Kweichow Plateau in southwestern China suffer from dyslipidemia. 33 In this study, the prevalence of hypertriglyceridemia was 34.1% and of low HDL-C was 17.5%. 33 Moreover, based on the basic information available from southwestern China hospital records, there are approximately three deaths from CVD each day, and a mortality rate of 50% in 2009. 33 Data from genetic studies support the hypothesis that hypoxia could mediate the effects of altitude on human physiology, including lipid metabolism. Hypoxia inhibits oxidative phosphorylation and stimulates the oxygen signaling pathway through the hypoxia inducible factor 1α, suggesting that high-altitude populations may display a genetic adaptation to hypoxia via the hypoxia inducible factor pathway. 34 Given the high prevalence of dyslipidemia and the low prevalence of obesity in this impoverished high-altitude community, changes in lifestyle including decreased physical activity and the consumption of a more Westernized diet would likely increase the prevalence of CVD-related mortality.
The main limitation of this study is the lack of pubertal stage among the covariates, with consequent use of age ranges as surrogates of prepubertal and pubertal stages. In addition, it was a cross-sectional study, and thus the directionality of the associations cannot be established. Finally, the results of this study, conducted in a sample of indigenous children, may not be directly extended to children of other ethnic groups without confirmation. The strengths of the present study were the large number of indigenous children included and the fact that all data were collected through measurements taken by our team rather than self-reported.
Conclusion
In the present study we present for the first time WC reference data for indigenous Koya children aged 5–14 years old. There was a significant association between WC and cardiovascular risk in this community. Compared with the NHANES 2007–2010 WC percentiles, our WC values were lower. 16 The lower socioeconomic status of Koya children limits the ability of many to receive adequate healthcare, and WC percentiles may be a useful tool for cardiovascular disease prevention in indigenous Argentinean children living at high altitudes. Further longitudinal studies should be performed to confirm these findings.
Author Disclosure Statement
No competing financial interests exist.