




Abstract
Abstract
Background:
The increased prevalence of childhood overweight and obesity across the United States and the Pacific has become a serious public health concern, with especially high prevalence among Native Hawaiian and Pacific Islander (NHPI) children. This study aimed to measure the effect of a Head Start (HS) policy intervention for childhood obesity prevention.
Methods:
Twenty-three HS classrooms located in Hawaii participated in the trial of a 7-month policy intervention with HS teachers. Classroom- and child-level outcome assessments were conducted, including: the Environment and Policy Assessment and Observations (EPAO) of the classroom environment; plate waste observations to assess child intake of fruit and vegetables; and child growth.
Results:
The intervention showed a positive and significant effect on classroom EPAO physical activity (PA) and EPAO total scores. Although mean BMI z-score (zBMI) increased at postintervention for both intervention (mean = 0.60; standard deviation [SD], 1.16; n = 114) and delayed-intervention groups (mean = 0.35; SD, 1.17; n = 132), change in zBMI was not significantly different between the groups (p = 0.50; p = 0.48).
Conclusions:
These findings contribute evidence on the potential for HS wellness policy to improve the PA environment of HS classrooms. More research is needed to link these policy changes to other child outcomes.
Introduction
The increased prevalence of childhood overweight and obesity (OWOB) across the United States and the Pacific has become a serious public health concern.1–3 Childhood OWOB, defined as having a BMI for age above the 85th percentile, contributes to an increased risk for cardiovascular disease, diabetes, cancer, and adult OWOB.4–8 Especially high prevalence of childhood obesity has been observed among Native Hawaiian and Pacific Islander (NHPI) children. The highest concentrations of NHPIs in the United States reside in Hawaii9,10 and up to 39% of children entering kindergarten in Hawaii are overweight and obese.11–13
Multiple factors (e.g., personal habits, family and neighborhood resources, and the built environment) contribute to weight status. Interventions to address childhood obesity should be based in venues that influence the child, such as child care centers (CCCs), where nearly half of US children under 5 years of age spend up to 22.5 hours per week.14,15 Children at these centers consume up to two thirds of their daily nutritional needs through meals and snacks provided under the federal Child and Adult Care Food Program (CACFP). 14 The Institute of Medicine (IOM) 16 and other bodies recommend a number of policies at CCCs for obesity prevention, including CCC policies that support fruit and vegetable (F&V) availability and intake, encourage physical activity (PA), limit marketing of unhealthy foods to children, limit screen time, promote adequate sleep, and monitor the growth of young children.16,17 Many states in the United States have made progress toward implementing CCC licensing requirements that address the role of CCCs in preventing childhood obesity, but such licensing requirements are not currently in place in Hawaii. 18
Head Start (HS) is a federally funded preschool program serving low-income children 3–5 years of age across the United States and its jurisdictions. 19 HS programs must adhere to federal regulations, known as Head Start Program Performance Standards, which include some policies related to health and nutrition, as well all other applicable local CCC licensing requirements. Some states have created licensing policies targeted specifically toward childhood obesity prevention through nutrition and PA regulations, but these are not in place in Hawaii. HS participation has been associated with healthy changes in child BMI and obesity. 20 However, simply having a policy in place does not guarantee that the policy is implemented. HS teachers have an influential role in assuring compliance with nutrition policies, thus serving as a potential leverage point for implementation of obesity prevention policy.18,21
Research suggests that implementation of CCC-based policy interventions can have a positive impact. Tooty Fruity Vegie, the Nutrition and Physical Activity Self-Assessment in Child Care, Encouraging Healthy Activity and Eating in Childcare Environments, Romp N Chomp, and Georgia's Department of Early Care and Learning (DECAL) intervention22–31 all were effective at altering the CCC environment. However, only two studies included child outcome assessments (dietary intake or growth), and three relied on self-reported data for environmental assessments. 32 Of the two interventions that assessed child outcomes,27,29 one was able to demonstrate a significant, positive effect of a policy intervention over 7 months on child BMI z-score (zBMI) in a sample of 209 children. 29
Intervention strategies to successfully implement new wellness policies have included training and technical assistance for new policy implementation,24,28,29 training and technical assistance with employee wellness activities, 30 collaborative approaches to policy intervention planning with training and technical assistance and employee wellness activities, 22 and community-based participatory research methods for intervention planning. 32
The primary aim of this study was to build evidence on the effectiveness of a CCC-based intervention that used training and technical assistance and employee wellness activities in collaboration with HS teachers to help with the implementation of HS wellness policies for childhood obesity prevention in Hawaii. We hypothesized that the training and technical assistance and employee wellness activities would result in changes at postintervention in class-level nutrition and PA environmental scores and child-level outcomes, zBMI, or fruit and vegetable intake.
To date, CCC policy interventions have not been tested in NHPI populations. This study tested a wellness policy intervention on the CCC environment and on child outcomes in a predominantly NHPI population.
Methods
Settings and Study Population
This research was embedded within the randomized community trial, the Children's Healthy Living Program for Remove Underserved Minority Populations in the Pacific Region (CHL). 33 Communities for the research project were chosen from four randomized CHL communities in Hawaii and included one CHL intervention and one CHL delayed-intervention community on the island of Oahu. HS classrooms located within these two Oahu CHL communities were included in the study. For administrative purposes, HS manages their classrooms by geographical cluster. Additional HS classrooms located within the same geographical school cluster as the selected CHL study communities were also included in the present study, resulting in a total of 23 HS classroom from 18 HS centers (note: five HS centers had two classrooms). Figure 1 shows the 11 HS classrooms located in one cluster area that made the intervention group (where CHL was conducting additional intervention activities) and the other 12 HS classrooms in another cluster the delayed-intervention group (where no study nor CHL intervention activities were conducted during this period).
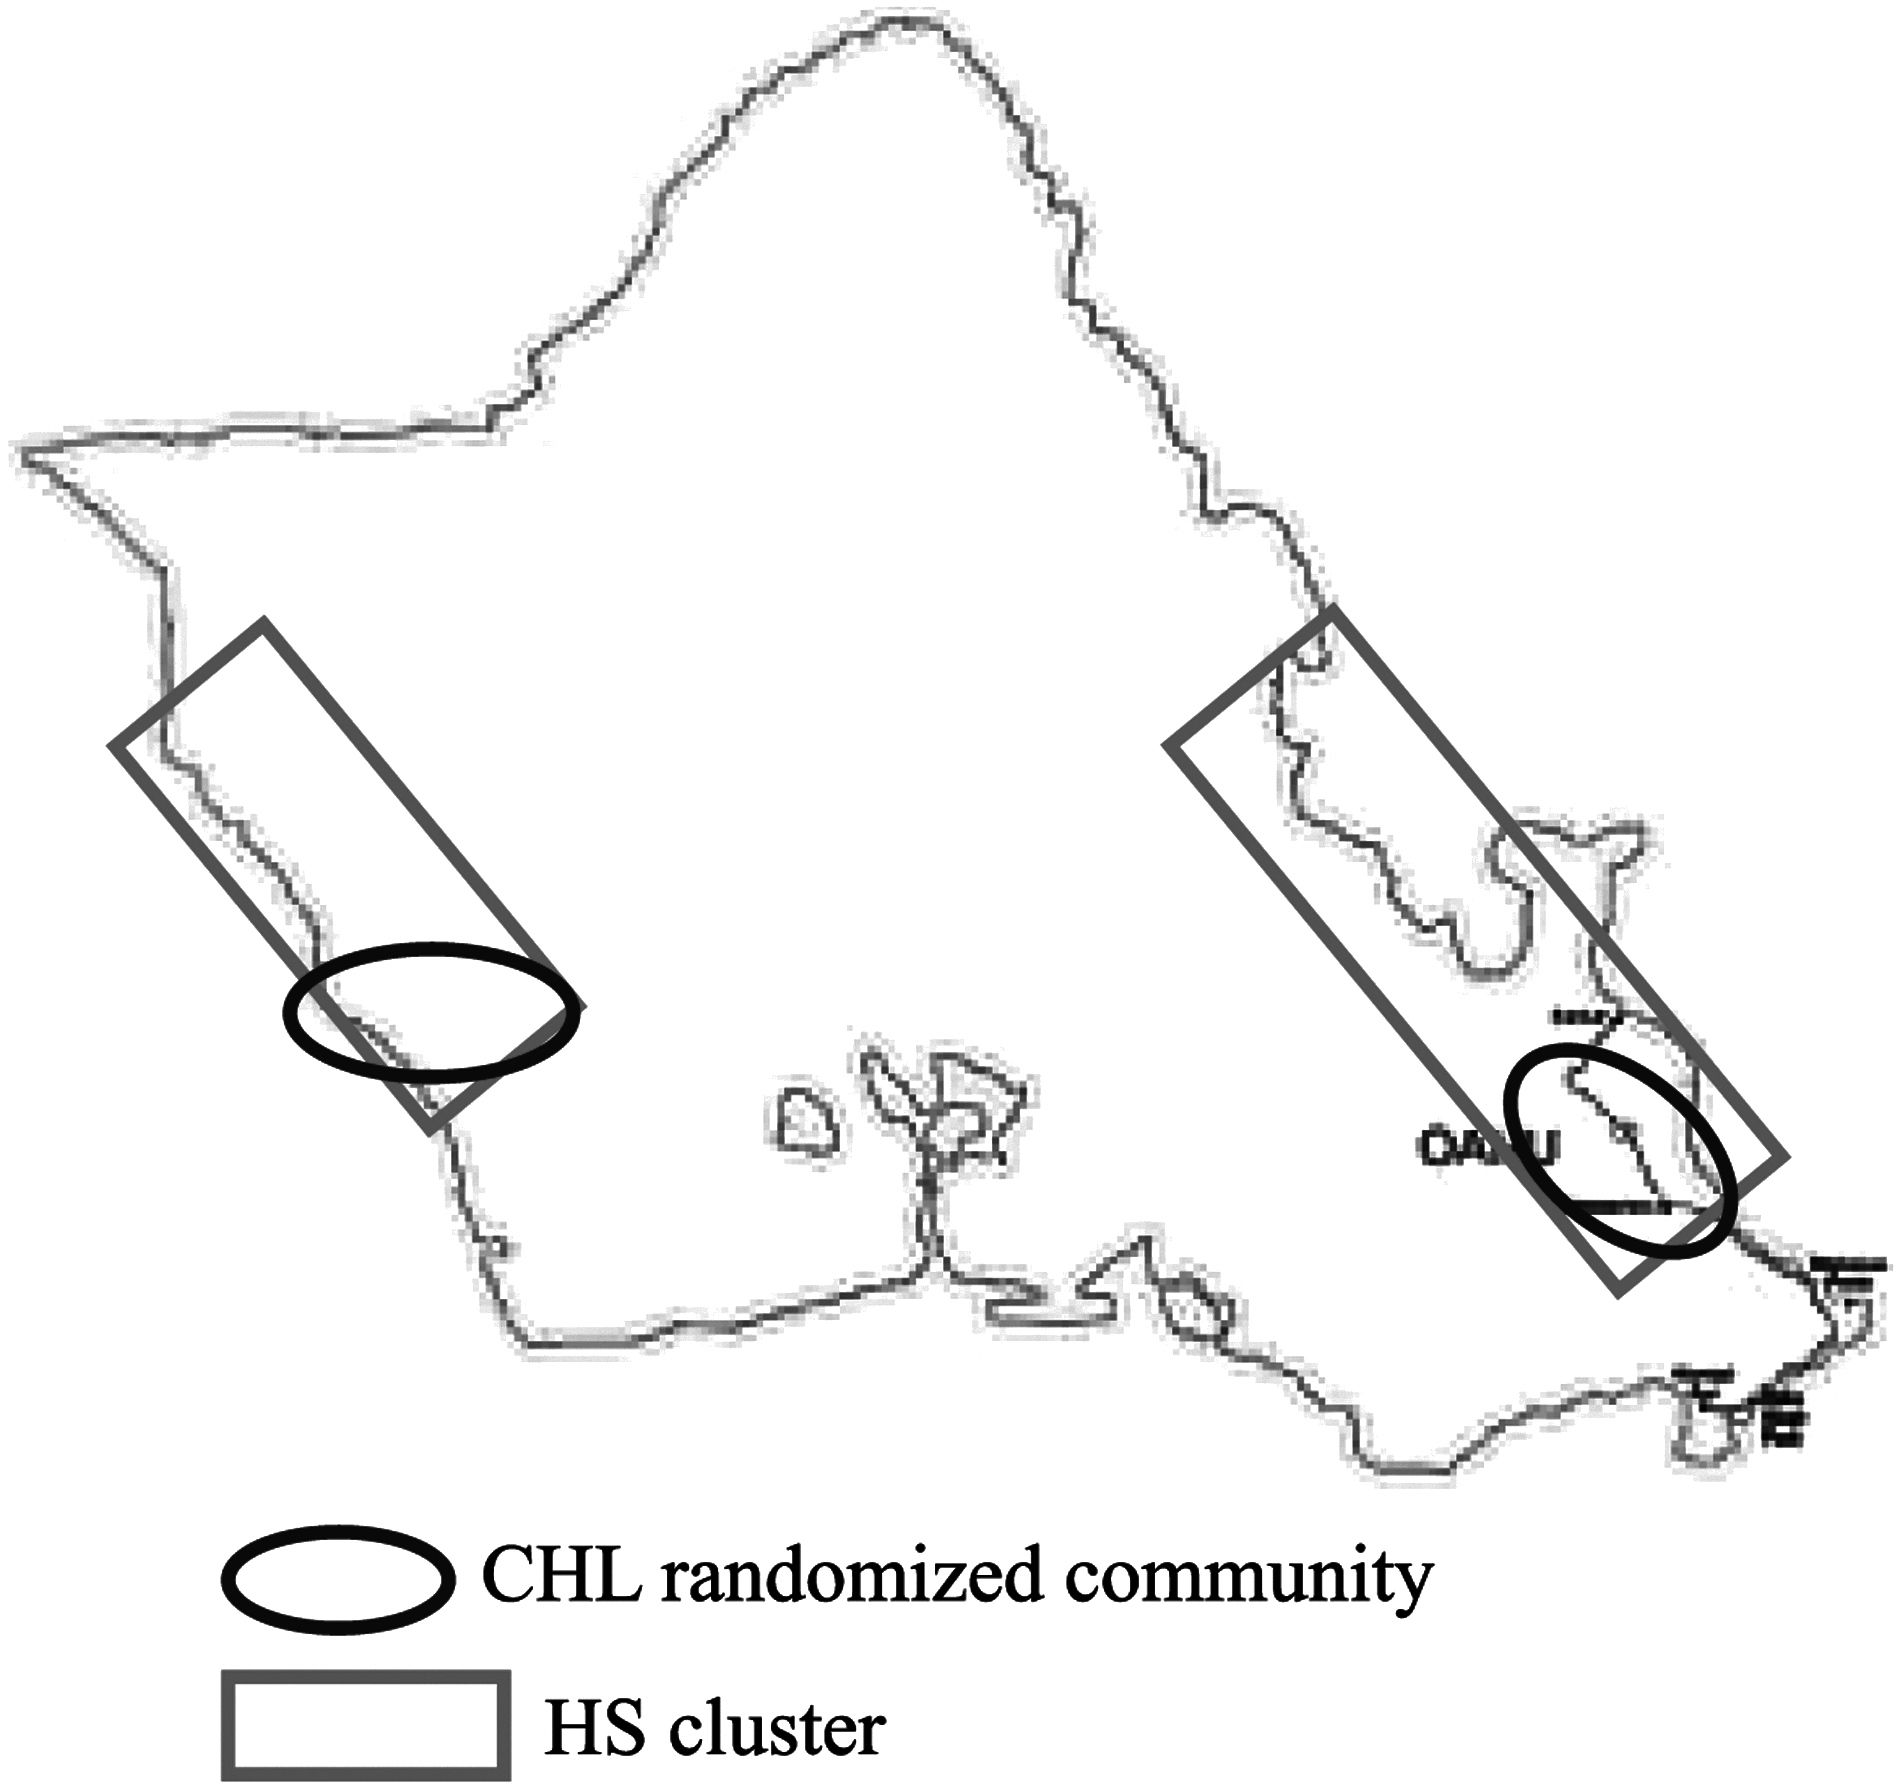
Geographical map of Children's Healthy Living Program (CHL) Hawaii randomized communities and Head Start (HS) geographic clusters used in this study.
All teachers completed informed consent to participate. Children from the 23 HS classrooms were recruited to participate at HS orientation meetings and at their classrooms by the researcher and/or HS teacher. Parents of children at HS completed the child consent form. The institutional review board at University of Hawaii at Mānoa approved this study.
The intervention was developed based on findings from focus groups conducted with HS teachers. 34 Policy implementation was supported through (1) monthly employee wellness activities for teaching staff, (2) resources for classroom nutrition and PA activities in the form of monthly lessons from the “Healthy Habits for Life” curriculum, and (3) monthly family newsletters. Healthy Habits for Life was previously found to have a positive effect on child BMI when delivered in a CCC setting, and the intervention transmitted lessons from this curriculum related to increasing PA and eating F&Vs. 35 To implement the policy, intervention, HSs eliminated juice from breakfast, lunch, and snacks and established family-style meal service. Training and technical assistance also was provided to teachers for implementing family-style meal service and communicating child BMI and growth information with parents of overweight and obese children. Policy implementation started in October, the second month of the HS program year, immediately after baseline data collection.
Measures
The effects of the policies and implementation strategies on the classroom environment were assessed with the Environment and Policy Assessment and Observation (EPAO) tool and on the HS children with BMI and dietary intake. The EPAO instrument is a validated tool that was used to objectively and quantitatively assess the obesogenic environment of the participating HS classrooms; it includes assessments of both nutrition and PA-related factors. 36 The EPAO protocol described elsewhere consists of a full-day visit to a CCC with direct observations and review of documents. 36 For example, the EPAO prompts the observer to record the presence or absence of televisions, the number of minutes during the day that more than half of the children are sedentary, whether or not teachers joined in active play, and whether the teacher is sitting eating the same foods as the children at meals. Documents reviewed include counting the number of times various foods are provided using the school menu and nutrition education or curriculum being present on a lesson plan. The strength of this tool is its objectivity and comprehensiveness. In both the intervention and delayed-intervention HS, EPAOs were completed by research interns who received one half-day training with the lead investigator on completing an EPAO and who were blinded to the treatment group of the classrooms being observed. One or two research interns simultaneously observed each of the delayed-intervention and intervention classrooms for 1 day at baseline, April–May 2013, and again at the end of the HS program year April–May 2014.
In both intervention and delayed-intervention HS, child demographic forms were collected with sex, age, date of birth, and race information from the parent or guardian at the time of consent or enrollment into the study.
Dietary intake of children was assessed by observed plate waste, as recommended by the IOM's plan for measuring obesity prevention efforts.37,38 Children were provided with their typical lunch tray, with study identification number on the tray. The researcher collected all labeled lunch trays and recorded the percent of food remaining on the child's plate as 100%, 75%, 50%, 25% or less, or none for F&V servings. The dietary assessment method chosen for the study did not measure child F&Vs consumed outside of the HS classroom or consumption of other food items. Because the objective of the research project was to quantify the effect of policy change on the CCC environment and the effect those changes had on child diet intake, it did not focus on altering child diet intake outside of the classroom, which was assumed to be held constant. Child dietary intake in the classroom was the primary outcome of interest.
Height in centimeters and weight in kilograms of children were measured in intervention and delayed-intervention classrooms at the start and end of the HS program year. Child height was measured by a Portable Adult/Infant Measuring Unit stadiometer (Model PE-AIM-101; Perspective Enterprises, Portage, MI) to the nearest 0.1 cm. Child weight was measured using a portable SECA 876 scale (SECA 876; Seca GmbH & Co., Hamburg, Germany) to the nearest 0.1 kg. Three measurements of each anthropometric measure were taken and recorded on an anthropometric recording sheet. If no two measures among the three readings were within 0.2 units of one another (0.2 cm for height and 0.2 kg for weight), more readings were taken again until there were at least two measures within 0.2 units. Protocols for anthropometry were developed following previously published and standardized references.39,40
BMI was calculated using the measured mean height and weight. Child BMI variables were calculated based on 2000 CDC Growth Charts, BMI for Age and Sex. zBMI and change in zBMI over the program year were calculated to measure change in BMI status, adjusting for age and sex.
Statistical Analysis
Descriptive statistics estimated frequencies of child and classroom demographics and intervention activities. t-tests or chi-square tests were conducted to compare child-level baseline demographic characteristics between the intervention and delayed-intervention groups. Because there were significant differences in child's race distribution, race was included in subsequent mixed linear models and multiple regression models as potential confounders. Preintervention classroom-level nutrition and PA policies, practices, and observations (i.e., EPAO, BMI, and F&V consumption) were compared between the intervention and delayed-intervention classrooms using independent samples t-tests.
Mixed linear regression models were estimated to assess child-level zBMI change outcomes and F&V consumption to account for clustering, controlling for child's race. Multiple regression models were used to assess center-level outcomes in nutrition and PA practices between the intervention and delayed-intervention classrooms, controlling for baseline scores. The paired t-test was used to assess classroom-level changes. Statistical significance for all tests were set at p < 0.05 for two-tailed tests. All statistical tests were conducted using SAS© software (version 9.4; SAS Institute Inc., Cary, NC).
Results
The child sample included 349 children from the 23 classes from 18 HS centers (n = 173 in intervention HS and n = 176 in delayed-intervention HS). Ages ranged from 2 to 5 years of age, with the majority of the sample made up of 3- and 4-year-olds (44% and 47%, respectively), and 46% were girls. All participating children had information on race: 9% were Asian, 62% were more than one racial group, 23% were NHPI, and 6% were white. No significant difference was found between the intervention and delayed-intervention group in child's sex and age distribution. However, the two groups differed significantly by child's race (chi-square [df] = 14.04(3); p = 0.003), with the intervention group having a higher percentage of NHPI (27.2%) and a lower percentage of whites (1.7%), compared to the delayed-intervention group (18.2% for NHPI and 10.2% for white).
Mean zBMI at baseline was significantly higher in the intervention group (mean = 0.51; standard deviation [SD] = 1.14; n = 154) than the delayed-intervention group (mean = 0.25; SD = 1.14; n = 166; t statistic [df] = −2.02(318); p = 0.04). Mean zBMI increased at postintervention for both intervention (mean = 0.60; SD = 1.16; n = 114) and delayed-intervention groups (mean = 0.35; SD = 1.17; n = 132); however, change in zBMI was not significantly different between the two groups (p = 0.50; p = 0.48). No significant differences were observed on mean zBMI between children measured only at the preintervention period (n = 87) and those measured at both pre- and postintervention periods (n = 233).
Average consumption of vegetables at baseline was 17.8% higher in the intervention group than the delayed-intervention group (t statistic [df] = 5.05(277); p < 0.001). No significant difference was found in mean consumption of fruit between the intervention and delayed-intervention classrooms (Table 1). The effect of the intervention on fruit consumption, controlling for baseline fruit consumption, was not significant (t = 1.71; p = 0.09; Table 2).
Frequency Distribution of Child BMI Category, Mean BMI Z-Score, Mean Fruit Consumption, and Mean Vegetable Consumption by Intervention and Control Group and Paired t Test Results for Differences between Pre- and PostIntervention Values
CDC BMI categories 0–4th percentile = underweight, 5–84th percentile = healthy weight, 85–94th percentile = overweight, and >95th percentile = obese.
Paired t test results baseline intervention versus control: t statistic = −2.02; p = 0.04.
Paired t test results baseline intervention versus control: t statistic = −5.05; p < 0.0001.
Results of Hierarchical Linear Mixed-Model a Testing Intervention Effect on Child Fruit Consumption Controlling for Baseline Fruit Consumption and Race
Controlling for baseline fruit intake and race.
SE, standard error.
EPAOs were completed at baseline and follow-up for all 23 classrooms. At baseline, no significant difference was observed between intervention HS classes and delayed-intervention HS classes in nutrition and PA environment, as assessed by the EPAO total score (intervention mean = 14.72; SD = 1.25; delayed-intervention mean = 14.32; SD = 0.59), EPAO nutrition score (intervention mean = 14.91; SD = 1.47; delayed-intervention mean = 14.30; SD = 0.96), and EPAO-PA score (intervention mean = 14.52; SD = 1.46; delayed-intervention mean = 14.33; SD = 1.33). Table 3 displays the linear regression results where, controlling for baseline scores, postintervention EPAO-PA score was 2 points higher (p = 0.002) in the intervention classrooms (mean = 16.5; standard error [SE] = 0.45) than in the delayed-intervention classrooms (mean = 14.3; SE = 0.43). Mean EPAO-PA scores in the intervention group increased 2.0 points from baseline to follow-up (p = 0.01); in contrast, there was no change in the delayed-intervention group (p = 0.88). Similarly, postintervention EPAO total scores were 1.03 points higher in the intervention classrooms than the delayed-intervention classrooms (p = 0.04), controlling for baseline EPAO total scores. Mean EPAO total scores in the intervention group increased by 1.05 points (p = 0.03); in contrast, there was no significant change in the delayed-intervention group (p = 0.47). No significant difference was observed in EPAO nutrition scores.
Covariate-Adjusted Means of Class-Level Environment and Policy Assessment and Observation (EPAO) Nutrition, Physical Activity (PA), and Total Scores at Postintervention, Comparing the Intervention and Control Classrooms a
General linear regression model adjusted for baseline values.
Global F test that at postintervention; the difference in means between the two groups is zero.
SE, standard error.
Discussion
This trial showed positive effects of a policy intervention on the HS PA environment. The policy intervention that included changes to meal service style and types of foods and beverages served did not, however, have a significant impact on the HS nutrition environment.
Other interventions have shown similar effects of policy interventions on CCC environments using the EPAO tool, where greater changes were observed in the PA components of the classroom environment than the nutrition components. In the DECAL study, significant effects of policy intervention on both the nutrition and PA components of the EPAO scores showed a smaller proportion of improvement in the nutrition subareas (2 of 8) compared with the PA subareas (5 of 8). 28 The current intervention included strategies that promoted PA with HS staff, through employee wellness activities, where the benefits of PA on health were discussed. It is plausible that this could have positively impacted some of the EPAO-PA scores, which include questions related to teacher participation in PA and the frequency and duration of PA. Other policy implementation strategies included providing classroom activities from Healthy Habits for Life, some of which supported PA through dance and poems.
It is plausible that some changes made to the nutrition policies, such as changes to meal service style and the removal of 100% fruit juice from the meals, were not large enough to create changes in the EPAO nutrition scores. For example, a classroom serving of 100% fruit juice up to once a week received the same score on the EPAO tool as a classroom serving no 100% fruit juice. At baseline and in many of the delayed-intervention classrooms, 100% juice may have already been limited in frequency of offering; therefore, the policy change of removing 100% fruit juice may not have had a measurable impact on the nutrition environment score.
Among the child-level outcomes assessed, the intervention had a positive effect on fruit consumption that approached significance, despite no measured improvement in the nutrition environment. Current CACFP regulations outline minimum servings of fruits and/or vegetables at meals and snacks, but do allow 100% fruit or vegetable juice to be served to meet the requirement. 14 The current intervention included a policy that removed 100% fruit juice from classroom menus, thus increasing the frequency of offering whole fruit at meals and snacks. This improvement in availability and the increase in offering contributed to the observed effect on fruit consumption. Previous studies have shown that repeated exposure to novel food items in this age group can improve dietary intake and can increase fruit intake. 41 Vegetable intake was significantly different between the two groups at baseline and, though intake slightly increased for both groups, the changes were not significant, nor was the difference between the two groups significant (Table 1). Children in the intervention group had a significantly higher mean zBMI compared to the control. This difference in body size may contribute to the difference in vegetable intake, because it is possible that the children with the higher zBMI were higher consumers of all food components at lunch.
No significant changes in child BMI were detected. Other studies in similar time frames (7–10 months) were able to detect these changes. However, those studies consisted of a substantially larger sample size (intervention group n = 1230, comparison group n = 19,050 vs. n = 357 in the current study). 32 The other study had a similar sample size to the present study (n = 209); however, the intervention was delivered on a larger scale, included family education components, and had more resources available to participating preschool centers than in the current study. 29
This study has some limitations. The reliance on single assessments of both classroom observations and child F&V intake is limiting. Repeated assessments were not within the resources allotted for the current study, but should be included in future investigations. Because F&V consumption were the only diet outcomes assessed, controlling for total intake of other meal components was not conducted. These data may have been able to demonstrate differences in consumption rates, controlling for total intake. In addition, the omission of family-level intervention and outcomes may have limited the intervention effects and conclusions. Whereas all families receiving HS benefits must meet certain income eligibility criteria, other family-level characteristics, such as parent education and weight status, could explain levels of childhood obesity and dietary intake found in this study.
Conclusions
In conclusion, the findings from this study demonstrate the effects of a preschool policy intervention for childhood obesity prevention on classroom-level outcomes, the first of its kind in Hawaii. Though no significant impacts on child-level outcomes were detected, a significant improvement was noted in the PA aspects of the classroom environments. These findings underscore the importance of making policy changes, but also support the inclusion of other intervention components to increase the likelihood of an effect on child-level outcomes. Holistic efforts that include the family and home environments and child motivation to make healthy choices in addition to policy changes may have a synergistic effect on child-level obesity outcomes.
Footnotes
Acknowledgments
This project is supported by the Agriculture and Food Research Initiative Grant (no. 2011-68001-30335) from the USDA National Institute of Food and Agricultural Science Enhancement Coordinated Agricultural Program, the staff of the Children's Healthy Living Program, and Honolulu Community Action Program Head Start Program
Author Disclosure Statement
No competing financial interests exist.