
Abstract
Abstract
Background:
Motivating Adolescents with Technology to CHOOSE Health™ (MATCH) has been provided for eight years in North Carolina middle schools with high obesity prevalence.
Methods:
Seventh grade teachers in two schools delivered MATCH lessons in 2009, with one control school. In 2013 students were remeasured and completed a health behavior survey. Outcomes include BMI, BMI z-score (zBMI), weight category, and self-reported behaviors. Comparisons used t tests (continuous measures), Fisher's exact test (categorical measures), and linear mixed models (trend between groups).
Results:
Of original participants, 104/189 (55%) of MATCH and 117/173 (68%) of control were remeasured. In the control group, retained participants had lower baseline BMI and were higher percent white. Among all participants, zBMI decreased in MATCH (mean change −0.15 with SD = 0.60) and increased in control (mean change 0.04 with SD = 0.52); between groups p = 0.02. In mixed models for the all overweight subgroup, MATCH had a downward trend in zBMI over time that was significantly different from control (slope MATCH −0.0036 versus control 0.0009; p = 0.01). For shifts in weight category: incidence of obesity was lower in MATCH (13%) versus control (39%); remission of overweight to healthy weight was greater in MATCH (40%) versus control (26%). MATCH participants self-reported lower frequency of intake of sweetened beverages and snacks and hours of weekday TV time than control students.
Conclusions:
MATCH participation can result in long-term prevention of obesity compared to control, with differences in self-reported health behavior changes to support an underlying mechanism for the observed BMI differences.
Introduction
Obesity remains an enormous health and economic threat worldwide, and trends show little to no improvement in prevalence in school-age children and adolescents. 1 Although it is generally agreed that schools should be an important part of the solution,2–4 the evidence for effectiveness is greater for younger children than adolescents, and there is no consensus yet about an optimal school-based intervention to promote sustained changes in health behaviors and BMI.5,6 However, several large studies have been completed with promising results.
In elementary schools the Coordinated Approach to Child Health (CATCH®) program addresses obesity through improvements in school environments and eating and physical activity behaviors. 7 Three-year follow-up studies of the randomized controlled trial on which the current program was originally based, the Child and Adolescent Trial for Cardiovascular Health, 8 showed success in select health behaviors, but no persistent differences in BMI or physiologic measures. 9 One- and two-year follow-up studies of adaptations of CATCH have been promising for reducing obesity in elementary grades.10,11 In middle schools, the Planet Health® intervention demonstrated some improvements in BMI in one subgroup of African American girls, 12 and a broader initiative that incorporated Planet Health as one component appeared to show schoolwide improvements in obesity and behavior measures. 13 More recently, the intensive HEALTHY study intervention in middle schools failed to show improvements compared to control in weight category or BMI measures. 14 Although there have been numerous studies of various sizes and approaches to intervention in this age group,15–18 no long-term studies of middle school interventions have been published, except for the early results of the Motivating Adolescents with Technology to CHOOSE Health™ (MATCH) program in one school. 19
MATCH was created by a teacher and implemented in 2006 based on the underlying premise that an effective strategy embedded within the school curriculum at a receptive age can result in behavior change and improved outcomes. Published findings from the pilot study of a single school with high obesity prevalence demonstrate improved BMI measures in both short- and long-term results when compared to a national comparison group.19,20 Since inception, the MATCH program has been iteratively improved and expanded to additional schools. In the 2015–2016 school year MATCH is in 32 North and South Carolina schools (28 and 4 schools, respectively) and two Mississippi schools.
As reported previously in a paper that described the original study justification and methods, MATCH was first expanded in spring 2009, with modest short-term results compared to control. 21 In this study we report the four-year follow-up results of this expansion of MATCH. Reported outcomes include BMI, BMI z-score (zBMI), and weight category changes after four years and cross-sectional health behaviors.
Methods
Study Design
The MATCH intervention is a combined educational-behavioral obesity intervention designed by a teacher and embedded in standard curriculum in the seventh grade.19,20 In 2009, MATCH was expanded using a quasi-experimental design. Details of the expansion and results have been described. 21 In brief, there was a convenience sample of three schools with a high percentage of low socioeconomic status and minority students, two in MATCH and one serving as control. Students at intervention schools received MATCH activities as part of their regular classes; students in the control school received standard curriculum. All students had height and weight measurements done prior to and after the program. No additional intervention activities occurred after seventh grade. The East Carolina University Medical Center institutional review board approved the study (#07–0741). Student assent and parent consent for participation in the research study were obtained at baseline. In 2013, additional recruitment of control subjects was undertaken for long-term follow-up. Eleventh grade students were recruited if they attended the control site and were measured in seventh grade but did not originally enroll.
For the MATCH intervention, trained teachers provided the majority of lessons in science classes (with some lessons in other classes) in a sequenced manner over 14 weeks. Key concepts were repeated and applied to enhance skill development in making healthy eating and physical activity choices. Educational technology resources were used as part of lessons to illustrate key points, such as students using web-based tools to plot their BMI and examine their nutritional intake and using spreadsheets and graphing software with their own data to view results for goal setting. At given intervals associated with lessons/goals, teachers provided pedometers and small, nonfood incentives (e.g., pens, water bottles). All or part of 26 core lessons/activities were taught at both intervention schools, with a few supplemental lessons provided at either school for a total of 30 and 26 lessons/activities, respectively. 21 Details of the intervention have been described previously.19–21 The MATCH program continued in subsequent years for seventh graders at the intervention schools and was implemented at the control school beginning in fall 2010.
Participant Recruitment: Intervention Participants
As previously described, prior to the start of the intervention in 2009 all seventh grade students in the intervention and control schools received letters inviting participation; 96% (189/196) of eligible seventh graders participated from the intervention schools and 95% (180/189) were measured postintervention. 21 In 2013, the research team identified two high schools serving the majority of intervention participants. Given the four-year interval since the intervention, the team elected to inform prior participants of the plan for remeasure and provide the opportunity to opt out. The team partnered with school leaders to send letters inviting reassessment of student height and weight and completion of a health habits questionnaire to prior participants (then in 11th grade) and their parent/guardian(s); letters included student and parent opt-out forms. All students not opting out were provided the questionnaire and a time at school to have height/weight measured. Of the 138 students enrolled at the high schools in 2013 104 (75%) were remeasured (104/189, 54% of the original sample).
Control Participants
In 2009 the study participation rate at the control school was low (< 35%). In 2013, to increase participation in this follow-up study, the research team conducted additional recruitment. Two high schools enrolled the majority of students from the control school. After identifying students enrolled who had attended the control school, letters were distributed to these students with assent forms and opt-out parent consent forms. A small incentive item (student choice of item valued at approximately $10) was offered to students completing the height/weight measures. For this study, control participants included all students who returned assent forms whose parent did not opt out and who completed height and weight measures, for a total of 68% (117/173) participation; due to administrative issues at one of the schools, only 90 of 117 completed the health habits survey. No power analysis was conducted to establish sample size, because the sample was predetermined by school enrollment.
Data Collection
Methods of data collection were reported previously. 21 All students had height (to nearest quarter inch) and weight (with shoes off, wearing school uniform) measured privately, following procedures devised by trained research staff, using a stadiometer (Schorr Productions, Olney, MD); and calibrated scale at baseline (January 2009) and post-MATCH (April 2009); those participating in the follow-up study were remeasured in spring 2013. BMI was calculated from height and weight; sex-specific zBMI, BMI percentile, and weight category (underweight <5th percentile; healthy weight 5th percentile − <85th percentile; overweight 85th percentile − <95th percentile; obese ≥95th% percentile) were determined using current CDC parameters. 22 Sex, ethnicity, and dates of birth were extracted from school records.
In addition to anthropometric measures, all follow-up participants were offered a 29-question Health Habits Questionnaire. This questionnaire included 19 questions adapted from the Beverage and Snack Questionnaire©23 and 10 from the 2010 Youth Risk Behavior Survey (YRBS). 24 The original Beverage and Snack Questionnaire was validated for use in middle school subjects to assess self-reported beverage and snack intake over a one-week period in home or school settings. The respondent reports “how often in the past week” they consumed specific types of drinks (nine), snack (eight), and fruit (one) and vegetable (one) servings. Possible responses include never/less than one per week, one per week, two to four per week, five to six per week, one per day, two to three per day, or four plus per day. The questionnaire does not quantify a serving size but queries only frequency consumed for each item. For this study the response format was modified to include total intake without distinction between school and home. The Health Habits Questionnaire also assessed physical activity and sedentary behaviors using 10 questions from the 2010 YRBS. 24
Statistical Analysis
All data analyses were conducted with statistical software SAS (SAS version 9.4; SAS Institute Inc., Cary, NC). Baseline characteristics were compared between groups and between those retained and lost to follow-up using Fisher's exact test for categorical variables (sex, race, weight category) and two-sample t test for continuous variables (age, BMI, zBMI, BMI percentile). McNemar's test was used to compare change in the proportion of each weight category between the two groups. We used multiple regression models to compare the changes in BMI measures between the two groups, controlling for effects of sex, race, school, and baseline BMI measures. Both race and school effects were found to be not significant for all BMI measures and were eventually excluded from all regression models. Linear mixed models were adopted to compare the overall trend over time in zBMI between the two groups. Potential sex, race, and school effects were considered but then dropped from the model due to insignificance. A significance level of 0.05 was adopted for all statistical tests.
Results
Participant Characteristics
Baseline characteristics of MATCH intervention (N = 189) versus control (N = 173) participants were different in several ways (Table 1). Both groups had about equal participants of each sex; and the majority were black, overweight or obese, and from low-resource areas. Statistically significant differences between groups include that control participants had lower baseline BMI, were slightly younger, had greater variation in distribution of race (higher percentage black and lower percentage white), and greater proportion of low socioeconomic status. Although not significantly different, the weight status of the control group was overall healthier, with higher percentage of students at healthy weight and lower overweight/obese.
Baseline Participant Characteristics, MATCH Intervention, and Control Groups
MATCH, Motivating Adolescents with Technology to CHOOSE Health.
Comparison of Lost versus Retained Participants
Characteristics of participants lost to follow–up versus retained in both the MATCH (55% retained) and control (68% retained) groups are shown in Table 2. In MATCH there were no significant differences in BMI measures, sex, race, or weight category distribution, but retained participants were slightly younger. In control, there were no significant differences in age, sex, or weight category distribution, but the retained group had higher baseline BMI measures and slightly more white and fewer black participants.
Baseline Characteristics of Participants Lost to Follow-Up and Retained in MATCH Intervention and Control Groups
Two-sample t test.
Fisher's exact test.
MATCH, Motivating Adolescents with Technology to CHOOSE Health.
Changes in BMI Measures
In looking at both groups four years after the intervention, the MATCH group showed a significantly lower increase in BMI on average (mean change MATCH 2.66 versus control 4.03; p = 0.01) and a significant decrease in zBMI compared to control (mean change MATCH −0.15 versus control 0.04; p = 0.02) (Table 3). All subgroups showed significant increases in mean BMI, as would be expected when growing through adolescence. However, the MATCH group trended towards lower increases for every subgroup and demonstrated significantly lower increase in mean BMI in the all overweight (combined overweight + obese) subgroup (mean change MATCH 2.82 versus control 4.89; p = 0.03). MATCH also showed significantly lower increase in the male subgroup, with a mean increase of 2.13 (SD = 3.02) compared to 3.32 (SD = 2.93) in control; p = 0.04. In looking at zBMI changes, the MATCH group showed significant or near significant decreases in the overweight, all overweight, male, and white subgroups; while the control groups had no significant changes and trended towards increases in zBMI in nearly all subgroups. Using multiple regression models controlling for baseline zBMI and sex, the between-group difference between the MATCH and control groups in mean changes in zBMI was statistically significant for the overweight subgroup.
Changes at Four-Year Follow-Up in BMI and BMI Z-Score (for Age and Gender), MATCH Intervention, and Control Groups
Matched pairs t test for significance of changes.
Based on multiple regression controlling for the baseline values and sex effect (comparisons by sex controlled for baseline values only).
IQR, interquartile range; MATCH, Motivating Adolescents with Technology to CHOOSE Health.
Rates of Change in BMI Z-Score
Although normal growth and changes in zBMI over time occur in nonlinear fashion, particularly during adolescence, when looking at repeated measures over time, overall trends can be assessed by linear mixed models. For this analysis we included measures at the pre-, immediately post-, and after-four-year time points to compare overall trends between groups. A comparison of the overall trend over time in zBMI between MATCH and control groups by weight category and using linear mixed models is shown in Table 4. For all weight categories, the MATCH group had decreasing trends, with significant decreases in the all, overweight, and all overweight groups. Although not statistically significant, the control groups had increasing trends in these groups. Due to these differences, the control group as a whole was statistically different from the MATCH group. As an example, in the overweight subgroup, in MATCH, the zBMI decreased by a mean (standard error) rate per month of 0.0062 (0.0025), p = 0.01; while it showed no significant change in control: 0.0017 (0.0029), p = 0.55; between-groups p = 0.04.
Comparisons of Overall Trend in BMI Z-Score between MATCH and Control Schools a
Estimated using linear mixed models based on data from pre-intervention, postintervention, and four-year follow-up.
The slope can be interpreted as average change per month.
For testing whether the slope is significantly different from 0.
Statistically significant difference in slopes between the two groups.
Weight Categories
The percentage of participants in each weight category changed significantly after four years in the MATCH group (Fig. 1), with the percentage healthy weight increasing (40.2% to 45.6%), overweight decreasing (22.8% to 18.5%), and obese also decreasing (36.5% to 31.1%), all with p < 0.01. In comparison, in the control group the percent healthy weight decreased (53.2% to 47.9%, p < 0.01), and there was no significant change in either overweight or obese. Looking at shifts between weight categories from baseline to follow-up (Table 5) provides the underlying detail to understand the changes seen in Fig 1. Using these numbers, the incidence of obesity in the MATCH group was 13% (5/30) compared to 39% (9/23) in control; and remission of overweight to healthy weight was 40% (12/30) in MATCH versus 26% (6/23) in control. Of those participants who were obese at baseline, the two groups were similar, remaining obese after four year, 81% (26/32) in MATCH and 81% (29/36) in control.
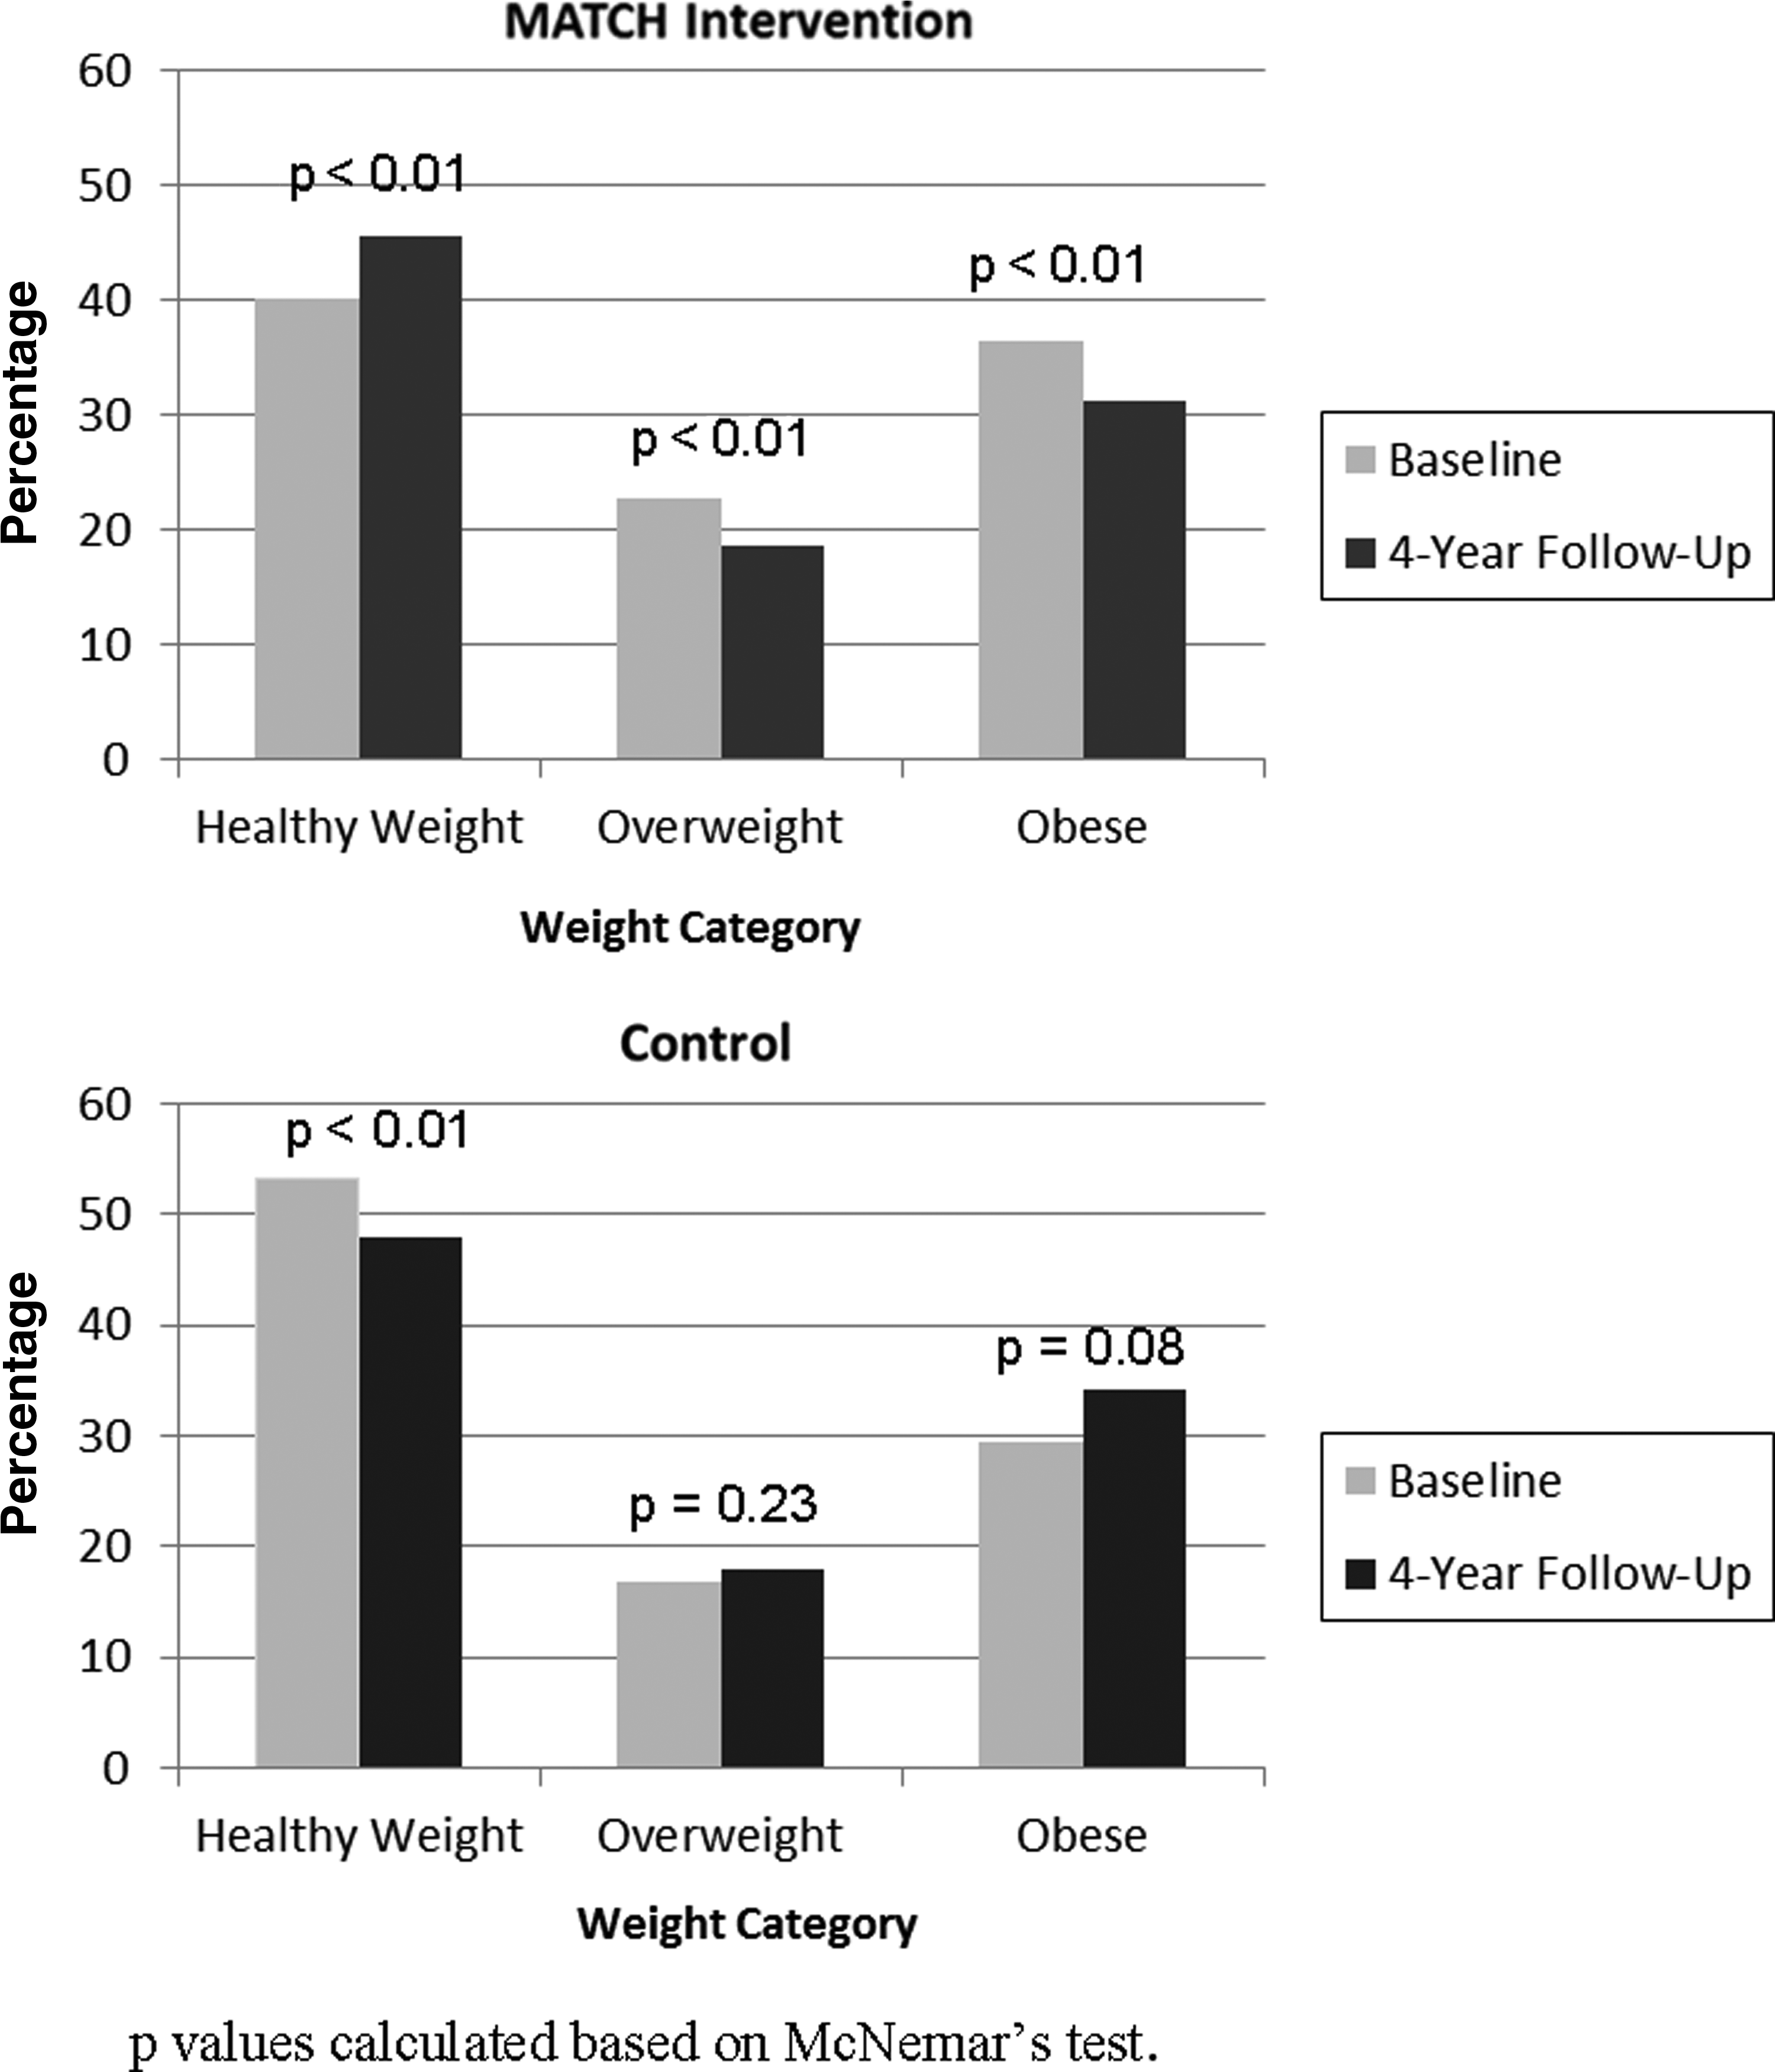
Percentage of all participants in each weight category at baseline and those remeasured at four-year follow-up; MATCH intervention and control groups.
Shifts in Weight Categories (Frequency and Percentage) at Baseline and Four-Year Follow-Up, MATCH versus Control Groups
Weight category determined by CDC definitions based on BMI percentile for age and sex: underweight < fifth percentile; healthy weight 5 − < 85th percentile; overweight 85 − < 95th percentile; obese ≥95th percentile.
MATCH, Motivating Adolescents with Technology to CHOOSE Health.
Self-Reported Health Habits
The Health Habits Questionnaire was completed by the majority of participants in both groups, 95% (98/104) MATCH and 77% (90/117) control (Table 6). There were no significant differences between the groups in the food/drink frequency consumed or hours per year for the following behaviors: sugar-free drinks, milk, physical activity, computer time (total or weekend), or TV time on the weekend. The MATCH group reported significantly fewer sweet drinks, snacks, and weekday TV time, however, compared to the control group. If the differences between groups are converted into per week quantities, the MATCH group consumed sweet drinks and snacks at a frequency below that of control: 8.8 fewer for sweet drinks and 9.5 fewer per week for snacks, and watched 1.9 fewer hours weekday TV per week.
Health Behavior Summary Responses at Follow-Up in 2013 from a Modified Beverage and Snack Questionnaire: MATCH Intervention versus Control Groups, Mean Frequency Consumed or Hours per Year
MATCH, Motivating Adolescents with Technology to CHOOSE Health.
Discussion
Despite prior studies of school-based interventions in adolescents showing mixed results for BMI changes and no prior studies reporting long-term results, this study of the MATCH intervention offers promising evidence that adolescents at high risk for obesity can change to a healthier weight trajectory four years after a time-limited, targeted intervention in seventh grade. The findings of the cross-sectional assessment of self-reported health behaviors in 11th grade comparing MATCH participants to control support the BMI results, in that the specific behaviors with significant differences between groups are behaviors targeted in the MATCH curriculum. No prior school-based intervention has demonstrated sustained success in prevention of overweight and obesity. Of note, the study is set in rural eastern North Carolina, a region without other targeted obesity prevention efforts during this time that could explain the results. Although North Carolina has ongoing statewide obesity prevention efforts, there were no efforts during this period for adolescents in the involved region or schools, and the chance that these results occurred from population-level behavioral trends is extremely unlikely in this geographical region. In addition, although both involved school districts were gradually enacting changes in the school nutritional environment and offerings (such as changes to vending and snack availability) beginning during the study period, no charges were enacted to a greater extent in intervention schools than in control schools that could have explained results.
Although it is not possible in this small study to determine which intervention components led to the observed results, there are several aspects of MATCH that are unique and likely have contributed to its success. These characteristics are that the intervention is intensive, individualized, targeted, and embedded within the curriculum.
Intensive
MATCH teachers taught 20+ lessons over a 16-week period in seventh grade in contrast to Planet Health which was spread over three years, or the HEALTHY study that involved school environmental changes and efforts led by students and nonschool personnel, which took place over one year.12,14
Individualized
MATCH lessons are individualized by using the student's data (BMI that is plotted and weight category determined by the student, fitness test results, and health behaviors) to set goals and create action plans, and behaviors are reassessed and goals adjusted over time.
Targeted
Lessons cover broad health and nutrition content, but behavior changes specifically targeted are those that are most likely to be within the adolescent's control, including beverage choice (e.g., sugar-free beverage taste test lab); restaurant meal selection (e.g., comparison of nutritional content of student's selected meals); and leisure activities (e.g., tracking of sedentary activities after school).
Embedded
By embedding all lessons and activities within the curriculum, teachers must teach the lessons in order to meet state or national objectives, so there is greater incentive to complete program components. In addition, the natural accountability of the school setting with the expectation of learning, role modeling by school staff, and test/assignment/grade components all act to promote student engagement and increased learning; and positive peer pressure can result. While we believe these aspects of MATCH are what make it unique and likely contribute to its success, future large controlled studies are needed to confirm effectiveness and explore key factors most important for effect and replication.
Limitations and Strengths
The study has several limitations. The study is small, with only three schools from rural, low-resource areas; thus results should be interpreted with caution and may not be generalizable to other regions or groups. Group assignment was not random, which could result in some undetected underlying biases or confounding factors contributing to the observed results.
Specifically, there were significant baseline differences between groups, with the control group from a school comprised of substantially more students of low socioeconomic status. And at follow-up in the control group, retained participants represented more white students and those with a lower baseline BMI. The overall retention rate was relatively low for a cohort study, and lower in the MATCH group than control (55% in MATCH and 68% in control; however, 75% of MATCH participants still enrolled in school were retained). The greater participation in control likely resulted from our offering a small incentive for measurement which was not provided for the MATCH group. Overall retention was good, and there are no identifiable reasons to believe the dropouts would result in systematic bias, although it is possible that MATCH participants would have been less likely to participate in follow-up measures if they perceived themselves as unsuccessful; and participants may have overreported “desired” behaviors. However, the MATCH and control groups had similar baseline weight status for those retained, which makes the two groups more comparable. Finally, although the inclusion of health behavior results supports the study's findings, the use of a cross-sectional and self-reported assessment four years postintervention is not as strong as an optimal objective pre- / postassessment with tools designed to assess individual behavior change. Additionally, the specific instrument used to assess health behaviors did not specify or quantify servings of foods queried, and so results should be interpreted for general trends and cannot be used for conclusions about intake in more detail. Finally, although we are unaware of other factors, we did not assess for factors that could have affected BMI in the participating schools or otherwise confounded our results.
The study also has notable strengths. The MATCH intervention was designed to fit within existing curricula and require limited additional resources, making it practical and feasible for replication. The study design with long-term follow-up to age 17 years in a high-risk cohort is unprecedented in prior school-based interventions. The use of appropriate analytical techniques to control for group differences increases the validity of the observed changes in BMI measures and differences between groups. Finally, the inclusion of an assessment of health behaviors offers additional evidence to support the greater improvements in weight status demonstrated in the MATCH group. The identified differences in health behaviors in the MATCH group represent specific behaviors targeted by the MATCH curricula and offer a potential underlying mechanism for the observed BMI changes.
Conclusions
Given today's pervasive obesogenic environment, it is critical that adolescents learn the knowledge and skills necessary to make healthy choices within their environment. Despite prior school-based efforts having mixed BMI results, results of the MATCH program offer convincing evidence that young adolescents at high risk for obesity can change their weight trajectory with an intensive, targeted program provided in the school setting. Given its design is practical and feasible, the MATCH approach warrants further study as a promising approach to preventing obesity in adolescents.
Footnotes
Acknowledgments
This work was supported by funding from the State Board of Education of North Carolina, the Blue Cross and Blue Shield of North Carolina Foundation, and in part by an award from the Robert Wood Johnson Foundation Physician Faculty Scholar Award Program. We also thank the school system personnel who supported and conducted this work. We gratefully acknowledge help with aspects of the study and manuscript completion by the following graduate assistants: Waseem Ahmed, Alexis Barnett Sherill, Caprice Hunt, Lauren Needell, and Kristin Shiue.
Author Disclosure Statement
The authors have no conflicts of interests to disclose, and have no financial disclosures. Funding sources were (1) North Carolina State Board of Education (no number); (2) grant from the Blue Cross and Blue Shield of North Carolina Foundation (no number); and (3) Physician Faculty Scholar Award to Dr. Lazorick from the Robert Wood Johnson Foundation (RWJF ID #66333).