
Abstract
Abstract
Background:
This study aimed to establish gender-related differences and the percentile curves for total body fat mass percentage (Total FM%), trunk/appendicular fat mass ratio (TrAppFMR), and fat mass ratio as % fat trunk/% fat lower limb (TrLLFMR) in Chinese children and adolescents using dual-energy X-ray absorptiometry (DXA).
Methods:
Children (n = 1541; 764 girls) and adolescents aged 5 to 19 years were recruited from southern China. Total FM% and regional FM were measured by DXA. TrAppFMR values were calculated as trunk FM divided by appendicular FM, and TrLLFMR values were calculated as the ratio between the percentage of trunk FM and the percentage of lower limb FM.
Results:
Total FM% peaks for boys were at approximately age 11 years and continued to increase for girls throughout adolescence. Median Total FM% at the age of 19 years was 15.53% and 28.06% for boys and girls, respectively. Median TrAppFMR and TrLLFMR increases were 61% and 81% from 5 to 19 years of age in boys compared with those in girls, 31% and 54%. The curves for median TrAppFMR and TrLLFMR in girls were relatively flat, with TrAppFMR and TrLLFMR remaining near 1.0 after 16 years of age, whereas in boys, median TrAppFMR and TrLLFMR increased with age until approximately 19 years.
Conclusions:
Gender differences in the patterns of proportion and distribution of body fat were found. We present sex-specific percentile curves for Total FM%-age, TrAppFMR-age, and TrLLFMR-age relationships in this population.
Introduction
Obesity is commonly defined as an excess of body fat and is a global problem in children. 1 Therefore, assessments of obesity in children and adolescents are important. The body mass index (BMI; body mass/height 2 ) is widely used to identify individuals with excess adiposity, and age- and sex-specific reference values for BMI in children and adolescents have been developed by the International Obesity Task Force (IOTF). 2 BMI is easily measured; however, such measures are limited by their failures to distinguish between lean mass (LM) and fat mass (FM), which can lead to significant misclassification. The amounts of adiposity vary for given BMI values of different ethnic groups.3,4 Because the pathologies associated with obesity are driven by excessive FM, the ideal monitoring tool should directly assess adiposity. 5 Recently, dual-energy X-ray absorptiometry (DXA) has gained wider acceptability in children, and this method can quantify total and regional FM with high precision, low scanning time, and low radiation exposure (5–10 μSv).6,7 Total body FM percentage (Total FM%) of children and adolescents has been published according to the DXA method for assessment of body fat.8–12 To our knowledge, no large samples of normative data for Total FM% in Chinese children and adolescents have been published. Therefore there is a need for the generation of a database for Total FM% of Chinese youth for early detection of childhood overweight and obesity.
There is an increasing realization that fat distribution may be as important as total body FM. Body fat distributions are typically expressed as ratios. Two indices of fat distribution, FM of the trunk divided by appendicular (arms and legs) FM—trunk/appendicular FM ratio (TrAppFMR)—and FM ratio calculated as the ratio of the percentage of trunk FM to the percentage of lower limb FM—%fat trunk/%fat lower limb (TrLLFMR)—were included. A previous study revealed that the DXA based on TrAppFMR, which is a measure of central adiposity, exhibits a good correlation with visceral adipose tissue (VAT) area as measured by magnetic resonance imaging (MRI) and has proven useful in the effective prediction of VAT. 13 In childhood, TrAppFMR is related to blood pressure, low bone mineral density (BMD), hypogonadism, and anorexia nervosa.14–17 Additionally, ethnic differences regarding TrAppFMR exist in adolescent girls.18,19
Regarding TrLLFMR, Bonnet et al. concluded that the use of TrLLFMR should allow for a more accurate and earlier diagnosis of lipodystrophy in men. 20 The main reasons for the proposal of this index were that DXA-derived trunk fat accounts for more than 80% of the variability of VAT determined by Computed Tomography (CT) 21 and that 90% of FM in the legs is subcutaneous. 22 Until recently, only a few studies have provided normative data regarding TrAppFMR and TrLLFMR as assessed with the DXA method23–25 in adults. To our knowledge, no study has provided data regarding the ranges of TrAppFMR and TrLLFMR for the pediatric population. Thus, ethnicity-specific TrAppFMR and TrLLFMR percentile curves as assessed by DXA would provide further assistance in the assessment of fat distributions in children and adolescents.
Therefore, the objective of the current study was to provide age- and sex-specific percentile curves using the lambda-sigma-mu (LMS) method for Total FM%, TrAppFMR, and TrLLFMR in children and adolescents aged 5 to 19 years as assessed with DXA data. Additionally, our data can be compared with studies in other countries.
Methods
This cross-sectional study was conducted to measure body composition by DXA of apparently healthy Chinese children aged 5 to 19 years in southern China. This is a companion study to our previously published work on bone parameters in Chinese children.26,27
Subjects
This study sample consisted of 1632 healthy Chinese school children and adolescents aged 5 to 19 years who were recruited from four local schools in the urban area of Guangzhou district and one school in the urban area of Jiaxing district in southern China between January 2007 and June 2011. The subjects were selected according to a multistage stratified cluster sampling method. We excluded 91 participants because of missing data or extreme height, weight, and BMI values. A total of 1541 (777 boys and 764 girls) participants were included in our analyses. The participants included in the study were between the 3rd and 97th percentiles in height, weight, and BMI based on current growth reference curves;28,29 these students were assessed based on BMI reference norm for screening overweight and obesity in Chinese children and adolescents by the Working Group on Obesity in China (WGOC). 30 In this study the proportion of obese children was 4.0% (4.6% and 3.5% for boys and girls, respectively).
The intended sample was healthy Chinese children and adolescents specifically from southern China. All participating children were of Chinese Han nationality and were born locally. The location of the study was the Department of Nuclear Medicine of the First Affiliated Hospital, Jinan University, Guangzhou. The subjects who participated in this study completed a screening questionnaire, and medical examinations were performed by a trained pediatrician to assess the children's health status; those with overt disease or physical/mental deformities were excluded. The schools required the children to have outdoor exercise for approximately one hour each day, and none of the participants had undertaken long-term intensive sports training or taken calcium-containing drugs or health products. Written informed consent was obtained from all participants and their parents. This study was approved by the Ethics Committee of the First Affiliated Hospital, Jinan University (No. 2007- 4T47).
Anthropometric and DXA Measurements
Anthropometric and DXA measurements were obtained from the children and adolescents during a single visit. Their weights were measured using platform digital scales with precision of 0.1 kg, and standing heights were recorded with a stadiometer to the nearest 0.1 cm. A Lunar Prodigy DXA bone densitometry scanner (version enCORE 10.0, standard-array mode, GE Healthcare, Madison, WI) was used to measure Total FM%. The test-retest short-term precision error for Total FM% was 1.95% (expressed as the root-mean-square percent coefficient of variation) as determined by duplicate scans with repositioning between each measurement in 30 volunteer subjects. Daily quality assurance scans were conducted by scanning an aluminum spine phantom according to the manufacturer's instructions. All DXA measurements were performed by a well-trained technologist throughout the study. DXA measurement was performed while the child was in a supine position, with standard positioning of the arms and feet.
Markers used in this study for trunk and lower limbs that defined regions of interest were those indicated by the manufacturer. Arms and legs data were added and expressed as limbs. The arms were defined by the line passing through the humeroscapular joint. The trunk region was delineated by an upper horizontal border below the chin, vertical border lateral to the ribs, and lower border formed by the oblique line passing through the femoral neck. The leg region was defined as the tissue below the oblique line passing through the femoral neck. Regional FM values were grouped and analyzed for the following anatomical regions: arms, legs, trunk, and total body. Fat tissue composition variables were calculated from DXA total body scans as follows: Total FM% (total body FM/weight), TrAppFMR (trunk FM/appendicular [arms + legs] FM), and TrLLFMR (%trunk FM/ % lower limb FM).
Statistical Analysis
Descriptive statistics were used to analyze the characteristics and measurements. Student t-tests were conducted to evaluate differences in the various parameters between the boys and girls for each age group. Total FM%-age, TrAppFMR-age, and TrLLFMR-age percentile curves (5th, 10th, 25th, 50th, 75th, 85th, 90th, and 95th) were developed using the LMS method as described by Cole and Green.
31
The LMS method summarizes the changes in the distribution based on three curves representing the median (M), the coefficient of variation (S), and the skewness (L) expressed as the Box-Cox powers. These three values were estimated, and the curves were calculated using the following formula:
where Z is the Z-score corresponding to a given percentile. The percentile curves were constructed using the lmsChartMaker program (version 2.3, Medical Research Council, UK). All of the tests were two-tailed, and p values below 0.05 were considered statistically significant.
The 50th and 95th percentile curves for Total FM% of the Chinese children and adolescents were compared with those of US children using the Hologic QDR 4500A fan-beam DXA scanner (DOS software Version 8.26:a3 and Discovery software Version 12.1) and with those of affluent Indian children using the GE Lunar DPX Pro Pencil Beam DXA scanner (Version Encore 2005, 9.30.044; GE Healthcare, Waukesha, WI).11,12 To reduce the differences between the GE Lunar DPX and Hologic QDR whole-body scans, we used the recommended cross-calibration equations from Shepherd et al. 32 to compare the results between the Chinese and US children.
Results
Table 1 presents the characteristics and measurements of the subjects. The calculated mean (SD) values of Total FM%, TrAppFMR, and TrLLFMR for each sex and age group are shown in Table 2. Total FM% was significantly higher in the girls than in the boys, with the exceptions of the 5 year-old, 7 year-old, and 9 to 11 year-old age groups. TrAppFMR and TrLLFMR values were significantly higher in the girls than in the boys in the 11 to 13 year-old and 12 to 13 year-old groups. However, after age 16, we observed that TrAppFMR and TrLLFMR values of the boys were significantly higher than those of the girls. Further analyses revealed that larger differences between the sexes were present after age 11 in terms of Total FM% and after age 16 in terms of both TrAppFMR and TrLLFMR. Figure 1 shows the changes in Total FM%, TrAppFMR, and TrLLFMR for both sexes with the progression of age.
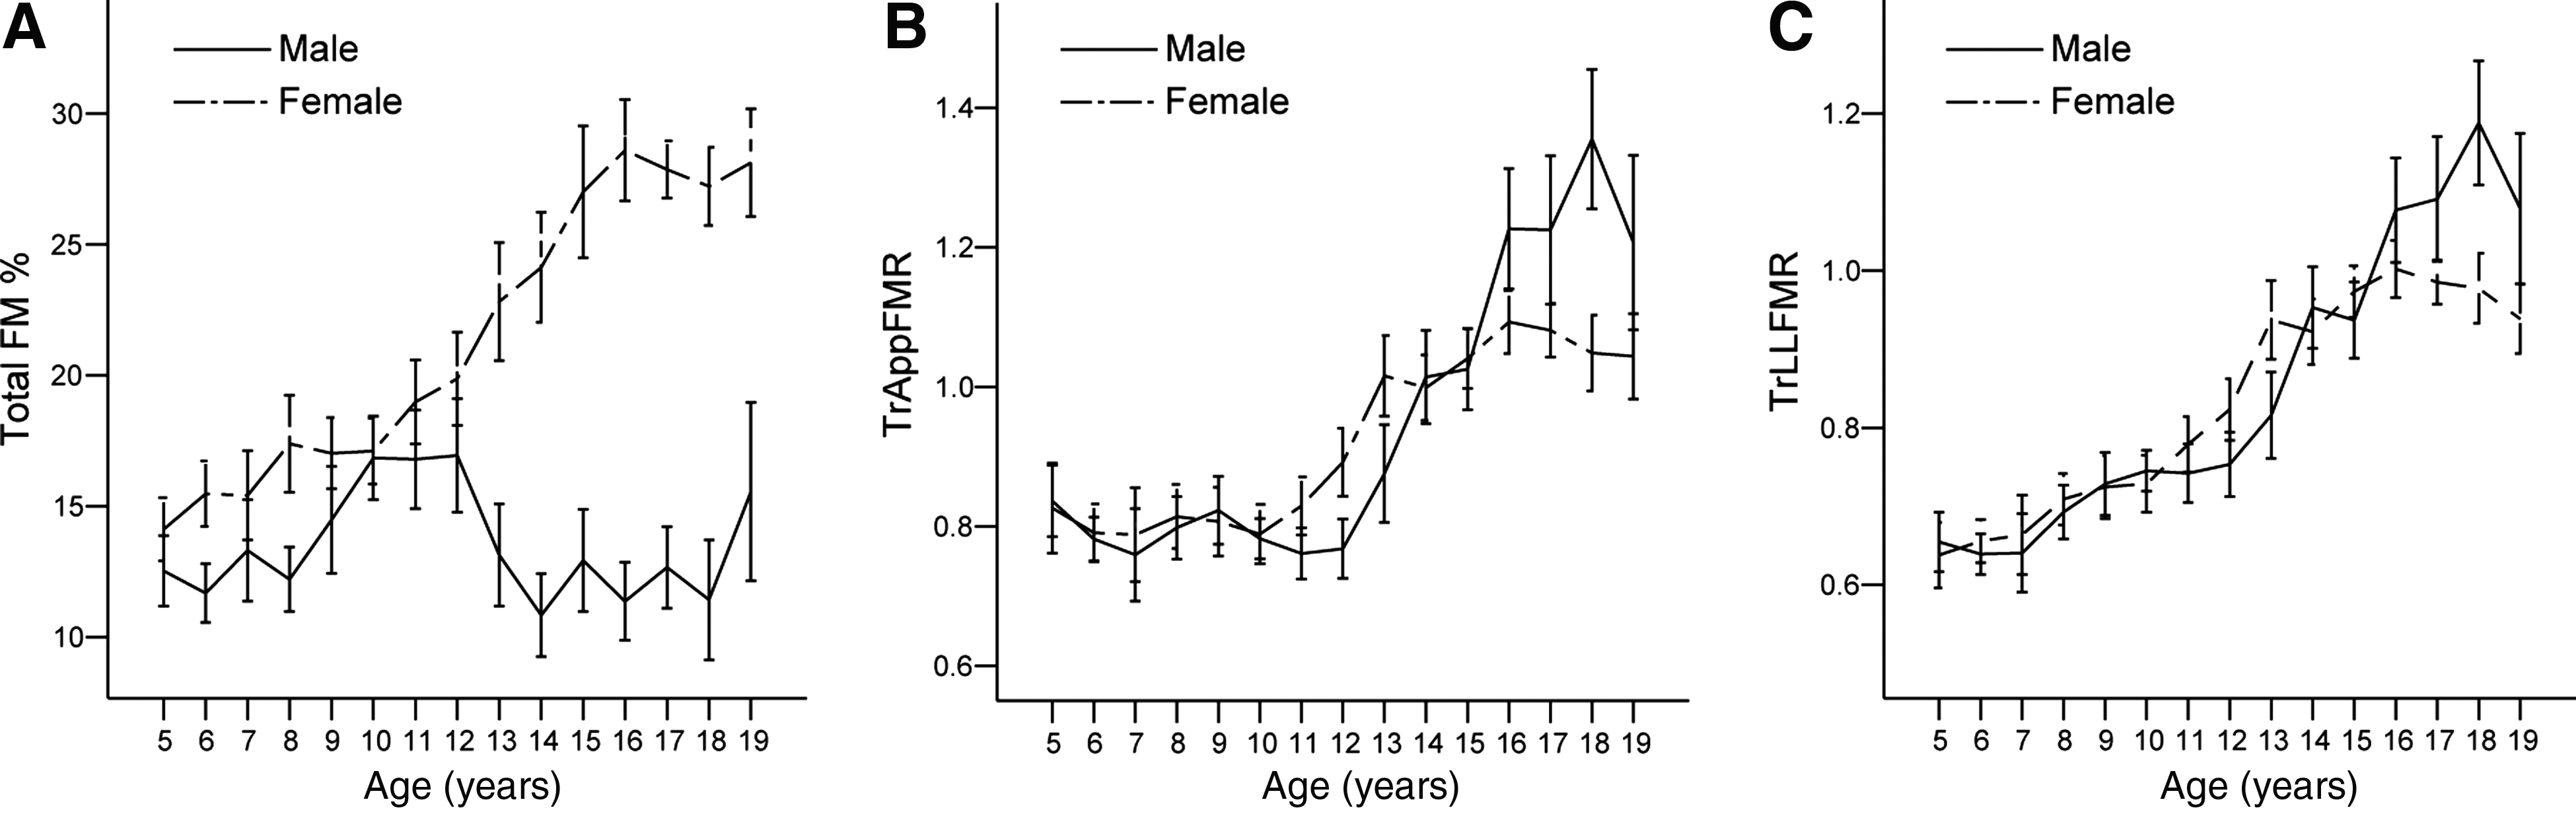
Age-specific increments (means ±95% CI) for Total FM% (A), TrAppFMR (B), and TrLLFMR (C) for the boys and girls.
Characteristics and Measurements of the Subjects, Mean (SD)
p < 0.05.
p < 0.01.
p < 0.001.
Compared with girls of the same age group (unpaired sample t-tests).
Total FM%, TrAppFMR, and TrLLFMR by Sex and Age Group, Mean (SD)
p < 0.001.
p < 0.05.
p < 0.01.
Compared with girls of the same age group (unpaired-sample t-tests).
Total FM%, total body fat mass percentage; TrAppFMR, Trunk FM/appendicular FM; TrLLFMR, % of the trunk FM/% of the lower limb FM.
Our results are presented separately for the boys and girls. Tables 3–5 show the smoothed estimates of the percentiles for Total FM%, TrAppFMR, and TrLLFMR as calculated by the LMS method. We identified the 50th and 95th percentile curves of US, affluent Indian, and Chinese children and adolescents; comparison of these three populations (Figure 2) revealed that the 50th and 95th percentiles for the Chinese children in the current study were significantly lower than those of US or affluent Indian children of both sexes.
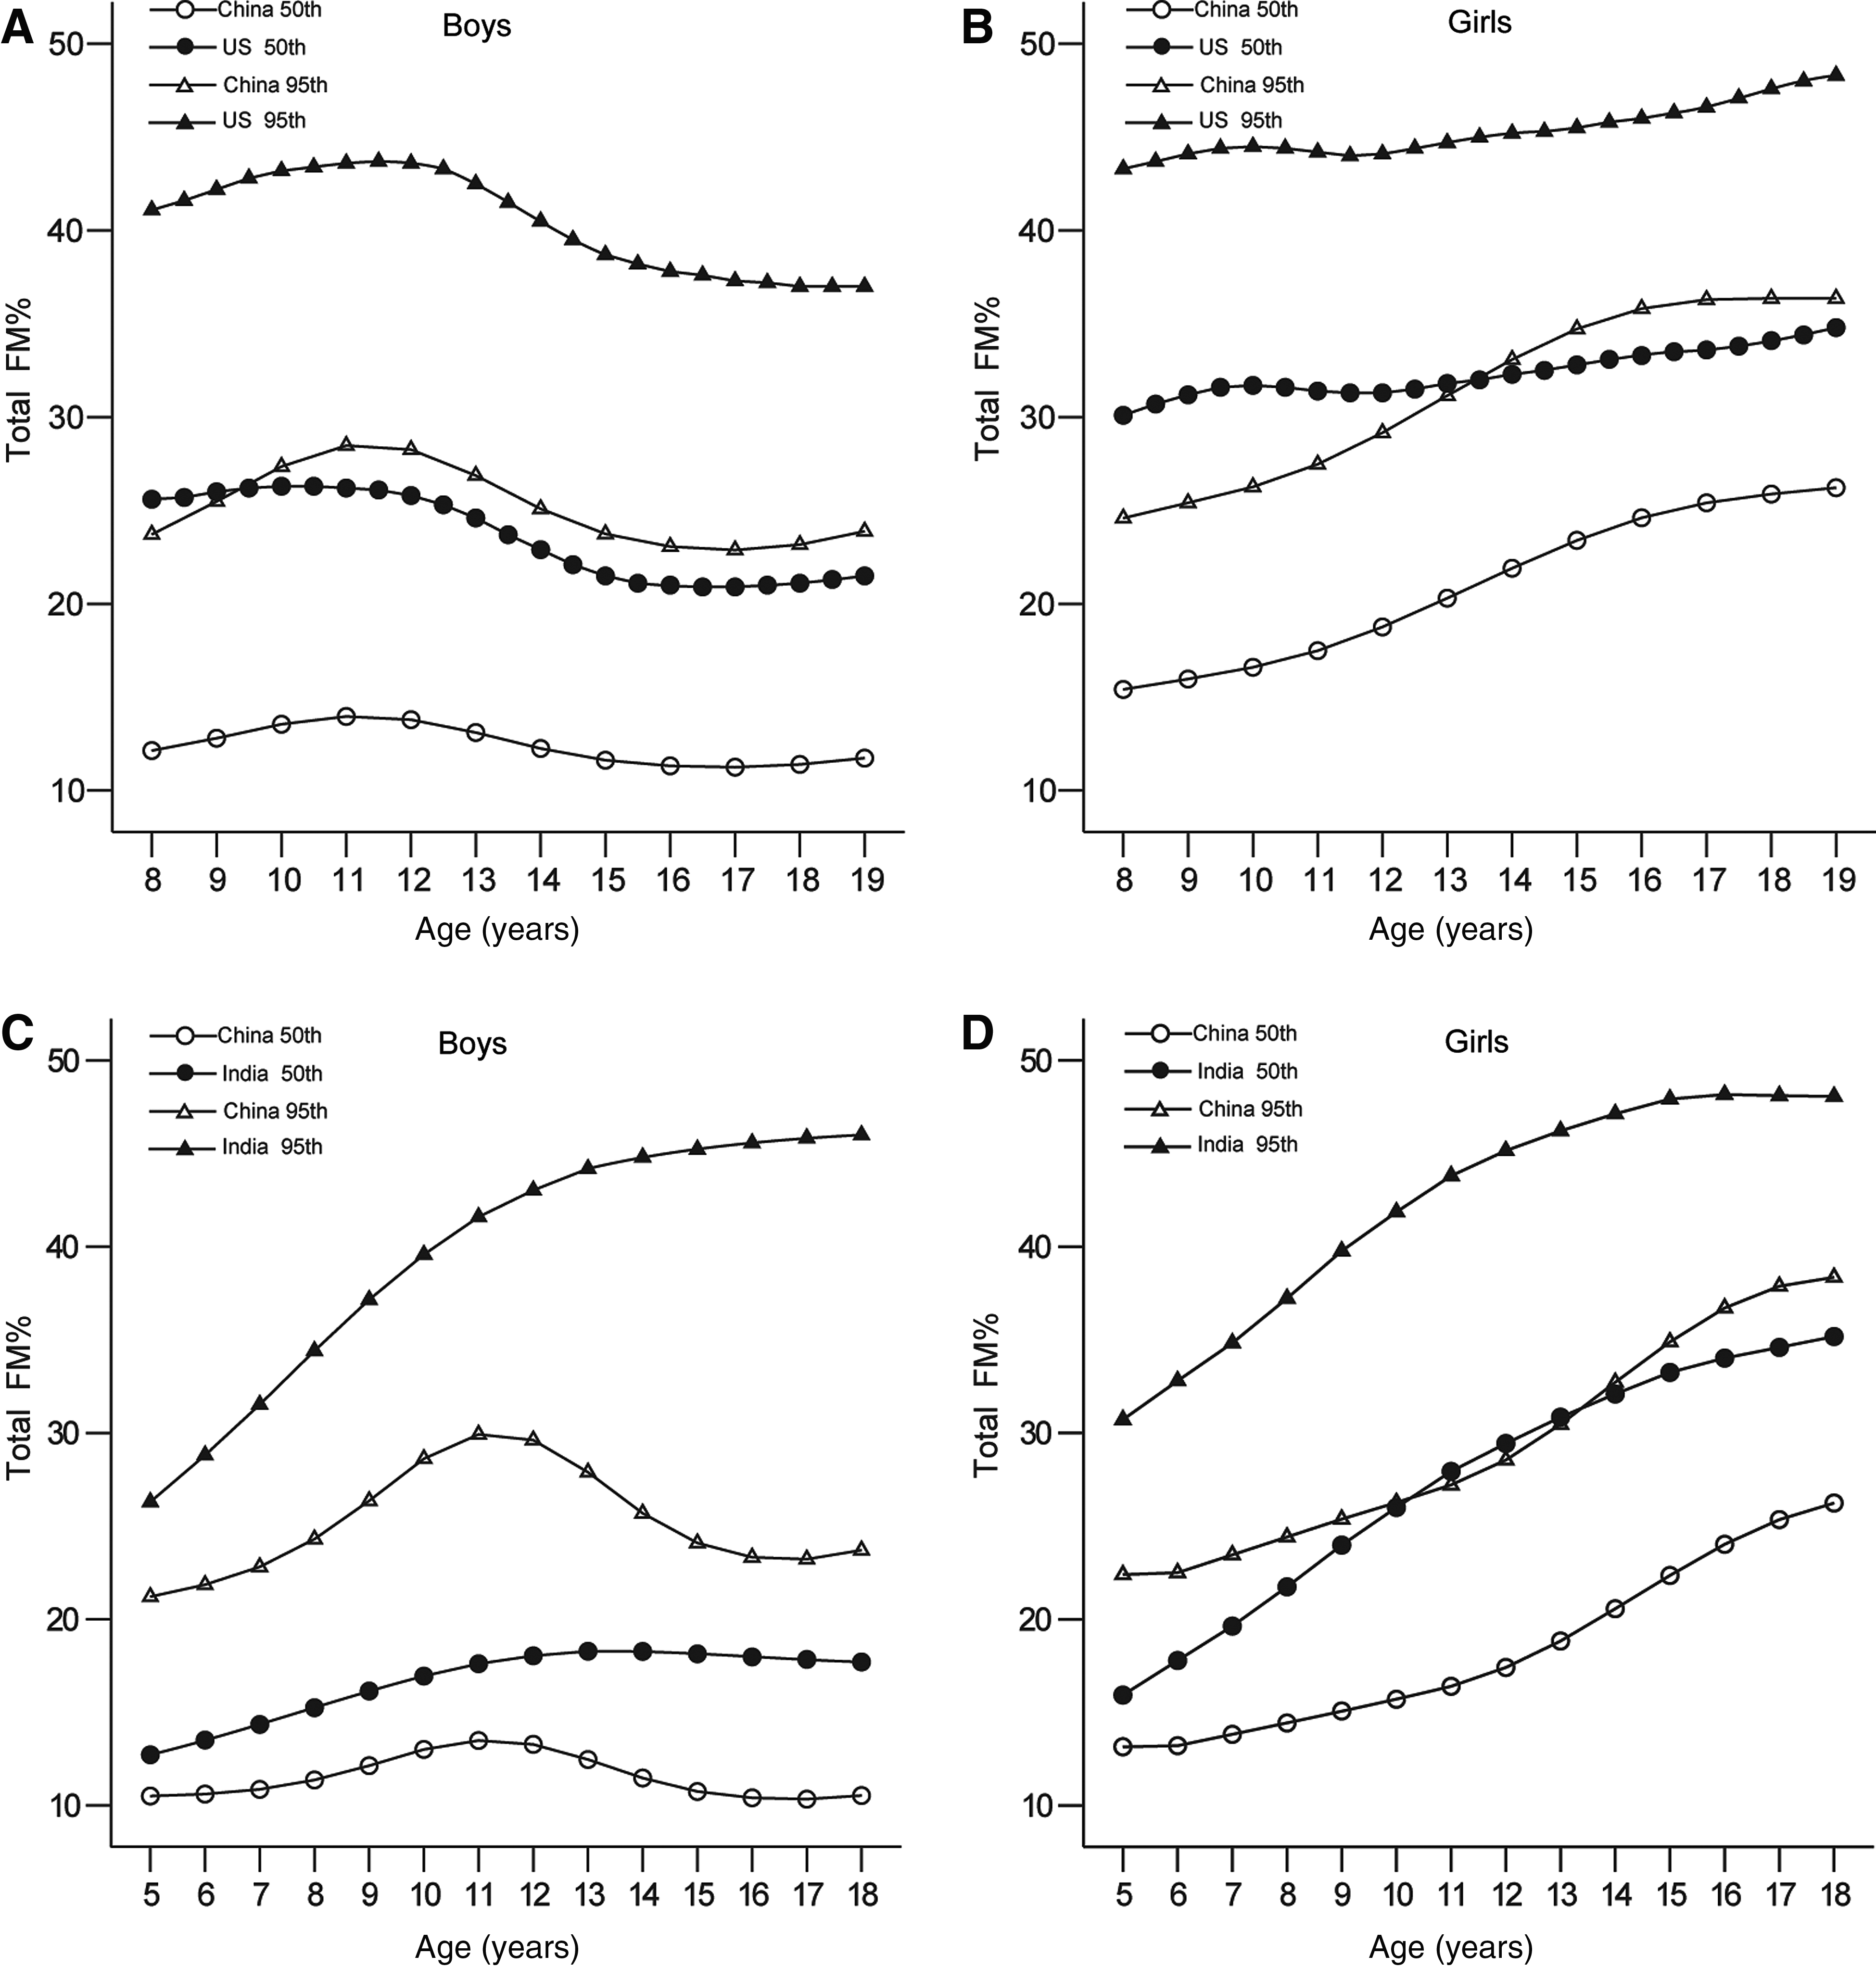
Comparison of the 50th and 95th percentile curves for Total FM% according to age for the boys, (A) China vs. United States and (C) China vs. India; and for the girls, (B) China vs. United States and (D) China vs. India.
Smoothed Percentiles for Total FM% among Boys and Girls Aged 5–19 Years
Total FM%, total body fat mass percentage.
Smoothed Percentiles for TrAppFMR among Boys and Girls Aged 5–19 Years
TrAppFMR, trunk FM/appendicular FM.
Smoothed Percentiles for TrLLFMR among Boys and Girls Aged 5–19 Years
TrLLFMR, fat mass ratio as %fat trunk/%fat legs.
Age-specific percentile curves were derived for Total FM% (Figures 3A and 3B), TrAppFMR (Figures 3C and 3D), and TrLLFMR (Figures 3E and 3F). The pattern of body fat development differed for the boys and girls between the ages of 5 and 19 years. In the boys, particularly in the upper percentile curves for Total FM%, there was a steep increase between ages 5 and 11 years that peaked at approximately 11 years. During adolescence, the Total FM% decreased slightly or leveled off in the mid and lower percentiles, but this value increased again (beginning at approximately 16 years of age) in the upper percentiles. The median Total FM% for the boys at age 19 years was 10.94%. In the girls, Total FM% increased continuously from the median of 13.21% at age 5 years through childhood and adolescence to the median of 27.18% at age 19 years. By the age of 19 years, the girls had approximately 2.5 times greater Total FM% than the boys.
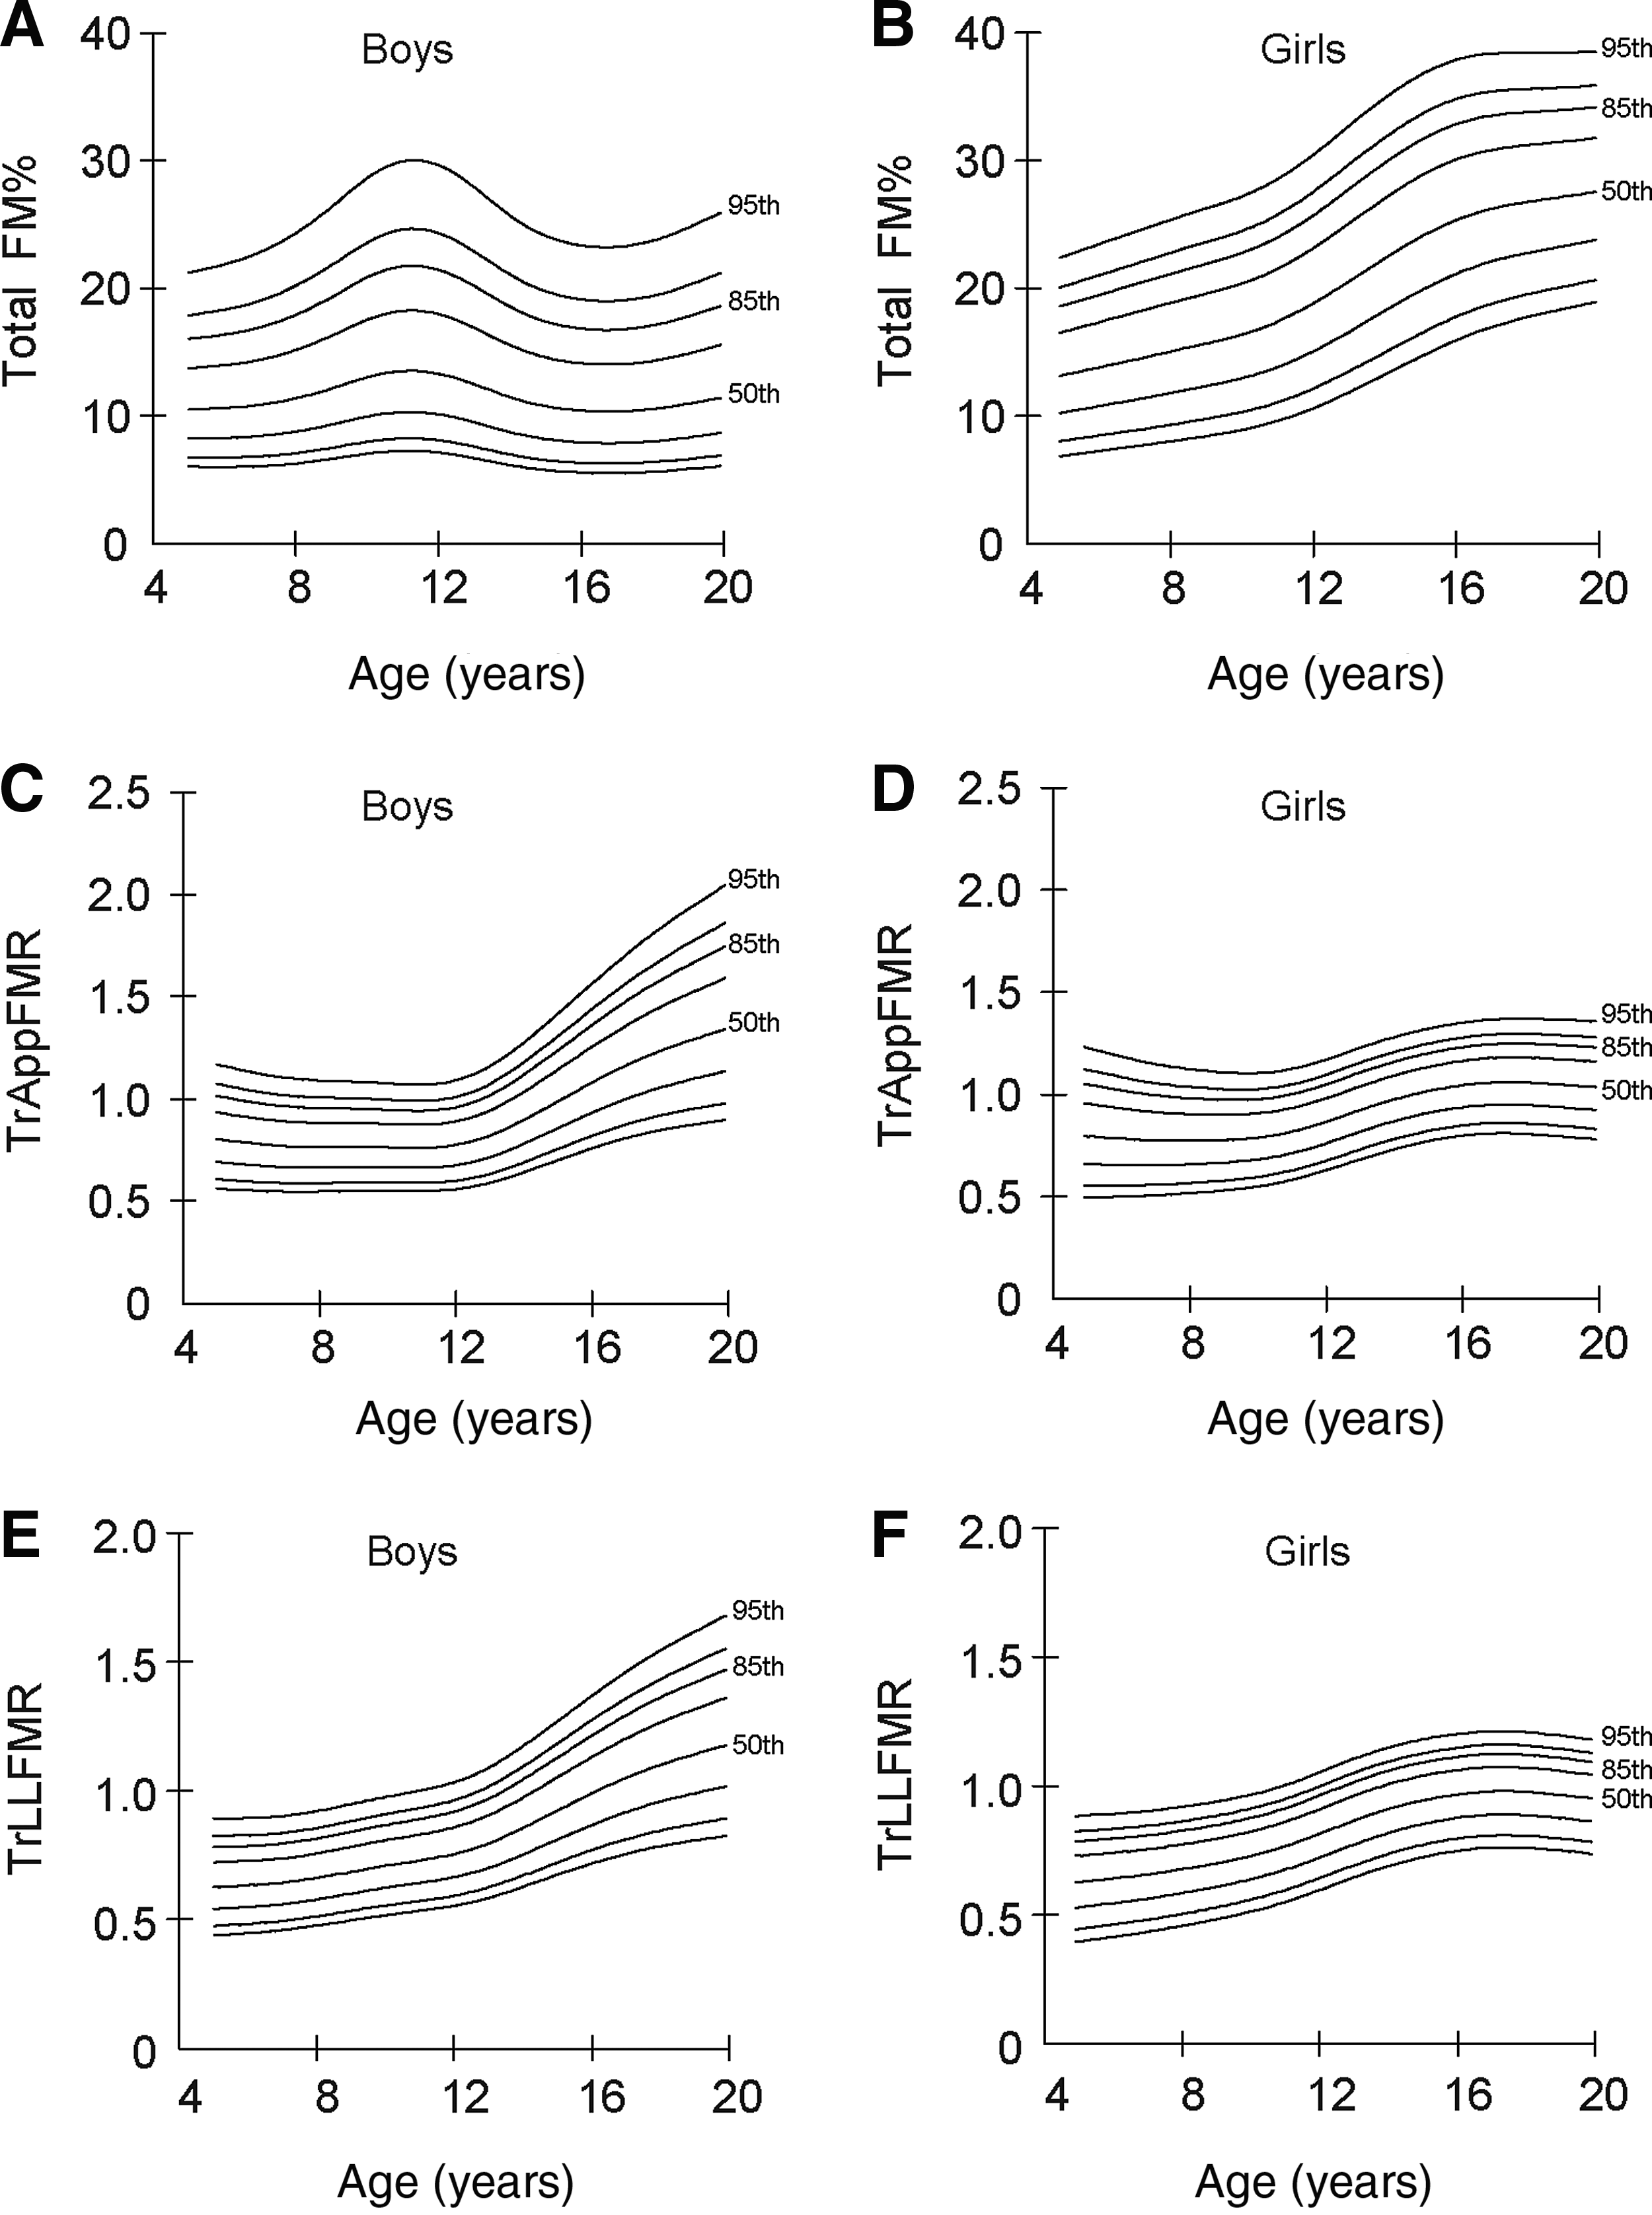
Percentile curves by age for the boys and girls for Total FM% (A, B); TrAppFMR (C, D); and TrLLFMR (E, F). The lines from the top represent the 95th, 90th, 85th, 75th, 50th, 25th, 10th, and 5th percentiles.
TrAppFMR percentiles of the boys plateaued between 5 and 12 years of age. However, through adolescence, a steady increase continued until the age of 19 years across all percentiles. In the girls, the TrAppFMR percentiles remained fairly stable from ages 5 to 11 years, and only a slight increase from ages 11 to 16 years was observed. At 16 to 19 years, all of the percentiles were relatively flat. The TrLLFMR percentiles of the boys exhibited steady increases with age until 19 years of age. In the girls, the TrLLFMR percentiles appeared to increase slightly from age 5 to age 16 and then flatten out after the age of 16 years. Median TrAppFMR and TrLLFMR increased 61% and 81% from 5 to 19 years of age in the boys compared with 31% and 54% in the girls. At 19 years, median TrAppFMR was 23% higher (1.29 vs. 1.05, p < 0.01), and median TrLLFMR was 18% higher (1.14 vs. 0.97, p < 0.01) in the boys than in the girls.
Discussion
Due to the lack of smoothed normative data related to body fat indices in Chinese children and adolescents, this study presented age- and sex-specific percentiles for Total FM%, TrAppFMR, and TrLLFMR, as measured with a GE Lunar Prodigy DXA scanner, which will be useful for assessing the degree of body fat relative to others of the same ages and sexes and thus help to identify pediatric obesity and abnormality based on fat distributions.
In this study, the shapes of Total FM% curves for the children and adolescents matched the expected changes in human body composition, 12 and the findings regarding Total FM% between the sexes during childhood and adolescence were similar to those that have been reported in China33,34 and other countries, although the techniques used for estimating FM were different.35–37 The majority of studies have revealed that boys exhibit increased Total FM% until approximately 10 to 12 years old followed by a decreasing pattern, and that girls exhibit a gradual increase in Total FM% with age.12,36,37 The present study confirmed these observations. Our study showed that Total FM% was significantly higher in the girls than in the boys after 11 years old. This difference is probably observed because the girls gain more FM during puberty and less muscle than boys. 38 During puberty, sex hormones, including growth hormones and gonadal steroids (testosterone in boys and estradiol in girls), induce a pronounced sexual dimorphism in FM. 39
Our literature review revealed that Khadilkar et al. 11 reported that Indian children exhibited higher body fat percentage than their Western counterparts. However, in the present study, we arrived at the opposite conclusion in a comparison of Total FM% percentile curves that were developed for US and affluent Indian children. Although these comparisons may partly have been influenced by the different time periods of data collection, the methods of measurement, and ethnicities, these findings may reflect the greater prevalence of overweight/obesity in the United States and India. It is worth noting that our data did not get enough information about the demographic characteristics of these samples. So it is difficult for us to make further comparisons in detail.
Our data revealed that TrAppFMR values of boys increased steadily until 19 years of age. Regarding the girls, the typical adult fat distribution patterns were obtained in late adolescence. The age-related patterns of visceral fat exhibit sex-related differences. TrAppFMR values in boys were significantly higher than those in girls after the age of 16, which suggests that the portions of visceral FM in the trunk region is smaller in girls than in boys. Another reason for the sex differences is that the lower TrAppFMR in girls could equally be the result of having a larger degree of limb fat, especially in the gluteofemoral region. In our literature review, women have increased gluteofemoral fat compared to men. 40 Generally, fat cells in the abdominal region have been thought to be more sensitive to hormonal factors than fat cells in other regions. 41 James found that circulating testosterone in boys favors increases in trunk adipose tissue. 42 In the presence of estrogen, girls can acquire a normal gynoid distribution of body fat. With decreases in estrogen, increases in central obesity with aging occur. 43 Visceral fat can secrete adipocytokines and cause metabolic syndrome. 44 Therefore, obesity-related metabolic disorders are much less frequent in premenopausal women than in men. 45 These findings provide morphological evidence that a protective factor from the gluteofemoral fat against cardiovascular disease is present in females at these ages. 46
Age-related patterns of TrLLFMR were very similar to TrAppFMR in both sexes. DXA is an extensively used technique, but it is unable to differentiate between visceral and subcutaneous fat directly in the trunk. In spite of this limitation, DXA has been used to estimate visceral fat by using the standard trunk region or by manually defining a subregion at the abdomen. As reported in previous studies, the percent of trunk FM is a good surrogate for visceral fat in adolescent girls and serves as surrogate of visceral fat to analyze the association with bone density measures in adolescent athletes with menstrual dysfunction.13,15 Generally, TrLLFMR as evaluated by DXA is an objective tool for defining HIV-related lipodystrophy, which refers to changes in the mixed forms of fat redistribution. The implementation of the TrLLFMR percentile will allow for more accurate diagnoses and monitoring of lipodystrophic patients, especially those of HIV-1-infected children. 47
We acknowledge some potential limitations to this study. The primary limitation is that this study was a cross-sectional study. Additional longitudinal assessments of FM accrual data in individuals should be incorporated. Second, our DXA data were derived entirely from GE Lunar Prodigy DXA scanners and might not be appropriate for the instrumentation of other manufacturers. Third, there are currently no standard criteria for Total FM% classifications of overweight and obesity for children and adolescents. Different studies have used different cutoffs to define excess body fat.37,48 We defined excess adiposity as a Total FM% ≥ 95th percentile to allow for direct comparisons with previous studies. Our body fat percentiles are suitable data based on actual body fat for Chinese children and adolescents, but this cutoff was not based on increased health risk, and further research is needed to identify thresholds for Total FM%, TrAppFMR, and TrLLFMR that are related to health and disease. The final limitations are that the number of subjects in the puberty stage, especially in the 19-year age group of boys, was not adequate, and we were unable to acquire specific staging information with respect to puberty.
In conclusion, our study provides first-hand estimates of the ethnicity- and sex-specific percentile curves of Total FM%, TrAppFMR, and TrLLFMR in southern Chinese children and adolescents by DXA methods. These body fat percentiles of boys and girls will be useful for assessing adiposity in clinical conditions and for epidemiological studies in China. Further studies are needed that focus on developing country-specific cutoff values for these indices that are valid for health risk based definitions of pediatric obesity and abnormal fat distributions.
Footnotes
Acknowledgments
The authors would like to express their gratitude to all participating children and their parents. We are grateful to Dr. Qi Zhou, GE Healthcare Shanghai, and Dr. Jing Xiang, First Hospital of Jiaxing, for their useful comments and suggestions. We also thank the staff members of the Department of Nuclear Medicine, First Affiliated Hospital of Jinan University for excellent technical support.
Author Disclosure Statement
No competing financial interests exist.