
Abstract
Abstract
Objective:
To determine the influence of dietary behaviors, assessed in a clinical setting, on measures of glycemia in overweight and obese adolescents.
Study Design:
The study is a retrospective, cross-sectional chart review. Eligible participants were overweight youth (N = 146, age 9–21 years) who attended the Youth Diabetes Prevention Clinic in Indianapolis, IN. Glycemic status was assessed during a 2-hour oral glucose tolerance test (OGTT). In the Bright Futures Questionnaire, a recommended clinical tool for assessing unhealthy behaviors in youth, nutrition-specific questions were modified to quantify dietary habits. Associations between dietary habits and measures of glycemia were determined using multiple linear regression models. Skewed data are presented as geometric means and 95% confidence intervals.
Results:
Of the 146 adolescents who were assessed [60% girls, age 13.7 years (13.3, 14.0), BMI 33.9 kg/m2 (33.3, 34.5)], 40% were diagnosed with prediabetes. Higher intake of dessert foods was associated with increased glucose levels at 2 hours following the OGTT (β = 0.23, p = 0.004), and higher intake of packaged snack foods was associated with elevated levels of hemoglobin A1c (β = 0.04, p = 0.04), independent of adiposity.
Conclusions:
In obese youth, high intakes of dessert and packaged snack items were associated with elevated concentrations of glucose at 2 hours following the OGTT and hemoglobin A1c. Findings demonstrate the usefulness of a modified Bright Futures Questionnaire, used in a clinical setting, for identifying dietary behaviors associated with hyperglycemia in obese adolescents.
ClinicalTrials.gov registration number: NCT02535169
Introduction
The prevalence rates of prediabetes, a risk factor for type 2 diabetes (T2D), are increasing in adolescents.1,2 This is concerning as youth with T2D are expected to lose 15 years from their life expectancy. 3 Interventions to improve the health of youth have focused on weight reduction. However, weight loss and maintenance are difficult to attain in adolescents.4,5 Diet composition may play an independent role in the etiology of T2D by influencing insulin dynamics (insulin sensitivity and secretion) and β-cell function.6,7 However, few studies have reported on the associations between diet composition and T2D risk in youth. Additionally, in the literature for both adults and youth, most studies evaluate the role of single nutrients rather than whole foods.6,8 Whole foods capture the complexity of dietary intake and are realistic intervention targets.
Unfortunately, there is a preponderance of youth with poor dietary habits who exceed their discretionary calorie allowance. 9 This is reflected by the fact that the top source of energy, solid fat, and added sugar in the adolescents' diet come from grain-based dessert items. 9 Because desserts, refined grains, 10 and sweetened beverages 7 have been shown to be associated with metabolic syndrome and the development of T2D, we hypothesized that obese youth reporting higher daily intakes of fried foods, packaged snacks, desserts, and sugar-sweetened beverages would have greater glucose excursions in response to an oral glucose challenge. We tested this hypothesis by undertaking a chart review of a clinic population of overweight and obese youth who were undergoing evaluation for risk of T2D to determine relationships between dietary habits and measures of glycemia.
Materials and Methods
The current study is designed as a retrospective, cross-sectional chart review of a population of overweight adolescents who were referred for evaluation of T2D to the Youth Diabetes Prevention Clinic (YDPC) in the Riley Hospital for Children at Indiana University Health in Indianapolis, IN, from September 2013 to December 2014. Inclusion criteria included age 9–21 years and BMI ≥85th percentile for age and sex according to the CDC. 11 Exclusion criteria included pregnancy, use of medications that adversely affect glucose metabolism (such as glucocorticoid-containing medications or atypical antipsychotics), and syndromic obesity (such as Prader–Willi, hypothalamic obesity, or Laurence–Moon–Biedl). The Institutional Review Boards of the Indiana University and Purdue University approved this study (IRB#1306011545).
All measures were obtained during a single visit to the YDPC. Patients younger than 18 years were accompanied by parental guardians who reported on the child's demographic information. Children had measurements of height (to the nearest 0.1 cm) using a wall-mounted stadiometer (Ayrton Model S100, Prior Lake, MN) and measurements of weight (to the nearest 0.1 kg) using a calibrated electronic scale (Scale-Tronix Model 5002, White Plains, NY). Waist circumference was measured by locating the left and right ilium and extending a tape measure around the waist in a horizontal plane, parallel to the floor. 12 The measurement was recorded to the nearest 0.1 cm. BMI was calculated as weight in kilograms divided by height in meters squared (kg/m2). BMI percentiles and z-scores were derived using the US CDC growth charts. 11
Glycemic status was assessed using a 2-hour oral glucose tolerance test (OGTT), which provided a dose of 1.75 g glucose/kg body weight (maximum 75 g), and was performed in the morning after an 8-hour overnight fast. Fasting concentrations of blood glucose and glycosylated hemoglobin (HbA1c) were obtained from the baseline measurement of the OGTT (at the 0-minute time point). Fasting concentrations of glucose and HbA1c were measured with point-of-care testing using i-STAT System (Abbott Point of Care, Princeton, NJ) and DCA Vantage Analyzer (Siemens Medical Solutions USA, Inc., Malvern, PA) instrumentation, respectively. Diagnosis of prediabetes and T2D was based on the American Diabetes Association criteria. 13
Concentrations of plasma lipids [total cholesterol, triglycerides (TG), and high-density lipoprotein (HDL)] were measured in the clinic laboratory using Alere Cholestech LDX System (Alere, Orlando, FL). Low-density lipoprotein (LDL) cholesterol was calculated using the Friedewald equation. 14 Acceptable plasma lipid levels for children and adolescents were compared to the National Cholesterol Education Program Expert Panel on Cholesterol Levels in Children. 15 Blood pressure was measured after 5 minutes of rest on the right arm in the supine position using a sphygmomanometer with an appropriately sized cuff. 16
Measures of dietary intake were obtained from responses to the Bright Futures Adolescent Supplemental Questionnaire, which is used in the YDPC to evaluate multiple determinants of risk for obesity and diabetes. The Bright Futures Guidelines were developed to support primary care practices in providing well-child and adolescent care. 17 The Bright Futures is the recommended clinical screening tool by the Affordable Care Act and assesses multiple health risks, including determinants for diabetes.17,18 Although the questionnaire contains questions related to dietary habits, these questions are structured as yes/sometimes/no responses. Nutrition questions were modified by a dietitian to quantify the daily frequency of consumption of foods that may contribute to T2D. The questions added ask how many times per day adolescents consume fried foods, packaged snack foods, dessert foods, and sugar-sweetened beverages. The standard nutrition questions of the Bright Futures Adolescent Supplemental Questionnaire as well as the added items are presented in Supplementary Table S1 (Supplementary Data are available online at www.liebertpub.com/chi).
Regarding data and statistical analysis, values of means and 95% confidence intervals (CIs) were reported for continuous variables, and numbers and relative frequencies were reported for categorical variables. To reduce skewness, before analyses, a natural logarithmic transformation was applied to BMI, concentrations of fasting plasma glucose, HbA1c, and concentrations of glucose at 2 hours following the OGTT (herein referred to as “OGTT glucose”), and the geometric means and 95% CIs were reported for these variables. Bivariate associations were assessed using Welch two-sample t-test, analysis of variance (ANOVA), or Pearson's product–moment correlation depending on whether the independent variable had two categories, had three categories, or was continuous, respectively. Post hoc comparisons after ANOVA were done using Tukey's honest significant difference (HSD). Very few subjects reported consuming foods five or more times, so these responses were added to the three to four times category, and the new category was appropriately renamed “3 or more times.”
Multiple linear regression models were used to assess the associations between dietary variables and measures of glycemia (concentrations of fasting glucose, HbA1c, and OGTT glucose). Backward elimination was used for variable selection using the lowest Akaike information criterion as the criterion. Variables treated as categorical were compared to a reference group. For dietary variables, the reference group was youth who reported eating food variables 0 times per day. For race and ethnicity, the reference group was Caucasian adolescents. Subjects with unknown race/ethnicity (4%) or who did not complete dietary questions were excluded from some analyses. All analyses were performed using R Statistical Software (R Development Core Team, 2010; R Foundation for Statistical Computing, Vienna, Austria). p-Values ≤0.05 were considered to be statistically significant. Power analysis, conducted retrospectively, revealed that the number of subjects was large enough to provide at least 80% power for testing the associations between glycemia and dietary intake variables for an effect size as low as 0.15. In addition, the use of backward elimination to select only relevant predictors (best model) helps reduce the number of predictor variables and thus ensure high statistical power.
Results
Patient demographic, anthropometric, and metabolic characteristics are shown in Table 1. Of the 146 subjects undergoing diabetes screening, 60% were girls, and 50% were Caucasian, 29% African American, 7% Hispanic/Latino, 2% Asian, and 8% other (multiracial), and 4% were classified as unknown. Subjects were 13.7 years of age (95% CI: 13.3, 14.0).
Characteristics of Patients (N = 146)
Measures presented as geometric mean and variance as 95% CI.
AA, African American; CA, Caucasian; CI, confidence interval; HbA1c, glycosylated hemoglobin; HDL, high-density lipoprotein; LDL, low-density lipoprotein; OGTT, oral glucose tolerance test; T2D, type 2 diabetes.
The majority of patients (92%) were considered to be obese (BMI >95th percentile for age and sex), and 8% were classified as overweight (BMI between 85th and 95th percentiles for age and sex). Girls had a higher BMI than boys (35.1 kg/m2 vs. 32.3 kg/m2, respectively, p = 0.005). In this cohort of adolescents, Hispanic youth had a lower BMI and BMI z-score compared to both Caucasian youth (27.9 kg/m2 vs. 33.9 kg/m2, p = 0.04, and 1.9 vs. 2.3, p = 0.04, respectively) and Black youth (27.9 kg/m2 vs. 36.2 kg/m2, p = 0.003, and 1.9 vs. 2.4, p = 0.007, respectively). Asian youth also had a lower BMI than both Caucasian youth (23.7 kg/m2 vs. 33.9 kg/m2, p = 0.03) and Black youth (23.7 kg/m2 vs. 36.2 kg/m2, p = 0.006) and lower waist circumference compared to Caucasian peers (79.5 cm vs. 107.9 cm, p = 0.03, respectively). All other anthropometric variables (BMI, BMI z-score, and waist circumference) were not statistically significant between gender groups and also ethnicity groups (p > 0.05).
Forty percent of the subjects were diagnosed with prediabetes, while 8% were diagnosed with T2D. Concentrations of fasting glucose and OGTT glucose and HbA1c were comparable between boys and girls (all ps > 0.05). African American youth as well as youth identifying as “other” (multiracial) race/ethnicity had a higher blood concentration of HbA1c compared to Caucasian youth (5.6% and 5.8% vs. 5.4%, p = 0.04, and p = 0.02, respectively).
Besides hyperglycemia, we observed abnormalities in other measures of cardiometabolic health status among subjects, although these were not a focus of the present study. A large proportion of adolescents (62%) had low HDL cholesterol levels (<40 mg/dL). Elevated total cholesterol (≥200 mg/dL), LDL cholesterol (≥130 mg/dL), and TG (≥130 mg/dL) were observed in 14%, 13%, and 38% of youth, respectively.
The data describing frequency of dietary intake demonstrated a wide range of consumption by participants, and we observed dietary behaviors that are considered to be unfavorable. The majority of patients (59%) did not meet the recommendation advising consumption of five servings of fruits and vegetables each day, and the majority (56%) reported consuming more than one fast-food meal each week. In addition, the majority (56%) of patients responded “yes” to drinking more than one sugary beverage each day, and 25% of patients reported that they consumed these beverages three or more times per day. The majority of youth reported that they consumed fried foods (64%), snack foods (50%), and dessert foods (59%) one to two times per day. However, behaviors that were considered to be positive were also found since many (62%) were consuming calcium-rich foods and beverages at a level of three times each day.
Bivariate associations between frequency of consumption for particular foods and measures of glycemia are shown in Table 2. Based on ANOVA, there was a significant association between dessert consumption and OGTT (p = 0.02). Further post hoc analysis showed that subjects consuming desserts three or more times a day had higher OGTT than those not consuming desserts (p = 0.02) (Fig. 1).
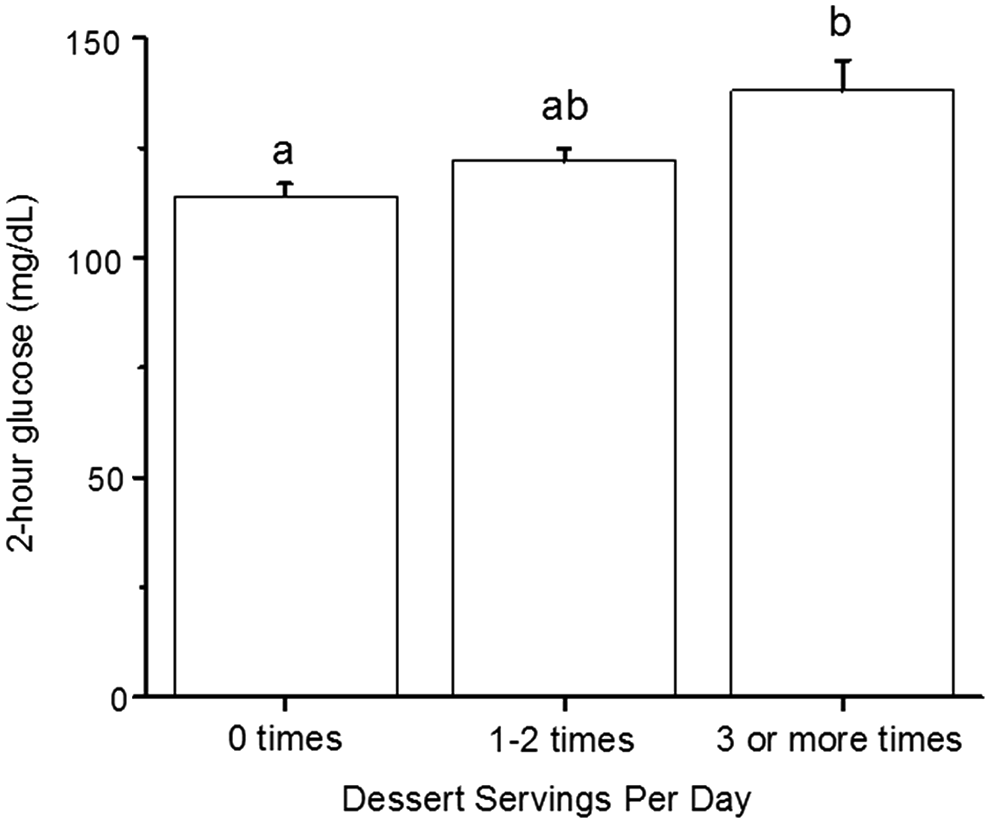
OGTT glucose concentrations among adolescents who reported varied frequencies of dessert servings per day. Values are means and confidence intervals. Means without a common letter are significantly different (p = 0.02, a total of 141 subjects). p-Values are based on Tukey's honest significant difference (HSD) post hoc test. OGTT, oral glucose tolerance test.
Associations between Dietary Behaviors and Measures of Glycemia
p-Values based on ANOVA (n = 139–142 after excluding individuals with missing data). Values are geometric means and 95% CIs. Values presented in bold are significantly different (p < 0.05).
ANOVA, analysis of variance.
We assessed associations between independent variables and measures of glycemia using multiple linear regression, which included the following as predictors: BMI or waist circumference, race/ethnicity, gender, age, and all dietary intake information (Table 3). OGTT glucose concentration was found to be associated with intake of dessert and fast food. Compared with adolescents who reported consuming dessert food items 0 times per day, consuming dessert foods one to two times per day was associated with a 12% higher OGTT glucose concentration, and consuming dessert food items three or more times per day was associated with a 25% higher OGTT glucose concentration. Compared to adolescents who reported consuming packaged snack food items 0 times per day, consuming three or more packaged snack foods was associated with a 4% higher concentration of HbA1c. There were no associations between fasting glucose concentrations and measures of dietary intake. It is noteworthy that measures of adiposity were not associated with measures of glycemia. No relationships were found between measures of glycemia and intakes of fruits and vegetables; however, the measure of fruits and vegetables was qualitative, making it less likely to observe a relationship.
Predictor Variables of Concentrations of OGTT Glucose and HbA1c
Results are based on multiple linear regression with stepwise backward elimination (n = 120 after excluding subjects with missing data). Reference categories for the food group consumption were the zero-frequency categories, while reference category for race was Caucasian subjects.
p < 0.05; **p < 0.01.
Discussion
In the present study, we have shown that dietary behaviors, measured in a clinical setting using a modified version of the Bright Futures Adolescent Supplemental Questionnaire, were associated with elevated glycemia in overweight and obese youth. Youth who consumed more dessert food items (cake, pie, ice cream, or cookies) and more packaged snack foods (potato chips, cookies, and candy) had higher blood OGTT glucose and higher HbA1c concentrations, respectively, compared to those who did not consume these foods, even after control for degree of obesity. Of importance, in this population of overweight and obese youth, measures of adiposity were not associated with measures of glycemia. To our knowledge, this is the first study that has used a modified Bright Futures Adolescent Questionnaire to identify relationships between consumption of specific foods and measures of glycemia in obese adolescents.
In our multiethnic cohort of adolescents, who were mostly obese, we found a high prevalence rate of hyperglycemia (40%). Interestingly, the degree of obesity was not found to be associated with any measure of glycemia similar to what was observed by Sinha et al. 19 This finding is most likely due to the narrow range of adiposity among study participants. Having subjects with a wider range of adiposity would allow for a stronger conclusion on the relationship between adiposity and glycemia. These findings suggest that, in adolescents with existing obesity, dietary intake of desserts and snack foods may make a distinct contribution to risk of T2D and that these foods should be consumed in moderation.
In this clinic population, assessment of dietary intake revealed that between 25% and 60% of participants consumed high intakes of foods that are high in fat or sugar. These data are in line with reports of excessive intake of foods that are high in solid fats and sugars among US adolescents.9,20 We observed a significant association between dessert food item consumption and postprandial glycemia. The cutoff value for IGT has been defined as OGTT glucose ≥140 mg/dL. However, there is compelling evidence that children with OGTT glucose between 130 and 139 mg/dL have similar defects in β-cell function as youth with values between 140 and 199 mg/dL. 21 Some suggest that values following a glucose challenge should be clinically evaluated along a spectrum, rather than focusing on cutoffs, and that increasing along the spectrum represents declines in insulin sensitivity, insulin secretion, and β-cell function. 22 Therefore, we believe that our finding of associations between desserts and higher concentrations of OGTT glucose is clinically significant.
Our finding that fast-food consumption was associated with lower OGTT glucose was surprising. However, the information we obtained on fast-food consumption was on frequency and not on dietary quality. Therefore, more detailed information is needed to interpret how fast-food consumption affects glycemia. In addition, the associations between fast-food consumption may be spurious due to multiple comparisons as we did not control for this statistical phenomenon.
Consuming packaged snack foods three or more times per day was associated with HbA1c concentration of 5.6%, which approaches the diagnostic cutoff value for prediabetes of 5.7%, and thus, we believe this finding to be clinically significant. Our finding suggests that intake of snack foods could be a modifiable target to improve glycemia in youth. We also found that African American youth were associated with high HbA1c, which is supported by evidence of higher HbA1c levels for a given glucose concentration in African Americans compared to Caucasians. 23 It is important to note that criticism exists regarding the use of the thresholds for HbA1c as a diagnostic criterion for prediabetes. 24
It is not surprising that we found no association between dietary variables and concentrations of fasting plasma glucose. Adolescents with IGT can have normal concentrations of fasting glucose as this is generally the last parameter to appear as abnormal in youth with developing diabetes. 19 Thus, OGTT glucose levels reflect the pathophysiology of diabetes better than fasting glucose since this test represents a challenge to pancreatic β-cells. Additionally, HbA1c reflects longer term exposure of the systemic circulation to glucose. The associations we observed among OGTT glucose, HbA1c, and dietary intake are likely due to the fact that these measures of glycemia are dynamic. This suggests that adolescents with existing hyperglycemia may be overlooked if only fasting glucose is used for diagnosis. It is feasible that problematic dietary behaviors, identified by the modified Bright Futures Adolescent Questionnaire, can alert practitioners to derangement of glucose tolerance so that a diabetes screening using the OGTT can be performed.
To our knowledge, this is the first study to implicate whole foods rather than nutrients as a risk factor for diabetes in children. We suspect that the associations between desserts and packaged snacks with glycemia are due to the high density of energy, solid fat, and simple sugars in these food items. Studies have found independent associations between high fat and sugar intake and measures of glycemia and insulin dynamics in children. Prince et al. 8 found that high total fat intake was associated with insulin resistance in overweight 8- to 17-year-olds. Davis et al. 25 found that higher total sugar intake was associated with lower acute insulin secretion and lower β-cell function in 63 overweight Latino children. The mechanisms underlying the associations between specific nutrients (saturated and trans-fatty acids and sugars) and diabetes risk may involve the induction of postprandial hyperglycemia following ingestion of foods, which have a high glycemic index/load or impairment on insulin sensitivity and β-cell function, and these pathways remain under investigation.6,26
There are some limitations in this study, many of which relate to the fact that it was retrospective in design. Tanner stages were not included in the analysis, which may confound the associations observed, as puberty is an established risk factor for insulin resistance. 27 However, age and puberty are highly related, and therefore, others have used age as a suitable measure of maturity. 28 Due to the retrospective nature of the study, we also were not able to explore the mechanisms that underlie the associations we observed. Additionally, because of the cross-sectional study design, we are not able to show relationships that are cause and effect. The study may be at risk for referral bias since providers send youth who have laboratory evidence of prediabetes to the YDPC for further evaluation. This may limit our ability to make generalized comparisons with a random obese population outside diabetes clinics. It is also difficult to distinguish if the associations between elevations in glycemia and dietary intake are representative of recent or long-term intakes of these foods. Finally, the modified Bright Futures Questionnaire is not a validated Food Frequency Questionnaire, so application of the results should be done cautiously. Despite the limitations, the strengths of this study include having an ethnically diverse population of adolescents, which makes our findings generalizable to a wide demographic. We demonstrated that the modified Bright Futures Adolescent Questionnaire can be used to explore diet and disease relationships, even though the questionnaire was not designed for use in research. Currently, the questionnaire is a clinical assessment tool to alert practitioners to unhealthy behaviors, including risk factors for obesity and diabetes. Thus, our findings that a modified Bright Futures Adolescent Supplemental Questionnaire can identify overweight youth who may be at a high risk for hyperglycemia and require screening can be translated to the clinical setting. Future studies should use more detailed and objective measures to identify nutrients within the foods that we found to be associated with measures of glycemia as well as to identify other foods that are associated with T2D.
In conclusion, the results demonstrate that in overweight and obese adolescents, high consumption of dessert food items and packaged snack foods may be associated with increased OGTT glucose and HbA1c concentrations. While these findings need to be replicated in a longitudinal study, our findings suggest that foods that are commonly consumed by adolescents may have detrimental effects on glucose homeostasis and diabetes risk. Therefore, physicians should capture dietary information in adolescents who are obese. This information can be valuable in terms of uncovering potential future risk of T2D.
Acknowledgment
This publication was made possible, in part, with support from the Indiana Clinical and Translational Sciences Institute funded, in part, by Project Development Teams (PDT) pilot grants (grant no. UL1TR001108) from the NIH, National Center for Advancing Translational Sciences, Clinical and Translational Sciences Award. Other support included funding from the Riley Hospital for Children at Indiana University Health and the Center for Pediatric Obesity and Diabetes Prevention Research.
Footnotes
Author Disclosure Statement
No competing financial interests exist.
References
Supplementary Material
Please find the following supplemental material available below.
For Open Access articles published under a Creative Commons License, all supplemental material carries the same license as the article it is associated with.
For non-Open Access articles published, all supplemental material carries a non-exclusive license, and permission requests for re-use of supplemental material or any part of supplemental material shall be sent directly to the copyright owner as specified in the copyright notice associated with the article.