
Abstract
Abstract
Background:
The genetic contribution to obesity and to circulating adipokine levels has not been completely clarified. We aimed to evaluate adipokine genes' single-nucleotide polymorphism (SNP) prevalence and its association with circulating adipokine levels and risk factors for cardiovascular disease in an obese Portuguese pediatric population.
Methods:
Two hundred forty-eight obese adolescents (mean age 13.4 years old; 47.2% females) participated in a cohort study. We screened 12 SNPs by direct sequencing in five adipokine genes: adiponectin (ADIPOQ: rs16861194, rs17300539, rs266729, rs2241766, rs1501299), interleukin-1β (IL-1β; rs1143627), IL-6 (IL-6; rs1800795), tumor necrosis factor-α (TNF-α; rs1800629), and resistin (RETN; rs1862513, rs3219177, rs3745367, rs3745368). Biochemical analysis included determination of circulating adipokines, C-reactive protein (CRP) levels, lipid profile, and markers of insulin resistance.
Results:
Compared to males, females presented higher circulating levels of insulin, adiponectin, IL-6, resistin, and leptin concentrations, but lower TNF-α levels. No statistically significant differences were found for genotype or allelic distributions between genders. In the whole sample population, adiponectin levels were influenced by ADIPOQ rs17300539 (c.-1138G>A; lower in subjects with GG genotype). When only males were considered, IL-1β, IL-6, and TNF-α levels were associated with ADIPOQ rs1501299 (c.214 + 62G>T; higher in GG subjects). TNF-α concentrations were modulated by TNF-α rs1800629 (c.-488G>A; lower in GG males), RETN rs1862513 (c.-216C>G; higher in CC subjects), and RETN rs3219177 (c.118 + 39C>T; higher in CC subjects). Leptin levels were influenced by IL-1β rs1143627 (c.-118C>T) presenting TT individuals' lower levels.
Conclusions:
Our data demonstrate that in pediatric obese patients, some adipokine gene SNPs have an association with circulating adipokine levels and lipid profile.
Introduction
The contribution of genetic factors to the development of obesity has been widely recognized, but the genes involved have not been fully clarified.
The adipose tissue is a metabolically active organ, secreting adipokines, including adiponectin, interleukin (IL)-6, IL-1β, tumor necrosis factor (TNF)-α, leptin, and resistin.1,2 There is increasing evidence that these adipokines are involved in obesity-related inflammation and comorbidities. IL-1β and TNF-α are important in insulin resistance (IR) and in the atherosclerotic process. 1 IL-6 has also been associated with IR, but its role has not been fully understood; actually, it has been reported that IL-6 enhances insulin-stimulated glucose disposal in humans in vivo. 3 Leptin is involved in body energy homeostasis (inhibits food intake), but in most cases of obesity, a state of leptin resistance develops. 4 Furthermore, serum leptin levels seem to reflect the body fat mass, and high levels of leptin seem to enhance Th1 immune responses and increase macrophage activity, with production of different cytokines, namely TNF-α. 5 Regarding resistin, recent literature refers to it as an important proinflammatory adipokine, with a role in metabolic syndrome, type 2 diabetes, and cardiovascular diseases (CVD). 6 In contrast, adiponectin has been referred as an important antiatherogenic, antidiabetic, and anti-inflammatory protein. 7 However, contrarily to other adipokines, plasma concentrations of adiponectin are decreased in obese subjects.
Although atherosclerosis is a chronic disease that begins early in life and obesity is an important risk factor for the development of CVD, there are few studies addressing adipokines and genetic polymorphisms potentially associated with CVD in obese adolescents. This is of particular concern in Portugal, considering the high prevalence of pediatric obesity8,9 and of cerebrovascular disease later in life in our population. 10
A genetic contribution to the development of obesity has been widely recognized, but genes involved have not been completely clarified. Some studies demonstrated an association between adipokine single-nucleotide polymorphisms (SNPs) and obesity. 11
It was demonstrated that IL-1β genetic variation may have a role in C-reactive protein (CRP) level regulation and that this association may be modified by obesity. 12 Some studies also suggest that variations in other genes, namely adiponectin (ADIPOQ) 13 and IL-6, 14 associate with obesity, but the mechanisms underlying these possible associations are not fully understood. Moreover, a common polymorphism in the promoter region (c.-488G>A) of TNF-α seems to be linked to an increased risk for the development of IR in obese subjects 15 and to contribute to the determination of obesity and obesity-associated hypertension. 16 Finally, genetic variants at the resistin (RETN) locus appear to be associated with plasma resistin concentrations and CV risk factors. 17 It would be important to clarify the contribution of these and other genes to obesity and its related complications, particularly in pediatric obesity.
The aim of this study was to evaluate (1) the prevalence in obese Portuguese adolescents of genetic polymorphisms associated with adipokines, namely ADIPOQ, IL-1β, IL-6, TNF-α, and RETN and (2) the influence of the polymorphisms on adipokine levels and on other biochemical variables (blood CRP level, lipid profile, and markers of IR).
Methods
Subjects
Two hundred forty-eight (248) obese adolescents [11–17 years (mean 13.4); 47.2% females] participated in the study. The population was identified from medical records, at two outpatient clinics of pediatric obesity in Oporto, and invited to participate.
Exclusion Criteria and Ethical Approval
Smokers and subjects under regular medication or with diabetes mellitus, endocrinologic disorders, inflammatory or infectious diseases were excluded.
The study protocol was approved by the Committee on Ethics of Porto Hospital Centre and the Committee on Ethics of Hospital São João. The nature, benefits, and risks of the study were explained to the volunteers. The parent's written informed consent was obtained before the study, consistent with the Declaration of Helsinki.
Procedures and Assays
Anthropometric and nutritional characterization and clinical evaluation
Height, weight, and waist circumference were measured. Obesity was defined as BMI >2 standard deviations above age- and sex-specific World Health Organization (WHO) reference medians. 18
The development of puberty was clinically assessed on the basis of Tanner stages.
Blood samples
The participants came to research centers after an overnight fast (10–12 hours) and, after clinical examination, blood was collected by venipuncture in EDTA-containing tubes and processed within 2 hours of collection. Aliquots of buffy coat and plasma were made and immediately stored at −80°C until assayed.
Plasma lipids
Plasma lipid and lipoprotein profile analysis was performed in an autoanalyzer (Cobas Mira S; Roche) using commercially available kits. Total cholesterol (TChol), triglycerides (TG), and high-density lipoprotein cholesterol (HDLc) concentrations were determined by enzymatic colorimetric tests (CHOD-PAP, GPO-PAP, and Direct HDL_cholesterol methods; Roche Diagnostics, respectively). Low-density lipoprotein cholesterol (LDLc) concentration was calculated using the Friedewald formula [LDLc = TChol − HDLc − (TG/5)]. 19
Glucose metabolism
The determination of circulating levels of glucose and insulin was performed by using routine automated technology (ABX Diagnostics). Homeostasis model assessment of insulin resistance (HOMAIR) was determined by using the following formula: resistance (HOMAIR) = [fasting insulin (μU/mL) × fasting glucose (mg/dL)/405]. 20
C-reactive protein
Plasma levels of CRP were evaluated by immunoturbidimetry [CRP (latex) High-Sensitivity; Roche Diagnostics].
Adipokines
Plasma concentrations of adipokines were determined by enzyme-linked immunosorbent assay (ELISA): adiponectin, resistin, leptin, and IL-6 were measured using kits from Bender MedSystems (Human Adiponectin BMS2032, Human Resistin BMS 2040, Human Leptin BMS2039, and Human IL-6 BMS213HS, respectively); IL-1β and TNF-α were evaluated with kits from R&D Systems (Human TNF-alpha Quantikine HS ELISA kit and Human IL-1beta Quantikine HS ELISA, respectively).
DNA analysis
Genomic DNA was extracted from buffy coat by the proteinase K/salt precipitation method.17,21 We screened 12 SNPs in 5 adipokine genes: adiponectin (ADIPOQ: rs16861194, rs17300539, rs266729, rs2241766, rs1501299), interleukin-1β (IL-1β; rs1143627), IL-6 (IL-6; rs1800795), tumor necrosis factor-α (TNF-α; rs1800629), and resistin (RETN; rs1862513, rs3219177, rs3745367, rs3745368). All SNPs were screened by direct sequencing. First, the regions of interest were amplified from genomic DNA with specific primers (Table 1), using 50 ng of genomic DNA in 25 μL of reaction mixture, containing DreamTaq™ Green PCR Master Mix (Thermo Scientific™), and 0.5 μmol of forward and reverse primers. The polymerase chain reaction (PCR) was performed in the thermal cycler GeneAmp® PCR System Veriti (Applied Biosystems) under the following conditions: first denaturation at 95°C for 5 minutes, followed by 35 cycles of 30 seconds at 95°C, 30 seconds at annealing temperature and for 1 minute at 72°C. The cycles were followed by final elongation for 10 minutes at 72°C and cooling at 15°C. The PCR products obtained were cycle sequenced using the BigDye Terminator Cycle Sequencing Kit V3.1., in the thermal cycler GeneAmp® PCR System 9800 (Applied Biosystems) using standard protocols. Finally, the sequencing reaction products were analyzed in an ABI PRISM 3130xl Genetic Analyzer (Applied Biosystems).
List of Primer Sequences for Polymerase Chain Reaction Amplifications
ADIPOQ, adiponectin; IL, interleukin; RETN, resistin; SNP, single-nucleotide polymorphism; TNF, tumor necrosis factor.
Statistical Analysis
Statistical analysis was performed using the Statistical Package for Social Sciences (SPSS, version 22.0) for Windows. Kolmogorov–Smirnov analysis was used to test if the results were normally distributed. The results normally distributed are presented as mean ± standard deviation and those not normally distributed are presented as median (interquartile range). Male and female patients were compared using Student's unpaired t-test or the Mann–Whitney U test. The distribution of males and females, with respect to genotypes and other categorical variables, and genotype frequencies, for Hardy–Weinberg equilibrium, were analyzed using the chi-squared (χ2) test and Fisher's exact test. The association of polymorphisms with adipokine levels was assessed using multiple regression analysis, adjusting for age, gender, and BMI. The strength of the association between the variables was estimated by calculating Spearman's correlation coefficient. Significance was accepted at p < 0.05.
Results
Influence of Gender, Age, and Anthropometric Parameters on Biochemical Variables
The anthropometric and biochemical parameters of the total obese adolescent sample, and separated according to gender, are presented in Table 2. Males and females were matched for age and BMI z-score (BMIzsc), and therefore, the analysis of biochemical variables between genders was not greatly affected by these factors. No statistically significant differences were found for lipid profile between genders. Insulin levels were higher for girls (HOMAIR values were also higher but did not reach statistical significance). Adiponectin, IL-6, resistin, and leptin concentrations were higher for females, whereas the TNF-α level was lower.
Anthropometric and Biochemical Data of Total Sample Population and According to Genders
Male versus female. Results are presented as mean ± standard deviation or median (interquartile range).
BMI, body mass index; CRP, C-reactive protein; HDLc, high-density lipoprotein cholesterol; HOMAIR, homeostatic model assessment of insulin resistance; IL, interleukin; LDLc, low-density lipoprotein cholesterol; TChol, total cholesterol; TG, triglycerides; TNF, tumor necrosis factor.
Age and BMIzsc were inversely related with plasma adiponectin levels (r = −0.165, p < 0.05 and r = −0.132, p < 0.05, respectively), while positively related with levels of IL-6 (r = 0.156, p < 0.05 and r = 0.348, p < 0.01, respectively), CRP (r = 0.205, p < 0.05 and r = 0.387, p < 0.01, respectively), and leptin (r = 0.155, p < 0.05 and r = 0.547, p < 0.01, respectively). BMIzsc was also positively related with TNF-α plasma concentration (r = 0.150, p < 0.05). BMI, waist circumference, and waist-to-height ratio values presented very similar correlations to those observed with BMIzsc (Supplementary Table S1; Supplementary Data are available online at www.liebertpub.com/chi).
Plasmatic levels of the different adipokines also correlated with each other (Supplementary Table S1). In our sample, IL-6 levels correlated positively with TNF-α (r = 0.248), leptin (r = 0.334), and CRP (r = 0.532; p < 0.01 for all); leptin was positively associated with resistin (r = 0.240, p < 0.01); and CRP levels correlated positively with TNF (r = 0.158, p < 0.05) and leptin (r = 0.318, p < 0.01), while presenting a negative association with adiponectin (r = −0.131, p < 0.05).
Some associations of adipokines with routine biochemical markers were also found (Supplementary Table S1). Regarding the lipid profile, TG was inversely associated with adiponectin (r = −0.142, p < 0.05), while positively related to IL-6 (r = 0.160, p < 0.05), TNF-α (r = 0.256, p < 0.01), resistin (r = 0.129, p < 0.05), and leptin (r = 0.296, p < 0.05). HDLc was positively related to adiponectin (r = 0.289, p < 0.01) and inversely associated to IL-6 (r = −0.232, p < 0.01). In relation to IR, HOMAIR was inversely related to adiponectin (r = −0.228, p < 0.01) and positively associated to IL-6 and leptin (r = 0.147, p < 0.05 and r = 0.357, p < 0.01, respectively).
Overall Analysis of Adipokine Gene Polymorphisms
The allele frequency and genotype frequency distributions of the studied adipokine genetic polymorphisms among overall patients, and divided according to gender, are presented in Tables 3 and 4, respectively. No statistically significant differences in the distributions of adipokine genotypes or alleles were found between males and females, for any studied SNP.
Allele Percentages of Adipokine Gene Polymorphisms among Overall Patients and According to Genders
Male versus female.
ADIPOQ, adiponectin; ID, identification; IL, interleukin; SNP, single-nucleotide polymorphism; RETN, resistin; TNF, tumor necrosis factor.
Genotype Distribution Percentages of Adipokine Gene Polymorphisms among Overall Patients and According to Gender
Male versus female.
ADIPOQ, adiponectin; CHm, common homozygous; Hz, heterozygous; ID, identification; IL, interleukin; RHm, rare homozygous; RETN, resistin; SNP, single-nucleotide polymorphism; TNF, tumor necrosis factor.
All the SNPs were in the Hardy–Weinberg equilibrium with the exception of ADIPOQ c.-1124C>G (p = 0.013) and ADIPOQ c.214 + 62G>T (p = 0.016).
As significant differences were observed in plasma adipokine and insulin levels between genders, the associations of SNPs with biochemical variables were adjusted for gender. Due to physiological changes in biochemical variables with age and BMI, the associations with SNPs were also adjusted for those parameters.
The analysis of each adipokine level according to all studied SNPs was performed (Supplementary Table S2). These associations will be discussed separately within each genetic polymorphism.
Adiponectin Polymorphisms
The region of interest in ADIPOQ is highly polymorphic, and therefore, we screened this gene for five polymorphisms. The overall frequency of the less common alleles of the ADIPOQ rs16861194 (c.-1173A>G), rs17300539 (c.-1138G>A), rs266729 (c.-1124C>G), rs2241766 (c.45T>G), and rs1501299 (c.214 + 62G>T) polymorphisms was 10.3%, 10.7%, 22.8%, 13.9%, and 29.2%, respectively (Table 3). The different genotype distributions are shown in Table 4. These distributions were similar to those presented in other studies.22,23
ADIPOQ rs16861194 (c.-1173A>G)
For this SNP, only two GG individuals were identified, and thus, variations between these individuals and the other genotypes were not studied. AA males presented higher adiponectin levels (p < 0.05). No differences were found between AA and AG subjects for anthropometric or other biochemical variables.
ADIPOQ rs17300539 (c.-1138G>A)
When the whole population was considered, ADIPOQ c.-1138G>A polymorphism was associated with plasma adiponectin levels presenting subjects with GG genotype lower values when compared to GA subjects (p < 0.05) (Fig. 1).
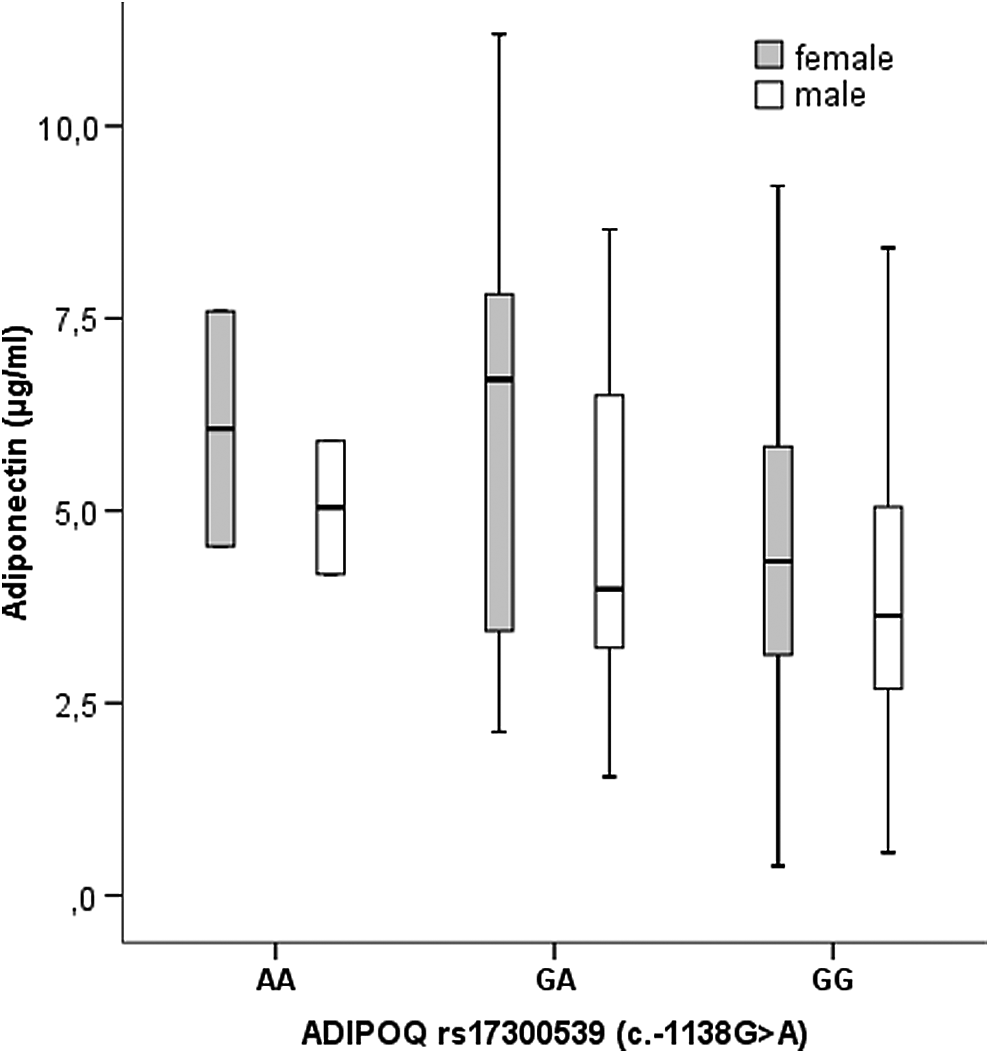
Association of plasma adiponectin levels with ADIPOQ rs17300539 (c.-1138G>A) according to gender. The boxes represent the IQR, with the upper and lower edges of the boxes representing the 75th and 25th percentiles, respectively. The central horizontal lines within the boxes represent median levels for each group. The vertical whiskers above and below the boxes represent the range of outlying data point up to 1.5 times the IQR. GG homozygous presented lower adiponectin levels (p < 0.01) by multiple regression analysis adjusted for age, gender, BMI, and BMI z-score. ADIPOQ, adiponectin gene; BMI, body mass index; IQR, interquartile range.
GG individuals also presented lower levels of LDLc (p < 0.05) and borderline lower levels of TChol (p = 0.068); these results were more significant in males, with TChol reaching statistical significance (p < 0.05).
ADIPOQ rs266729 (c.-1124C>G)
No differences were found between the different genotypes regarding adipokine levels. Nevertheless, a borderline trend for lower levels of adiponectin for GG homozygous was present, particularly in females.
Regarding the lipid profile, TChol and LDLc were consistently greater for GG individuals when compared to CG (p < 0.01) and CC (p < 0.05) subjects. On the contrary, glucose levels were lower for CC individuals (p < 0.05 when compared to CG subjects).
ADIPOQ rs2241766 (c.45T>G)
Regarding this polymorphism, only two GG individuals were identified, and thus, no further analysis was made for this group. We did not find differences when comparing TT and TG individuals, but a trend toward lower adiponectin levels was present in TT homozygous.
Through multiple regression analysis, LDLc tends to be higher and HDLc/TChol lower in TT individuals (p < 0.05).
ADIPOQ rs1501299 (c.214 + 62G>T)
Subjects with TT genotype presented the highest adiponectin levels, even though without statistical significance (Fig. 2). Lower levels of IL-1β (p < 0.01), IL-6, and TNF-α (p < 0.05 for both) were also observed in TT males by multiple regression analysis (Fig. 2).
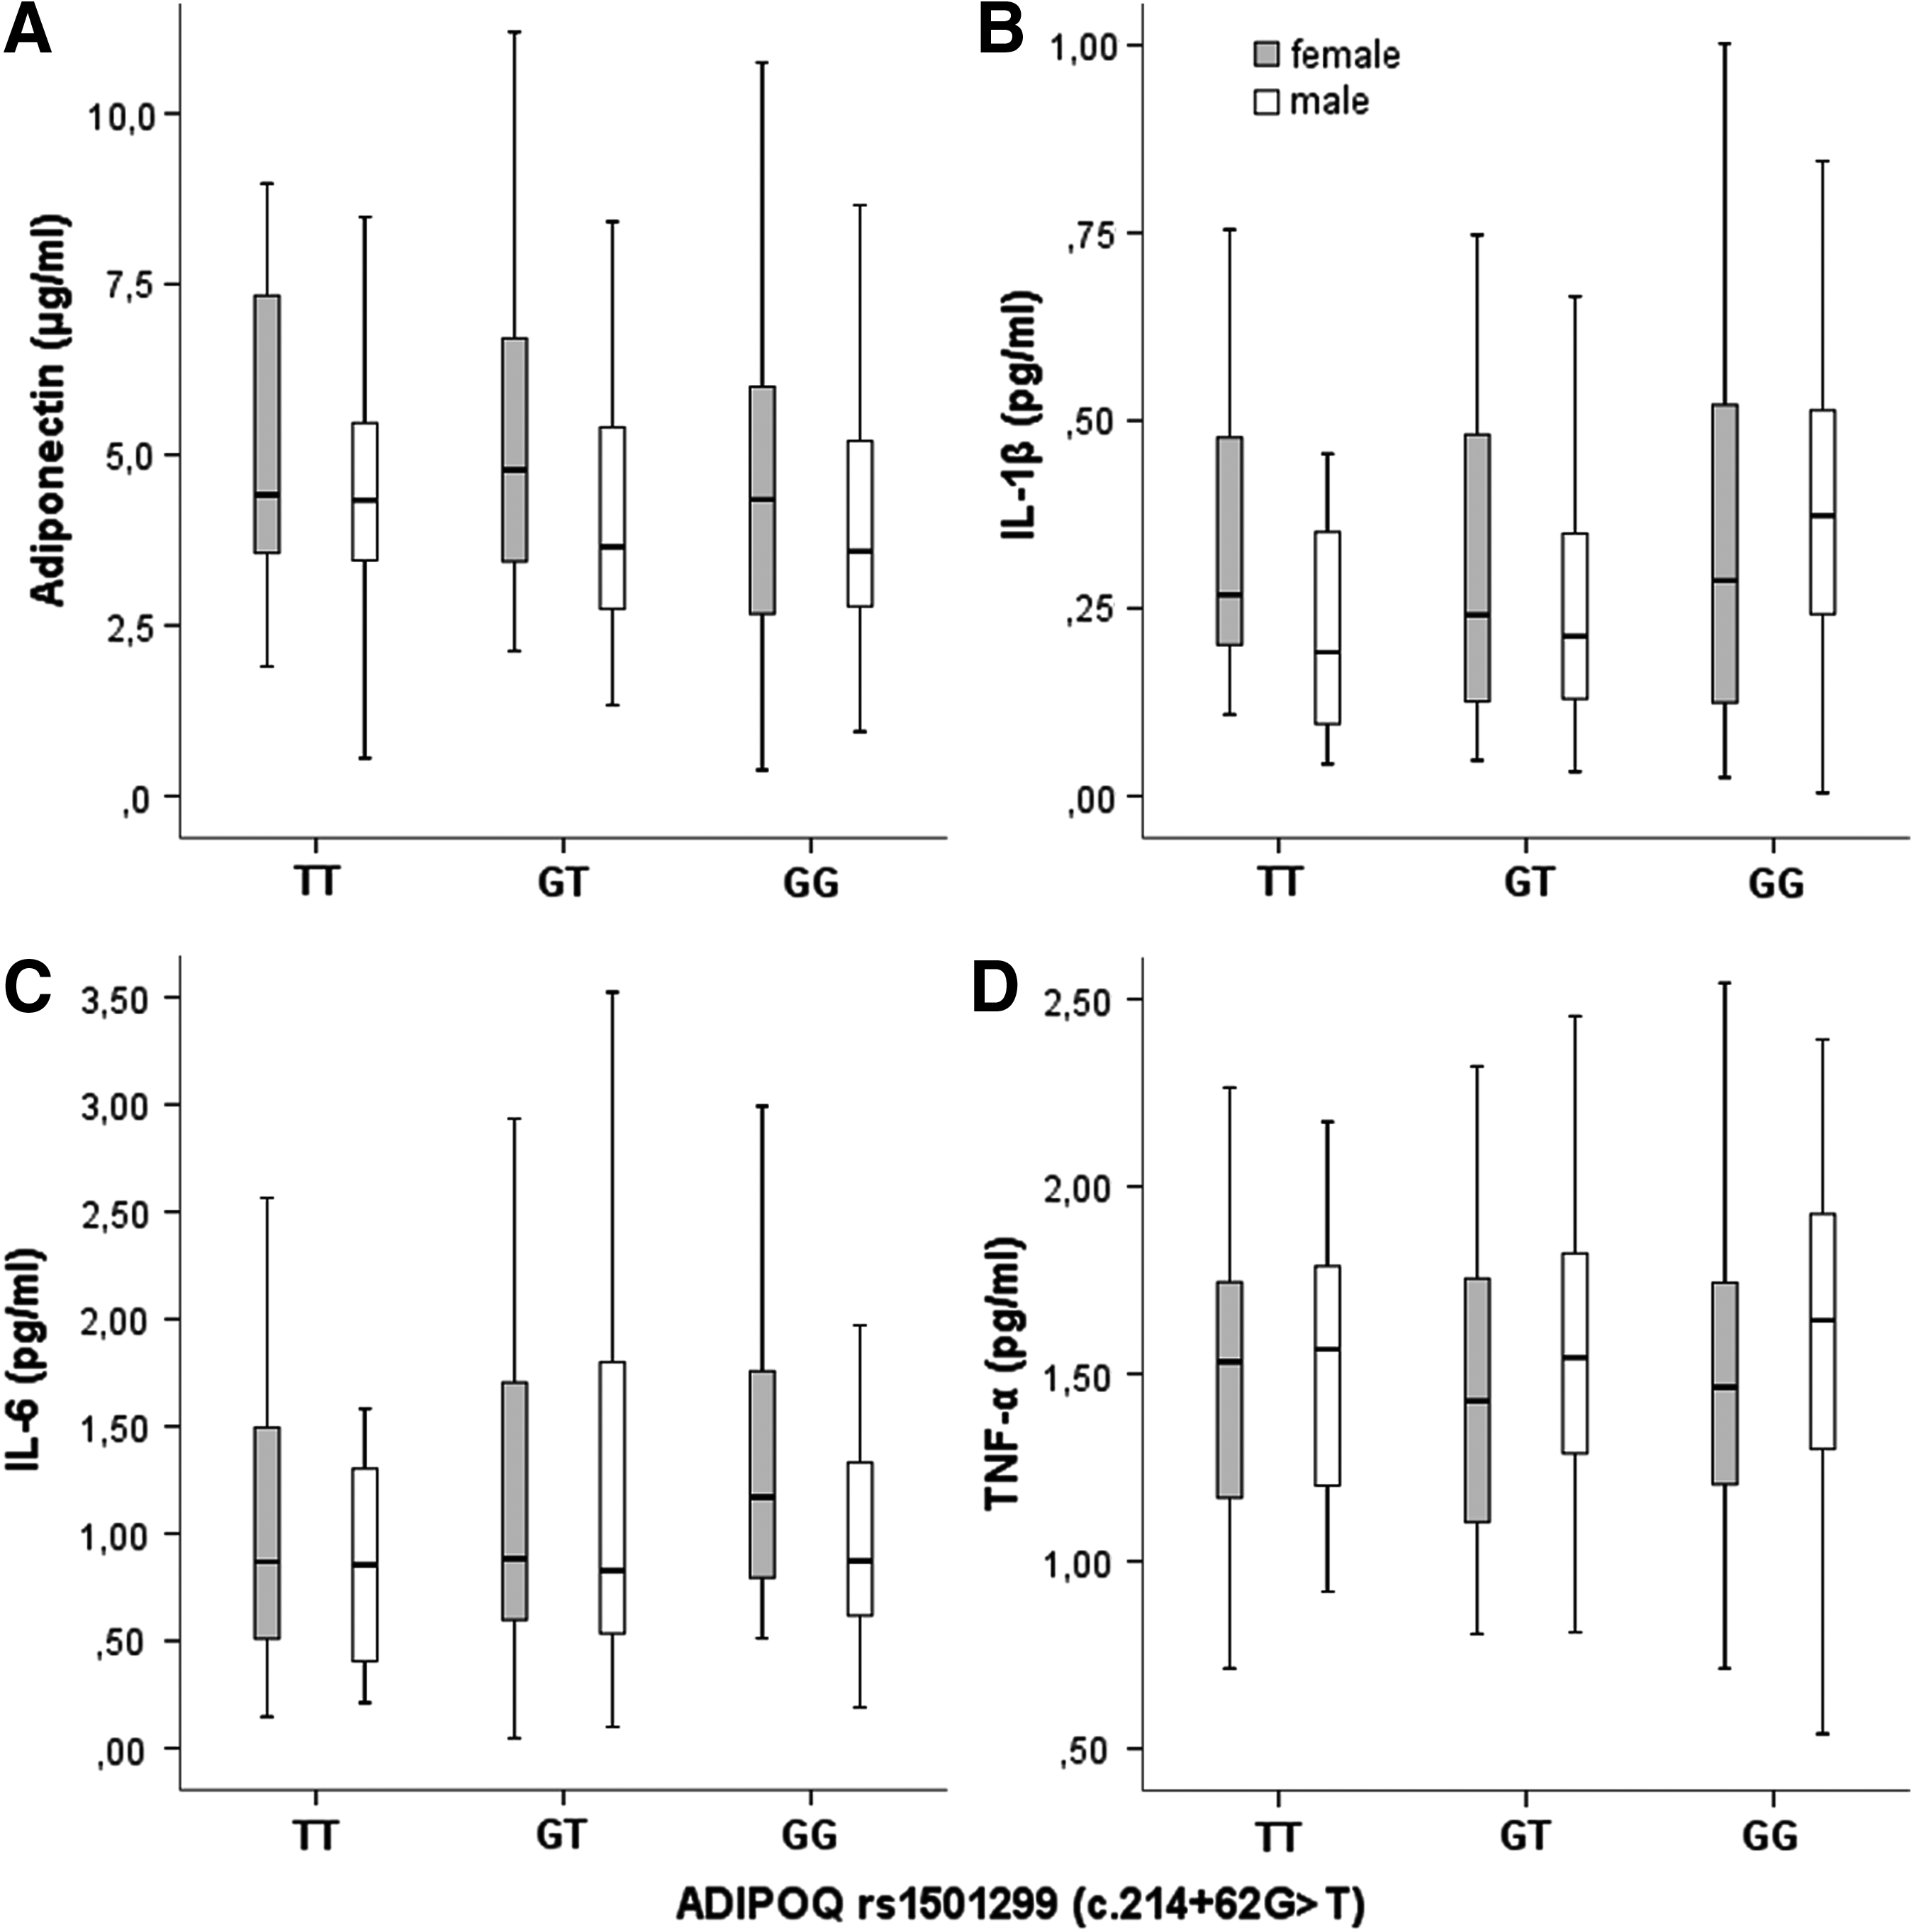
Association of ADIPOQ rs1501299 (c.214 + 62G>T) with adiponectin (A), IL-1β (B), IL-6 (C), and TNF-α (D) levels, according to gender. The boxes represent the IQR, with the upper and lower edges of the boxes representing the 75th and 25th percentiles, respectively. The central horizontal lines within the boxes represent median levels for each group. The vertical whiskers above and below the boxes represent the range of outlying data point up to 1.5 times the IQR. GG homozygous males presented higher IL-1β (p < 0.01), IL-6, and TNF-α (p < 0.05 for both) by multiple regression analysis adjusted for age, gender, BMI, and BMI z-score. No significant difference was found for adiponectin. IL, interleukin; TNF-α, tumor necrosis factor-α; ADIPOQ, adiponectin gene; BMI, body mass index.
Regarding the lipid profile, TChol and LDLc tended to be lower in GG subjects (by multiple regression analysis).
ADIPOQ allelic combinations
ADIPOQ allelic combinations of the five studied SNPs did not show differences regarding gender distribution. In our population, a total of 39 different allele combinations were present, most of them with only 2 or 3 cases. To perform an adequate analysis, only groups with more than 12 individuals (5% of the population) were compared in a total of 7 groups (SNP combination order: rs16861194/rs17300539/rs266729/rs2241766/rs1501299: group 1, AA/GG/CC/TT/GG; group 2, AA/GG/CC/TT/GT; group 3, AA/GG/CG/TG/GG; group 4, AA/GG/CC/TG/GG; group 5, AG/GG/CC/TT/GT; group 6, AA/GG/CG/TT/GG; group 7, AA/GG/CG/TT/GT).
The group 7 presented the lowest IL-1β and IL-6 levels of all groups, reaching statistical significance for IL-1β when compared to group 4, and for IL-6 when compared to groups 1, 2, and 6 (Supplementary Table S3). No further association between adiponectin SNP combinations and other biochemical and anthropometric variables was seen.
IL-1β Polymorphism
The frequency of the IL-1β rs1143627 (c.-118C>T) polymorphism less common allele was 32.4% (Table 3), and the overall genotype frequencies of TT, TC, and CC genotypes were 46.4%, 42.3%, and 11.3%, respectively (Table 4). This distribution is similar to that found in other Caucasian populations. 24
The c.-118C>T SNP was closely associated with leptin levels. Individuals with the TT genotype presented lower levels of leptin by linear regression analysis (p < 0.05) (Supplementary Table S2). CC individuals presented increased IL-1β levels; however, it did not reach statistical significance.
Regarding markers of glucose metabolism, CC individuals presented higher levels of glucose when compared to TT (p < 0.01) and TC (p < 0.05), although without differences in insulin or HOMAIR. The increased levels of glucose in CC homozygous were kept through linear regression analysis, even when controlled to age, gender, BMI, and BMIzsc.
This polymorphism was not associated with the lipid profile.
IL-6 Polymorphism
The prevalence of the IL-6 c.-237C>G polymorphism less frequent allele was 31.4% (Table 3), and the overall genotype frequencies of GG, GC, and CC genotypes were 45.6%, 46.0%, and 8.4%, respectively (Table 4). This genotype distribution is similar to those previously described.25,26
The rs1800795 polymorphism was not associated with IL-6 level or with routine biochemical variables (lipid profile and glucose metabolism).
TNF-α Polymorphism
The overall A allele frequency of the TNF-α c.-488G>A polymorphism was 13.3% (Table 3), and the overall genotype frequencies of GG, GA, and AA genotypes were 74.6%, 24.2%, and 1.2%, respectively (Table 4). The genotype distribution was similar to that described in another study. 27
The GG individuals presented lower levels of TNF-α when compared to GA subjects, however, it only reached statistical significance for males (p < 0.05).
We did not find any association of c.-488G>A polymorphism with glucose metabolism markers.
Resistin Polymorphisms
The overall less common allele frequencies of the RETN rs1862513 (c.-216C>G), rs3219177 (c.118 + 39C>T), rs3745367 (c.118 + 181G>A), and rs3745368 (c.*62G>A) polymorphisms were 33.7%, 21.2%, 29.4%, and 5.0%, respectively (Table 3). The different genotype distributions are shown in Table 4. These distributions are similar to the ones seen in other populations.17,28–30
RETN rs1862513 (c.-216C>G)
The RETN c.-216C>G (Fig. 3A) polymorphism was associated with plasma TNF-α concentrations in females, TNF-α levels being higher in CC subjects (p < 0.05) (Supplementary Table S2). Contrarily, no differences were found in resistin levels according to the genotype.

Association of RETN rs1862513 (c.-216C>G) (A) and RETN rs3219177 (c.118 + 39C>T) (B) with TNF-α concentrations, according to gender. The boxes represent the IQR, with the upper and lower edges of the boxes representing the 75th and 25th percentiles, respectively. The central horizontal lines within the boxes represent median levels for each group. The vertical whiskers above and below the boxes represent the range of outlying data point up to 1.5 times the IQR. CC homozygous of both polymorphisms present higher TNF-α (p < 0.05 for both) by multiple regression analysis adjusted for age, gender, BMI, and BMI z-score. BMI, body mass index; RETN, resistin gene; TNF, tumor necrosis factor.
Regarding the lipid profile, increased levels of TChol and LDLc (p < 0.05) and a decreased HDLc/TChol ratio (p < 0.01) were seen in CC individuals versus CG subjects. A lower HDLc/TChol ratio (p < 0.05) was also present in CC individuals versus GG subjects.
RETN rs3219177 (c.118 + 39C>T)
We found increased levels of resistin in CT versus TT individuals (p < 0.05).
Regarding TNF-α and the lipid profile, subjects with CC genotype presented with increased TNF-α (p < 0.05; Fig. 3B), TChol, and LDLc (p < 0.01 for both), and lower HDLc/TChol (p < 0.05) when compared to the other two genotypes.
RETN rs3745367 (c.118 + 181G>A)
The c.118 + 181G>A polymorphism was closely related to the lipid profile. Homozygous GG individuals presented greater TChol e and LDLc levels than GA (p < 0.01), and AA subjects presented higher values of HDLc/TChol ratio when compared to GG and higher HDLc levels when compared to GA individuals (p < 0.05 for both). A trend toward a worse lipid profile from AA to GG was also seen by linear regression analysis.
No differences in resistin levels between genotypes were found.
RETN rs3745368 (c.*62G>A)
No AA individuals were identified in our population.
The G allele was associated with a worse lipid profile; however, it only reached statistical significance for females, with GG subjects presenting greater levels of TChol and LDLc and lower levels of HDLc/TChol (p < 0.05 for all) when compared to GA subjects.
No differences between the heterozygous and the GG individuals were found regarding markers of inflammation and glucose metabolism.
RETN allelic combinations
An analysis regarding the combination of the different studied resistin SNPs was made. We found in our population, 19 combinations of the 4 studied RETN SNPs. No difference was present regarding gender distribution among these combinations. To allow an accurate analysis, only the groups presenting at least 5% (n = 12) of the population were studied. Three combinations presented the referred minimum frequency in the population: the used SNP combination order was rs1862513/rs3745368/rs3219177/rs3745367 and defined the followed groups: group 1, CC/CC/GG/GG; group 2, CG/CC/GA/GG; and group 3, CG/CT/GA/GA.
The group 1 presented the highest levels of TChol and LDLc, reaching statistical significance when compared to group 3. TNF-α was also raised in group 1 versus group 3 in females (p < 0.05).
No significant association was found for the other studied variables.
Discussion
Influence of Gender, Age, and Anthropometric Parameters on Biochemical Variables
Although insulin levels were higher for girls, it was probably due to the higher number of patients with Tanner stage >2 for this subgroup. Actually, it is known that a physiological state of IR develops during puberty and that females, in average, develop puberty earlier than males. 31
In agreement with previous studies,7,15,17 proinflammatory markers, namely CRP, leptin, TNF-α, resistin, and IL-6, were associated positively with each other and also with increasing age and adiposity, IR, and a worse lipid profile, while negatively associated with adiponectin (Supplementary Table S1). Associations between circulating adipokines result from a cross talk that occurs not only at the peripheral but also at the local level, within the adipose tissue, through different mechanisms, including the modulation of gene expression.12,13
As these adipokines presented a close relationship with markers of adiposity, an improvement in anthropometrics could contribute to reduce present and future CV risk.7,15,17
Overall Analysis of Adipokine Gene Polymorphisms
All the SNPs were in Hardy–Weinberg equilibrium with the exception of ADIPOQ c.-1124C>G and c.214 + 62G>T (p = 0.016). The obese pediatric population studied is not representative of the Portuguese population, making it hard to evaluate this result. Studies involving different populations have found these two SNPs to be in Hardy–Weinberg equilibrium.22,23,32
Adiponectin Polymorphisms
ADIPOQ rs16861194 (c.-1173A>G)
We identified higher circulating levels of adiponectin in AA males regarding this SNP. This was in agreement with other studies that refer an association of the G allele with lower adiponectin levels. 22
ADIPOQ rs17300539 (c.-1138G>A)
GG subjects presented lower adiponectin levels. This was already demonstrated in previous studies performed in children, 32 adolescents, 33 and adults. 34 The lower adiponectin levels could partially explain why male GG subjects also presented higher levels of proinflammatory IL-1β (p < 0.05). This influence must occur at the local level, as adiponectin plasmatic levels were not correlated to IL-1β in our population.
As adiponectin presents important antidiabetic and antidyslipidemic properties, 7 it would be expected that GG should have a worse lipid profile in association with lower adiponectin levels; however, this was not the trend obtained in our population. These opposite associations might be explained by the interplay with other polymorphisms within the adipose tissue or by the influence of environmental factors, among other influences.
ADIPOQ rs266729 (c.-1124C>G)
GG individuals presented a trend to lower levels of adiponectin, in accordance with other studies.35,36 The influence of this SNP on adiponectin levels could help to explain why GG subjects presented higher values of LDLc and TChol in Korean children 37 and an increased carotid intima media thickness in a multiethnic sample. 22 In our study, the GG subjects also presented a worse lipid profile while CC individuals presented lower glucose levels.
According to these results, GG individuals might be at increased risk of vascular disease and could benefit from an early intervention. Nevertheless, some studies did not find differences regarding the lipid profile and glucose homeostasis markers between the different genotypes.35,36
ADIPOQ rs2241766 (c.45T>G)
TT homozygous presented lower levels of adiponectin, although without statistical significance. Lower levels of adiponectin were also associated with the T allele in some studies, but others reported no influence of this polymorphism in adiponectin plasmatic concentrations. 38
In line with the known antidyslipidemic properties of adiponectin, TT individuals from our sample presented a worse lipid profile, namely, a lower HDLc/TChol ratio. Other studies, however, found no association of this polymorphism with plasmatic lipids in children 37 and adults. 35
ADIPOQ rs1501299 (c.214 + 62G>T)
Although only a trend toward higher values of adiponectin was present for TT subjects, values of IL-1β, IL-6, and TNF-α were significantly lower for this group in males. Adiponectin has important anti-inflammatory properties and thus it may justify, at least in part, these associations. It is important to highlight that similar results were found in females, although without statistical significance. Previous studies have reported controversial findings for this polymorphism, either reporting no association of T allele 38 or relating it with lower 39 or higher 36 adiponectin values. A study performed in Caucasian and African American adolescents reported an association of T allele with higher adiponectin. 33
In opposition to a decrease in inflammatory markers, TT individuals tended to present a worse lipid profile in our population. These results are contrary to the ones found in a Korean population, where the T allele was associated with a better lipid profile and reduced IR in adults, 35 although no differences were found in children. 37
ADIPOQ allelic combinations
The study of the allelic combinations of the ADIPOQ's studied SNPs was only associated with IL-1β and IL-6 levels. The fact that these associations were present for other adipokines (rather than adiponectin itself) highlights the cross talk existing between the different adipokines that occurs both peripherally and at the local level within the adipose tissue.
IL-1β Polymorphism
In our population, homozygous TT subjects presented lower leptin levels. Contrarily, another study in Swedish young men found no association between this SNP and leptin levels. 24 Increased leptin secretion from adipose tissue in obesity has been associated with rise in IL-1β secretion from CD4+ cells, presenting this relationship a particular relevance in the development of autoimmune diseases. 5
Although no association with lipid profile was found, CC individuals presented higher levels of glycemia when compared to the other two groups. IL-1β is a proinflammatory mediator with an important role in diabetes type-1 development, namely by inhibiting β-cell function and promoting its apoptosis. The pancreatic islet β-cells increase this cytokine production in response to increased glucose levels, however, by reducing β-cell function, a vicious cycle is formed that will help to keep high circulating glucose levels, contributing to pancreatic glucotoxicity. 40
Besides presenting increased leptin levels, CC homozygous also had higher IL-1β plasmatic concentration, although without statistical significance. This rise in inflammatory status could at least partially explain the higher glycemia present in CC individuals. Moreover, CC individuals might be at increased risk of diabetes in the future. As far as we know, we are the first study reporting the association of this IL-1β SNP and changes in glucose levels.
This polymorphism, namely the variant allele (c.-118C), has been associated with a decrease in the transcriptional activity of IL-1β, 41 which apparently contrasts with our findings. However, it seems that IL-1β SNPs are functional in the haplotype context. A study involving 404 cervical women demonstrated that plasma IL-1β levels were not simply determined by this or another [-511 C > T (rs16944)] IL-1β polymorphism. 42 Our work did not investigate other IL-1β polymorphisms, and therefore, we were unable to evaluate the association of allelic combinations with IL-1β levels.
IL-6 Polymorphism
In our study, the IL-6 c.-237C>G polymorphism was not associated with any of the other studied variables. Actually, inconsistent results are found regarding associations between the IL-6 c.-237C>G polymorphism and phenotypes relevant for type 2 diabetes. However, an analysis of the data from 17 studies revealed lower fasting glucose levels in C allele carriers. 25 In this same study, there was no evidence of an association between IL-6 c.-237C>G and IL-6 levels, except in prediabetic subjects (CC genotype was associated with increased circulating IL-6 levels and reduced risk of type 2 diabetes).
TNF-α Polymorphism
The change of a guanidine (common −308G allele) to an adenosine (rare −308A allele) leads to an increased activation of the TNF-α gene and therefore to a raised transcription. 43 This is likely to be the main explanation for the higher levels found in heterozygous when compared to GG subjects in the studied population (the difference was significant only for males). It is important to emphasize that in our study, AA females presented the highest TNF-α and the lowest adiponectin levels; nevertheless, this group was too small to achieve statistical significance. The mechanism underlying this association could involve TNF-α action, as this adipokine is able to diminish adiponectin secretion in adipocytes. 44 A local influence of TNF (without evident repercussion in the circulating levels) could be present.
In opposition to a previous study that reported this polymorphism as being associated with an increased risk for the development of IR in obese subjects, we did not find any association. 14
Resistin Polymorphisms
RETN rs1862513 (c.-216C>G)
In previous works, genetic variants at the resistin locus were significantly associated with the plasma resistin concentration, and common homozygotes of the SNP c.-216C>G presented the lowest resistin concentration.17,28,38 Although we did not find any association between this SNP and resistin levels, CC females presented the highest level of TNF-α. Actually, there is evidence that resistin is produced in response to inflammatory stimuli, but resistin itself upregulates proinflammatory cytokines, namely TNF-α, 45 suggesting a paracrine influence of resistin (without marked repercussion in the circulating levels).
A worse lipid profile was seen for CC individuals, when compared to heterozygous individuals, with increased levels of TChol and LDLc and a decreased HDLc/TChol ratio. This latter observation is in line with a study involving a Finish population, in which the CC homozygotes had the most deleterious metabolic profile with higher glycated hemoglobin (HbA1c), insulin (among female subjects), and TG. 17 Nevertheless, another report found no association between this SNP and adipokines (namely IL-6, adiponectin, and leptin), lipid profile, and IR. 30
RETN rs3219177 (c.118 + 39C>T)
In our population, heterozygous individuals (CT) presented increased levels of resistin when compared to TT homozygous. Nevertheless, other studies showed either no association 30 or lower levels of resistin associated with the C allele.17,28
Individuals with CC genotype presented with an increase in circulating TNF-α and a worse lipid profile (higher TChol and LDLc, and lower HDLc/TChol) when compared to the other two genotypes. Other studies have failed to find any association between this SNP and metabolic profile17,46 or inflammatory markers. 30
RETN rs3745367 (c.118 + 181G>A)
In opposition to other works reporting lower resistin levels for the more frequent genotype (GG),17,38 we did not find differences in resistin levels between genotypes.
Similarly to the SNP c.-216C>G and c.118 + 39C>T, the c.118 + 181G>A polymorphism was closely related to lipid profile being a worse lipid profile associated with the G allele. Conversely, other studies found no association between this polymorphism and metabolic variables. 17
RETN rs3745368 (c.*62G>A)
Although no association with inflammatory markers was found, the common allele for this polymorphism (G) was associated with a worse lipid profile (likewise, the other RETN SNP). Contrarily, in a Tunisian population, no association was obtained between this polymorphism and plasmatic lipids or IR markers. 46 Similarly, in a Venezuelan cohort, no differences were found in biochemical variables, except for an increase in glycemia in GA subjects versus GG homozygous. 29
RETN allelic combinations
In line to what was seen in the individual resistin polymorphisms, the plasmatic lipids were the biochemical variables that were influenced the most by RETN allelic combinations. Also, in agreement with the observations made for the different RETN SNPs, the group presenting the common alleles for all SNPs presented the worse lipid profile.
Association between RETN more frequent alleles and an increase in inflammation, as defined by an increase in TNF-α, and a worse lipid profile was clear in our population. Individuals presenting the aforementioned alleles may have an increased risk for dyslipidemia, an important risk factor for CV, and would benefit for an early intervention.
In conclusion, our data demonstrated that some adipokine SNPs have already an association with circulating adipokine levels and lipid profile in obese adolescents. These results highlight a genetic contribution to obesity-related comorbidities through adipokine-level modulation.
Limitations of the Study
This work had some limitations. We were unable to detect direct associations between some of the studied SNPs with any biochemical variables, probably due to the relatively low number of subjects, particularly when analyzing genders separately. Environmental factors and the age range of participants, with inherent physiological biochemical alterations, may also have contributed to this. For instance, our group has previously demonstrated that the effect of a common apo E polymorphism on TChol/HDLc ratio is highly influenced by BMIzsc values and adiponectin concentration. 47 This fact is, in turn, of particular relevance because environmental factors, such as physical exercise, may reduce the atherosclerotic risk, namely through reduction of BMIzsc, particularly in individuals with a higher genetic predisposition. It is also important to keep in mind that the evaluation of circulating levels of adipokines, although important, does not give all the necessary information to understand the intercommunication between adipokines. Thus, it is fundamental to further evaluate these variables at the local level, namely in the adipose tissue.
Footnotes
Acknowledgments
The authors thank all the institutions that participated in this work. This work was funded by European Regional Development Fund (FEDER, Europe) funds through the Operational Competitiveness Programme (COMPETE, Portugal) and by National Funds through Fundação para a Ciência e a Tecnologia (FCT, Portugal) under the project FCOMP-01-0124-FEDER-028613 (PTDC/DTP-DES/0393/2012).
Author Disclosure Statement
No competing financial interests exist.
References
Supplementary Material
Please find the following supplemental material available below.
For Open Access articles published under a Creative Commons License, all supplemental material carries the same license as the article it is associated with.
For non-Open Access articles published, all supplemental material carries a non-exclusive license, and permission requests for re-use of supplemental material or any part of supplemental material shall be sent directly to the copyright owner as specified in the copyright notice associated with the article.