
Abstract
Abstract
Background:
Obesity during early stages of life may condition states of oxidative stress. Heme oxygenase-1 (HO-1) is an enzyme involved in oxidative metabolism; it has antioxidant and anti-inflammatory functions and is related in sensitivity to insulin. However, a high concentration of this enzyme has been described to cause alterations such as insulin resistance. The objective of this work was to study the relationship between obesity, oxidative stress, HO-1, and insulin in children aged 3 to 5 years.
Methods:
To achieve our objective, we studied a control group of children (n = 50) and a group of obese children (n = 50) who underwent an anthropometric evaluation. Additionally, we quantified peroxidized lipids, oxidized low-density lipoproteins (Ox-LDLs), oxidized and reduced glutathione, HO-1, and insulin. We also calculated the homeostasis model assessment of insulin resistance (HOMA-IR), HOMA-%B, and HOMA-%S indices. According to the data distribution, nonparametric and Spearman's rank correlation coefficient tests were conducted.
Results:
The results demonstrate that obese children show a statistically relevant increase in BMI/age, serum concentrations of peroxidized lipids, Ox-LDLs, oxidized glutathione, HO-1, and insulin (p < 0.005). In addition, there was an increase in the HOMA-IR and HOMA-%B (p < 0.0001) indices and a decrease of reduced glutathione, as well as a reduction in the HOMA-%S, compared with the children of the control group (p < 0.003).
Conclusions:
With the results obtained, we can conclude that obese preschool children show a chronic state of oxidative stress, an increase of HO-1, and an incipient state of insulin resistance. Finally, the increased reactive oxygen species could be one of the leading factors involved in insulin resistance and Ox-LDL increase from the preschool stage.
Introduction
Pediatric overweight and obesity constitute a challenge to public health due to the fast increase in their prevalence. The growth in the number of cases is caused by an imbalance between food intake and energy use. The imbalance can cause an increase in body weight already reported at ages 3 to 5. In addition, it has been proven that preschool obesity leads to biochemical complications characterized by modifications in serum concentrations of glucose, triglycerides, low-density lipoproteins, and C-reactive protein (CRP). There is also a decrease of high-density lipoproteins.1–4 Such modifications can condition the development of insulin resistance, thus accelerating the emergence of metabolic syndrome in other growth stages of the child.4–6
Ages 3 to 5 are key to the development of obesity since programming and distribution of the adipose tissue that the person will have during his or her life take place at this stage.5–8 This adiposity redistribution can be modified by an imbalance between intake and use of energy, which makes the rate of hypertrophy higher than that of hyperplasia. In consequence, the vascular stroma is unable to irrigate the area causing adiposity hypoxia, an initial phenomenon generating low-grade subclinical inflammation and the excessive release of reactive oxygen species (ROS).9–11
There is sufficient scientific evidence that obesity is related to an imbalance between ROS and the antioxidant systems. A state of chronic oxidative stress is generated as a consequence of adiposity hypoxia.12,13 The state of chronic oxidative stress is associated with the release of fatty acids, activating the inflammation-promoting ligand called natural-killer group 2 member D (NKG2D). NKG2D starts the release of proinflammatory cytokines as interleukin-6 (IL-6), CRP, and tumor necrosis factor alpha. 14 It must also be considered that the adipose tissue is closely related with macrophages and that relationship creates a vicious cycle of inflammation and oxidative damage 15 associated with the formation of diacylglycerol and ceramides. In consequence, by-products such as 4-hydroxy-2-nonenal (HNE) and 4-hydroxy-2-hexenal (HHE), of high oxidative capability, are formed. This is considered to be one of the mechanisms involved in insulin resistance, 16 which is related to the genesis of metabolic syndrome.
However, researchers have described molecular mechanisms of compensation to avoid inflammatory and oxidative damage; among the mechanisms, they report a heat shock protein called HSP32 or heme oxygenase (HO-1). HO-1 shows its anti-inflammatory effect when lowering the production of the granulocyte–macrophage colony-stimulating factor and inhibiting c-Jun N-terminal kinase signaling and the nuclear factor kappa-light-chain-enhancer of activated B cells (NF-κB). Thus, it hampers the production of proinflammatory cytokines such as IL-6 and CRP in adipocytes.15–18 HO-1 also has an antioxidant capability related to the decrease of oxidative catabolism of the heme group in the fat tissue previously described. Such reduction takes place because of the association between cytochrome p-450 reductase, nicotinamide adenine dinucleotide phosphate (NADPH), and oxygen (O2). They catalyze heme degradation and produce equimolar amounts of carbon monoxide (CO), ferrous iron (Fe2+), and biliverdin. The latter becomes bilirubin, thus preventing excessive formation of ROS.19–21
According to the data reported in literature, HO-1 is considered as a predictor of visceral adiposity and insulin resistance. 15 Nevertheless, there are no reports stating the serum concentrations of HO-1 in eutrophic and obese pediatric patients without associated metabolic disease. Additionally, it is highly likely that obese children aged 3 to 5 years develop alterations in insulin signaling derived from lipid modifications. The objective of this work was to study the effect of obesity in children aged 3 to 5 years on the increase of oxidized lipids and the effect that this increase has on serum concentrations of HO-1, insulin, and oxidized low-density lipoproteins (Ox-LDLs).
Methods
For the purpose of our research, we used a prospective cohort study conducted in the Health Secretariat of Mexico City (Secretaria de Salud de la Ciudad de Mexico), at the Maternal Pediatric Hospital Xochimilco (Hospital Materno Pediatrico Xochimilco), and at the Medicine School of the National Autonomous University of Mexico (Facultad de Medicina de la Universidad Nacional Autonoma de Mexico-UNAM). This research was submitted to the Bioethics Committee of the Health Secretariat of Mexico City (408-011-0213) and the Medicine School, UNAM (014-2013), for evaluation and approval.
Participant Selection
The children who participated in the study were selected from the pediatrics outpatient clinic for healthy children control at the Maternal Pediatric Hospital Xochimilco from March to December 2013. The parents and/or tutors were explained the contents of the study; afterward, they signed a letter of consent according to the protocol of the Declaration of Helsinki.
Once the parents and/or tutors accepted the participation of their children in the study, the participants were distributed in two nonmatched groups (n = 50 per group). The eutrophic or control group included children whose weight went from the 50th to the 84th percentile and a z-score index −1 to +1. The obese children group showed a weight in the 95th percentile or above and a z-score index +2 or superior. The children of both groups had to comply with the following criteria to be included: age between 3 and 5, clinically healthy, without anatomical malformation, without family dyslipidemia background, without heart conditions, and 12-hour fasting.
Determining the Nutritional Status
An anthropometric evaluation of height and weight was conducted using a Tanita BF-2000 Kids scale; the bare-footed patients stood with their arms at their sides, wearing only underwear. The value registered was expressed in kilograms. The height was determined using the plumb technique and the results were expressed in centimeters. Afterward, the BMI was calculated to determine the nutritional status based on the formula of weight/height2 expressed in kg/m2. With the data obtained, we made a graph in the percentile tables of BMI for age and gender of the Centers for Disease Control and Prevention (CDC in Spanish), updated in the year 2006 (CDC-OMS 2006). Score Z is considered according to the criteria of the World Health Organization.
Determination and Laboratory Analysis
The blood samples were taken at the Maternal Pediatric Hospital Xochimilco by specialized personnel. The samples of 10 mL of blood were obtained by venipuncture. Then, the plasma was placed in 1.5-mL aliquots and frozen at −70°C for later use.
Peroxidized Lipids
The serum quantification of peroxidized lipids was done using the thiobarbituric acid reactive substance (TBARS) method, following the Buege-Agust protocol. The data obtained were compared with a standard malondialdehyde (MDA) curve and the values were expressed in ng/mL of TBARS in plasma. 22
Oxidized and Reduced Glutathione
The concentrations of glutathione (GSH) were determined by calculating the total glutathione in the plasma of patients according to the method by Boyne and Ellman. 23 We later added 5,5′-dithiobis (2-nitrobenzoic acid) (DTNB) to the GSH. Once the mix was done, we added glutathione reductase, incubated it for 1 hour, and measured absorbency at 412 nm in an EPOCH Bioteck spectrophotometer. The data obtained were compared with a standard curve and the values were expressed in ng/mL of oxidized glutathione (GSSG). We calculated the reduced glutathione by subtracting the total GSH and the GSSG. 24
Oxidized Low-Density Lipoproteins
The determination of Ox-LDLs was done using a sandwich ELISA kit from Cell Biolabs No. STA-388 (USA). We followed the indications of the manufacturer as follows: 300 μL of the precipitate for LDLs was placed in the plasma sample of the patients and centrifuged at 1000 rpm at 4°C; 200 μL of plasma was taken from the samples. The samples were then incubated for 50 minutes at room temperature. Afterward, they were centrifuged for 20 minutes at 2000 g. The supernatant was vacuumed and the pellet was collected and resuspended in phosphate-buffered saline.
Once the procedure was done, the solution was placed in the first eight wells of the plate in standard Ox-LDL duplicate to obtain the standard curve. The duplicate samples of the patients were placed in the rest of the wells; the samples were incubated for 1 hour at room temperature. We washed them five times in 1× wash buffer, added human Apo-B100 biotinylated antibody, and incubated them at room temperature for 1 hour. We washed them five times again, added the enzyme conjugate of streptavidin, and incubated them for 1 hour. We washed them five times, added the substrate solution, and incubated them for 20 minutes. Once the reaction was obtained, we added the stopping solution and obtained a reading at 450 nm with an EPOCH Bioteck spectrophotometer. With the data obtained from the first wells of the plate, the standard curve was graphically represented. The data of the obtained concentrations were compared with the standard curve to determine the concentrations of Ox-LDLs in each sample (μg/mL).
Heme Oxygenase-1
To determine the serum concentrations of the human protein HO-1, a sandwich Enzyme-Linked Immunosorbent Assay (ELISA) was done using a commercial kit, Enzo No. ADI-EKS-800 (USA). The method was developed according to the instructions of the manufacturer. Using the data obtained from the samples, we determined the concentrations of HO-1 (ng/dL).
Insulin
In relation with the quantification of serum concentrations of insulin, we did a sandwich ELISA using a commercial kit, ABCAM No. Ab100578 (UK). The method was developed according to the indications of the manufacturer.
Homeostatic Model for Evaluation of Insulin Resistance
To determine insulin resistance, we calculated the index of the homeostasis model assessment of insulin resistance (HOMA-IR), which uses the serum concentrations of glucose and fasting insulin expressed in mg/dL. We multiplied the numbers and divided the resulting number by the constant 405.
The HOMA-%B index, which determines the function of the β pancreatic cells, was calculated using an algorithmic model developed by the Oxford Centre for Diabetes, Endocrinology and Metabolism (OCDEM). The HOMA-%S, which estimates insulin sensitivity, was calculated using the calculator provided by the OCDEM.
Statistical Analysis
According to the data distribution, we conducted homogeneity of variance Kolmogorov–Smirnov tests and ran nonparametric statistical tests using the Mann–Whitney U test. In addition, we used a Spearman quotient correlation test to determine the association between HO-1, insulin, and Ox-LDLs. We later used a linear regression using the GraphPad Prism VI® program.
Results
The results of this work demonstrated that obese children showed an increase in BMI/age, serum concentrations of peroxidized lipids, oxidized glutathione, Ox-LDLs, HO-1, insulin, and HOMA-IR and HOMA%B indices. They showed a decrease in reduced glutathione and in HOMA%S index when compared with children of the control group (Table 1).
Age Distribution, Percentile Corresponding to BMI/Age Tables, and Studied Biochemical Markers
Control group <85, obese children group >95th percentile.
HO-1, heme oxygenase-1; HOMA-IR, homeostasis model assessment of insulin resistance; Ox-LDLs, oxidized low-density lipoproteins.
The obese children (

Effect of obesity in children aged 3 to 5 years on BMI and oxidative stress markers. (A) BMI/age; (B) peroxidized lipid concentration; (C) Ox-LDL concentration; (D) oxidized glutathione concentration; (E) reduced glutathione concentration; (F) heme oxygenase-1 concentration. Note the increase in BMI/age, peroxidized lipids, Ox-LDLs, oxidized glutathione, and HO-1. There also is a decrease in reduced glutathione in obese children. Data are presented as medians, *p < 0.05 versus Control. HO-1, heme oxygenase-1; Ox-LDLs, oxidized low-density lipoproteins.
The results obtained also demonstrate that insulin concentrations in obese children (
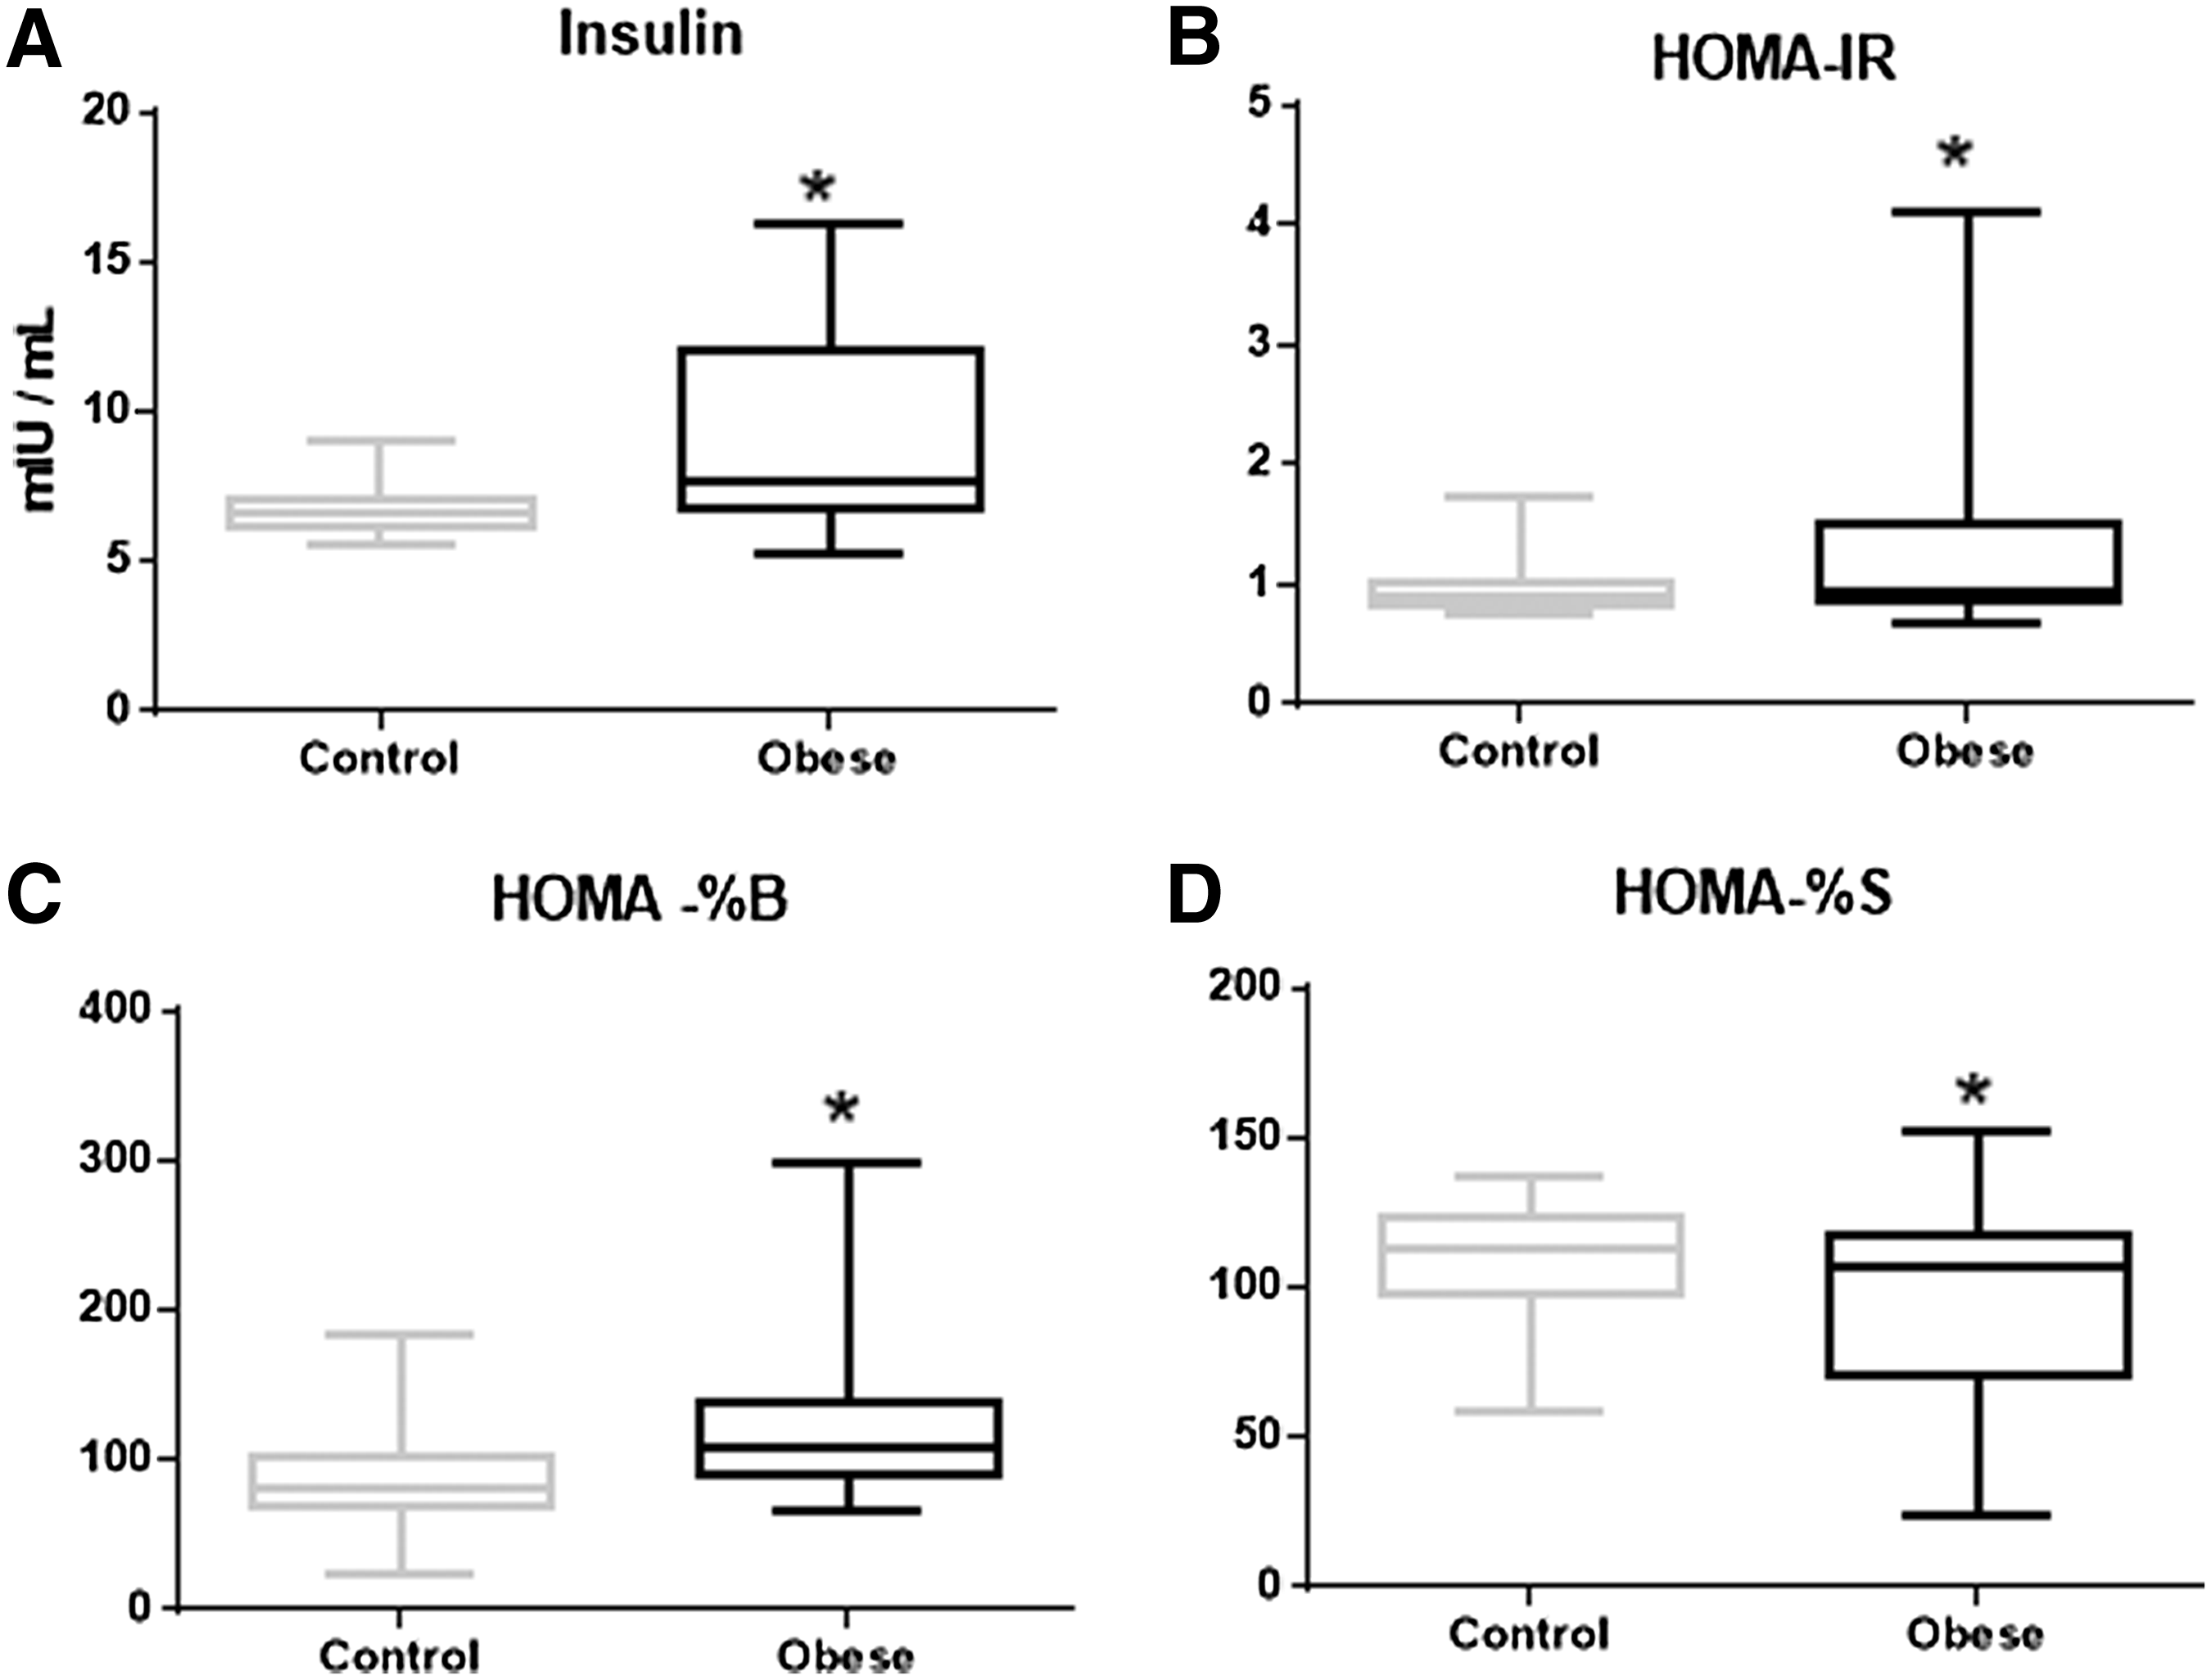
Effect of obesity in children aged 3 to 5 years on insulin alterations and HOMA indices. (A) Insulin concentration; (B) HOMA-IR index; (C) HOMA-%B index; (D) HOMA-%S index. Note the increase of insulin and HOMA-IR and HOMA-%B indices. There is also a decrease in the HOMA-%S index in obese children. Data are presented as medians, *p < 0.05 versus Control. HOMA-IR, homeostasis model assessment of insulin resistance.
Later, we calculated the Spearman quotient correlation with the results of peroxidized lipids, HO-1, insulin, and the HOMA-IR, HOMA%B, and HOMA%S indices, respectively. The correlation between peroxidized lipids and the HO-1 was linear with an r = 0.96 (p < 0.001). Then, we calculated the correlation between peroxidized lipids and insulin and found that it was linear r = 0.83 (p < 0.001) and so was the correlation between peroxidized lipids and the HOMA-IR index with an r = 0.86 (p < 0.001). When comparing peroxidized lipids with the HOMA-%B index, there was a linear correlation of r = 0.97 (p < 0.001). The calculation of the correlation between peroxidized lipids and HOMA-%S showed an r = 0.67 (p < 0.001). Finally, the correlation between OX-LDLs and insulin showed an r = 0.94 (p < 0.001) (Fig. 3).
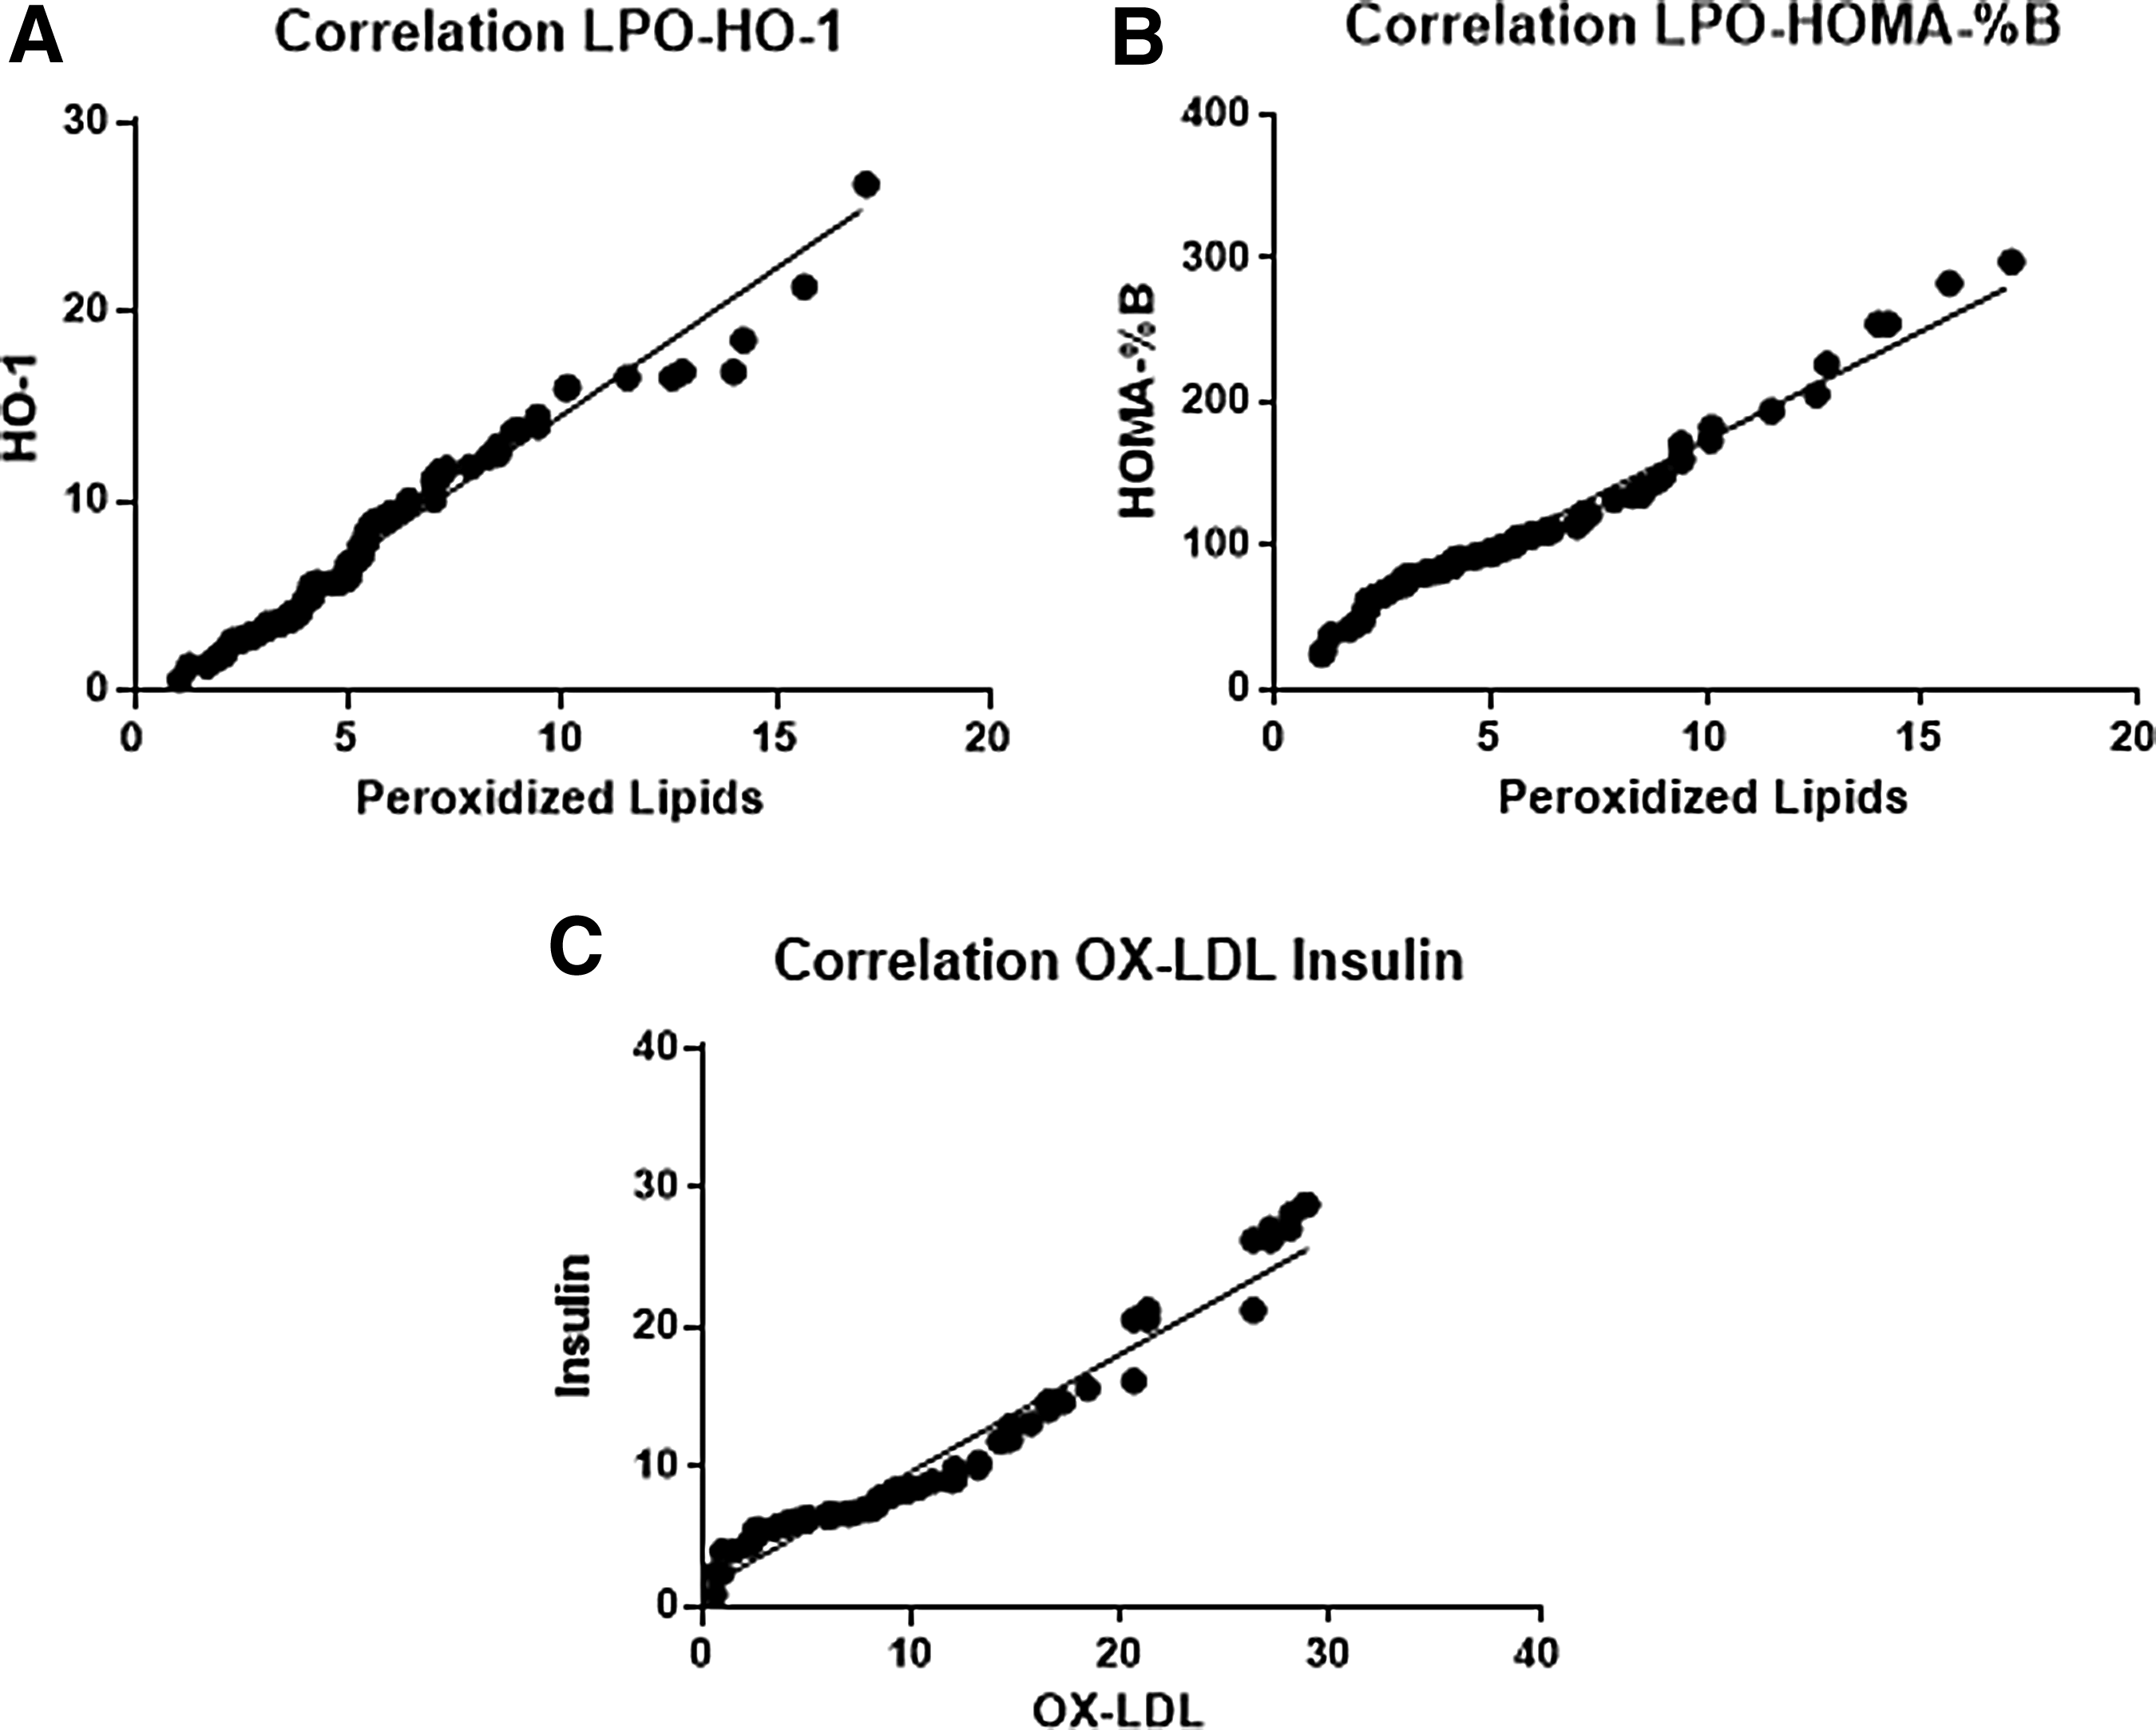
Correlation of oxidative stress markers in obese children. (A) Correlation between peroxidized lipids and HO-1 (r = 0.96); (B) peroxidized lipids vs. HOMA-%B (r = 0.97) and Ox-LDL vs. insulin concentration (r = 0.94); and (C) Ox-LDL vs. insulin concentration (r = 0.94).
Discussion
The results of the study show that the BMI of obese children corresponded to the 96th percentile according to the CDC-WHO chart, similarly to the results reported by Bocca et al. in 2013 for Dutch children. Therefore, it is demonstrated that regardless of ethnicity, the ages from 3 to 5 represent the initial stage for the development of complications associated with obesity1,4,6 since the programming of the size of the fat cells the person will have for life takes place during this stage. The programming can be disturbed in case the weight of the preschool child increases more than 2 kg per year, which will cause the fat cells to have a greater tendency toward hypertrophy and hyperplasia. The increase and change in morphology of the adipocyte will make it more difficult for obese preschool children to maintain a stable weight during later stages of life.1,7,8
On the other hand, it is widely accepted that obesity during adulthood is accompanied by oxidative stress characterized by an increase in concentrations of peroxidized lipids and oxidized glutathione and a decrease in reduced glutathione. 25 This effect has been observed in obese children between ages 3 and 5, which might suggest that the disturbances in redox homeostasis are already observed at the preschool stage. This can condition alterations at other stages in life.
The change in redox homeostasis can be produced by ischemia, which is present when there is an increase of the size of adipocytes, producing a reduction of the blood supply in the tissue. Therefore, there is hypoxia leading to an increase in the concentrations of ROS. In turn, the increase of ROS promotes the nuclear translocation of Nrf2, activating the phosphoinositide 3-kinase (PI3K) pathway and increasing the gene expression of HO-1. 26 In consequence, there is an increase in the synthesis of this enzyme, present in different relevant functions on the insulin signaling cascade. 17 An additional function of HO-1 described in the literature is its anti-inflammatory capability, which is closely related to polarization of adipose tissue-resident M1–M2 macrophages. Based on these functions, in 2014, Jais et al. proposed HO-1 as a biomarker for metabolically healthy or unhealthy obesity.17,27–29
On the other hand, serum insulin reported in this study shows an increase in obese children, a datum similar to the one reported in 2014 by Lo et al. among North American children, 2 thus demonstrating that obese children show metabolic alterations from ages 3 to 5. We can relate this information with another study conducted by our laboratory with this same population. In this study, we reported an increase in the serum glucose in obese children. 1 In addition, the results concerning the indices, HOMA-IR and HOMA-%B, proved an increase in obese children. For its part, the HOMA-%S index showed a decrease in this same group. These data can be interpreted as an incipient emerging state of insulin resistance since the secretion of this hormone has poor signaling in target organs. These data are widely accepted to make a diagnosis of insulin resistance among adults, although it is yet to be validated for pediatric diagnosis.30,31
It is important to consider that insulin resistance is the factor that triggers the development of metabolic syndrome2,4 at any stage of life. For this reason, it is important to conduct more studies to determine whether obesity triggers insulin resistance 31 since the preschool stage.
Additionally, in the results of the correlations of peroxidized lipids and HO-1, the latter showed a positive linear correlation. Thus, we can interpret that the greater the amount of peroxidized lipids, the more the secretion of HO-1. This fact may be explained by stating that HO-1 is countering the increase of both ROS and proinflammatory cytokines from adipose cell hypertrophy.27,28 However, we have not found reports demonstrating that this enzyme does not only increase its concentrations but also maintains its enzymatic activity in obese patients. Therefore, more studies are needed to clarify this matter.
There is a positive linear correlation between peroxidized lipids and the HOMA-%B index. This could be interpreted as a disturbance of the regulation of insulin response in pancreatic β cells. The dysfunction can be caused by peroxidized lipids, which produce the by-products, HNE and HHE, of a greater oxidant capability that produces dysfunction in pancreatic β cells. 16 Furthermore, it is widely accepted that free radicals induce an increase in the phosphorylation of NF-κB in the β cell, stimulating nuclear transcription and proinflammatory cytokine activation and producing a malfunction of the cell.12,13
When analyzing peroxidized lipids and Ox-LDLs, we found a positive linear correlation. Such relationship might be due to the fact that LDLs are oxidized faster since hydrogen peroxide interacts with aldehydes and lysine residue in apolipoprotein B-100, promoting easier oxidation and greater oxidative capability32,33 of LDLs.
The correlation between Ox-LDLs and insulin proved to be positive and linear. This may be due to the fact that oxidative stress is responsible for the modification of Ox-LDLs. The increase of Ox-LDLs induces disturbances in pancreatic β cells, causing an increase in the β cell response to glucose concentrations in blood. 34
Conclusions
Based on the results obtained in this study, we can conclude that oxidative stress is an important factor during the development of metabolic alterations in obesity at preschool age.
The effect of oxidative stress in obese children is related to both Ox-LDLs and insulin resistance. These alterations induce the modification of lipid and dietary carbohydrate metabolism, which can lead to the establishment of a chronic degenerative process at earlier stages of life.
Footnotes
Acknowledgments
Enrique Carmona-Montesinos appreciates the support given by the Programa de Doctorado en Ciencias Biomédicas, Facultad de Medicina, Universidad Nacional Autónoma de México (UNAM), and by CONACYT for the doctoral fellowship (548.639). This work was supported by the Direccion General de Apoyo al Personal Academico (Grant No. IN221114 to Selva Rivas-Arancibia).
Author Disclosure Statement
No competing financial interests exist.