
Abstract
Abstract
Background:
Use of nonnutritive sweeteners (NNSs), which provide sweet taste with few to no calories, has increased, but data on whether children's hedonic responses to NNSs differ from nutritive sugars or from adults' hedonic responses are limited.
Methods:
Most preferred levels of sucrose and the NNS sucralose were determined via a forced-choice tracking procedure in 48 children, 7–14 years (mean = 10 years), and 34 adults. Each participant also rated the liking of these taste stimuli, as well as varying concentrations of aspartame on 3- and 5-point facial hedonic scales. Anthropometric measures were obtained, and motives for palatable food intake were assessed with the Palatable Eating Motives Scale (PEMS, adults) and Kids PEMS.
Results:
While use of the 3-point scale showed no age-related differences in liking of sweeteners, the 5-point scale showed that more children than adults liked higher concentrations of sucrose, sucralose, and aspartame, and the tracking procedure showed that children most preferred higher concentrations of sucrose and sucralose than adults. Regardless of age, sweet preference did not differ between obese and nonobese participants and showed no association with motives for eating palatable foods. Children's body mass index z-scores were positively associated with social and conformity motive scores for eating palatable foods.
Conclusion:
Research should move beyond measures of variation in sweet taste hedonics to include identifying motives, and the physiological and psychological consequences of eating sweets, to shed light on what children are more vulnerable to develop unfavorable eating habits, increasing risk for obesity, and other diseases.
Introduction
Health organizations worldwide recommend that added sugars (sugars added to foods during processing or preparation) contribute no more than 5% 1 to 10% 2 of total daily calories for people of all ages. Added sugars intake has declined in recent years 3 but remains well above recommended levels, contributing to more than 10% of total calories among children in the United States (16%) 4 and other nations (e.g., Canada, 12% 5 ; Australia, 12% 6 ; and the Netherlands,17% 7 ). This high consumption of added sugars is cause for concern: the more added sugar in the diet, the poorer the dietary quality 8 and, in turn, the greater the risk for obesity, cardiovascular disease, diabetes, and other diseases.9–11
To mitigate the negative health outcomes associated with intake of added sugars, nonnutritive sweeteners (NNSs) are increasing in use as a replacement for some or all of the added sugars in many foods and beverages. 12 NNSs can be found in carbonated beverages and grain-based desserts 13 —top sources of added sugars in US children's diets14,15—as well as in cereals, 16 frozen ready-to-eat meals, 17 beverage mixes, 18 and liquid medicines. 19 Parents are often unaware that NNSs are in the foods and beverages they feed their children, in part, because of their difficulty in identifying NNSs on food labels. 20 While effective for preventing dental caries, 21 efficacy of NNSs in preventing obesity is contentious.22–25
Despite their prevalence in the food supply, 26 research on whether children like the taste of NNSs is limited. Four studies conducted to date presented NNSs to children in complex liquids that contained other flavor ingredients and/or sweeteners (fruit-flavored beverages,27,28 chocolate milk, 29 and oral rehydration solutions 30 ). These beverages and solutions were rated on visual analog 30 or facial hedonic scales,27–29 in which a series of faces displaying emotions ranging from unhappy to happy guided children's ratings. Although children generally gave NNS-containing products high liking ratings, these studies did not focus on the taste of individual NNSs and whether liking differed from nutritive sugars. Nor did researchers assess whether children's hedonic response to the taste of NNSs differed from that of adults, who prefer lower concentrations of sucrose. 31
Given the importance of taste in children's food preference, 32 a basic understanding of children's hedonic responses to NNSs is warranted. Our goals were threefold. First, we examined age-related differences in liking for varying concentrations of sucrose and sucralose—one of the six NNSs approved for use by the FDA 33 and one that is frequently used both as an additive to processed foods and beverages, and as a tabletop sweetener. 34
Second, we used three different psychophysical methods to measure liking of the taste of sucrose and sucralose. Specifically, we compared the outcomes from the 3-point facial hedonic scale, the 5-point facial hedonic scale, and the forced-choice tracking procedure, 35 positing that the 3-point scale, which has only one face to depict liking, would not be as effective in revealing age-related effects on sweet taste liking as either of the other two methods. Aspartame was also tasted and rated using the same methods to determine if liking for sucrose generalized to another NNS. Potassium chloride (KCl), which has been described as bitter and metallic in taste, 36 was also included to determine whether children understood the methods and used the scales appropriately.
Third, we related individual differences in taste preferences for sucrose and sucralose to both body weight and motives for eating palatable foods. Although obese and normal weight individuals are often assumed to differ in their sweet taste preferences, 37 this claim has received little evidentiary support. On the contrary, research has shown that the level of sweetness of sucrose, most preferred by obese children, did not differ from those who were nonobese; what did differ was the efficacy of sucrose in blunting expressions of pain. 38 Thus, we hypothesized that motives underlying intake of palatable foods, as determined by the Palatable Eating Motives Scale (PEMS) 39 in adults and the Kids Palatable Eating Motives Scale (KPEMS) 40 in children, would differ based on body weight status but taste preferences for both nutritive and NNSs would not.
Participants and Methods
Overview
Testing involved three separate study visits to ensure that children were not overburdened and did not get fatigued. During the first two study visits, taste stimuli were rated using facial hedonic scales, anthropometric measures were obtained, and demographic data were collected by maternal interview. During the third visit, most preferred level of sweet taste was determined via the forced-choice tracking procedure and PEMS/KPEMS questionnaires were completed.
Participants
Mothers (n = 34) of children (n = 48) were recruited to participate from local advertisements in the Philadelphia area and from a list of past participants who asked to be contacted for future studies. Procedures were approved by the Office of Regulatory Affairs at the University of Pennsylvania. Written informed consent was obtained from each mother and assent was obtained from each child who was 7 years of age or older. The trial was registered at clinicaltrials.gov as NCT01667549.
Taste Stimuli
The taste stimuli used for each of the tasks are listed in Table 1. The two concentrations of sucrose evaluated on the hedonic face scales correspond to adults' most preferred level (300 mM) and the upper limit of children's most preferred level (1050 mM; Table 1). 41 The two concentrations of sucralose and aspartame, both of which are sweeter than sucrose on a weight basis, 42 were selected to roughly approximate the sweetness intensity of those two sucrose solutions. Two concentrations of KCl (one of which was used in previous taste research 43 ) were included because of different hedonic valence (e.g., disliked taste) than the sweeteners; this enabled us to validate that children were using the face scales correctly.
Concentrations of Taste Stimuli Evaluated (mM)
For the forced-choice tracking procedure, which had been previously validated for use to determine the most preferred level of sucrose, 35 the range of sucralose concentrations (0.13–1.50 mM) used roughly approximated the sweetness intensity of this established range of sucrose concentrations (90–1050 mM). All stimuli were prepared in solution with deionized water every 2 weeks, refrigerated at 4°C in amber glass bottles, and equilibrated to room temperature 2 hours before testing.
Psychophysical Methods
Procedures were identical for children and adults, each of whom was tested individually in a private, comfortable room designed for sensory testing. Participants did not consume any food or drink other than water for at least 1 hour before testing.
Facial hedonic scales
Before testing, all participants were familiarized with the 3- and 5-point facial hedonic scales, comprising faces displaying emotions ranging from a “super bad” frowning face to a “super good” happy face (Fig. 1), using Compusense 5 software (version 4.6; Compusense, Inc., Guelph, Canada). For the 3-point scale, participants were instructed to select the “super bad” face if they disliked the taste of the solution, the neutral face if they neither liked nor disliked its taste, and the “super good” face if they liked its taste. Participants were told that the 5-point scale was the same as the 3-point scale but that it provided more options to indicate liking and disliking. To assess whether children understood how to use the scales, we asked them what face they would point to if they were eating their favorite and least favorite foods. All participants understood the task.

The 3-point (a) and 5-point (b) hedonic face scales (Compusense, Inc., Guelph, Canada).
During testing, participants were presented with 5 mL of each taste stimulus in 30-mL plastic medicine cups in randomized and counter-balanced order. They were instructed to swish the solution in their mouth for 5 seconds, expectorate, and rate their liking for its taste by selecting a face on the scale. A 1-minute interval separated each tasting, during which participants rinsed their mouth twice with water. All solutions were first rated on the 3-point scale followed by the 5-point scale.
Forced-choice tracking procedure
Participants' most preferred level of sucrose and sucralose was determined separately. In brief, participants were presented with two solutions (5 mL each) from the middle range of samples (180 and 700 mM for sucrose; 0.26 and 1.17 mM for sucralose) and tasted each solution for 5 seconds without swallowing, after which they pointed to the one they liked better (see Mennella and Bobowski 44 for detailed protocol). Each subsequent pair of solutions presented contained the concentration selected by the participant in the preceding pair and an adjacent stimulus concentration. This pattern continued until the subject either chose the same concentration when paired with both a higher and a lower concentration in two consecutive pairs or chose the highest or the lowest concentration twice consecutively. Participants rinsed their mouth with water once between each solution and twice between each pair of solutions, during which a 1-minute wait period was enforced. The task was repeated after a 3 minutes break, with stimulus pairs presented in reverse order (for series 1, the lower concentration and, for series 2, the higher concentration were always presented first). The geometric mean of the concentrations selected during the two series provided the estimate of most preferred level of sucrose or sucralose.
Anthropometry, Demographics, and Questionnaires
Participants were weighed (kg; model 439 physical scale; Detecto Scale Company) and measured for height (cm) wearing light clothing and no shoes from which children's age- and sex-specific BMI z-scores were calculated using EpiInfo 3.5, and participants were classified as obese or nonobese. Adults and children completed the PEMS and KPEMS, respectively, by answering the questionnaires on a computer; these scales assess underlying motives for intake of highly palatable foods and include normative externally driven motives (e.g., to socialize, or to fit in/conform with others) and less normative and potentially harmful internally driven motives (e.g., to cope with a negative situation, or for a food's rewarding properties).39,40,45,46 Children were offered the assistance of a researcher to complete the KPEMS, who read questions aloud, and three children accepted. Mean scores for each of the PEMS/KPEMS subscales (social, conformity, coping, and reward enhancement) were determined.
Statistical Analysis
For the hedonic face scale data, we determined the percentage of children and adults who selected each face on the 3- and 5-point scale separately for each stimulus tasted. Chi-square analyses were used to determine if hedonic responses to any of the stimuli differed between age groups on each scale. Yates's chi square was used if fewer than 5 participants selected a particular face on either scale for each analysis. When any significant difference was found, follow-up partition analyses were used to further examine the effects and determine where the difference occurred. 47
For the forced-choice tracking procedure data, participants who were inconsistent in response (i.e., preferred concentration between series 1 and series 2 differed by more than two steps in concentration for either sucrose or sucralose) were excluded from analyses. Separate one-way analyses of variance were used to compare the geometric means of preferred concentrations of sucrose and sucralose between age groups and between obese and nonobese participants within each age group. Because of the number of siblings in the sample (25 children), statistical analysis on age-related differences was repeated but included only one sibling per dyad or triad chosen at random. Correlational analyses were conducted to examine associations between most preferred levels of sucrose and sucralose, BMI, and PEMS/KPEMS scores.
Results
Participant Characteristics and Task Completion
The study population consisted of 48 children (including 8 sibling dyads and 3 sibling triads) between the ages of 7 and 14 years (mean age = 10 ± 0.3 years) and 34 women (mean age = 39 ± 1.7 years), whose race and ethnicity (63% black, 12% white, and 25% other or mixed), family income (23% <$15,000, 24% $15,000–35,000, 35% $35,000–75,000, 9% >$75,000, and 9% did not complete), and education levels (77% adults graduated high school) reflected the diversity of the metropolitan area of Philadelphia. 48 Sixty-one percent of women and 25% of children were obese.
Four children did not complete the 3-point scale testing, and five children and one adult did not complete the 5-point scale testing, in which all cases were stopped by the researcher when the participant appeared unfocused or distracted. Of the 38 children and 27 adults who returned for the third day of testing, 4 children and 1 adult were excluded because of inconsistent responses in the forced-choice tracking procedure.
Psychophysical Testing
Facial hedonic scales
For ratings made on the 3-point facial hedonic scale, adults' and children's hedonic responses to any of the taste stimuli, regardless of concentration, did not differ (all p > 0.19; Fig. 2a). Most children and adults selected the “super good” face after tasting sucrose (300 mM, 55%; 1050 mM, 73%), sucralose (0.40 mM, 58%; 2.0 mM, 69%), and aspartame (3.0 mM, 56%; 10.0 mM, 79%) and the “super bad” face after tasting KCl (100 mM, 79%; 200 mM, 88%).

Adults' (A) and children's (C) taste responses to varying concentrations of sucrose, sucralose, aspartame, and KCl on the 3-point (a) and 5-point (b) hedonic face scales (Compusense, Inc.). *Significant difference in hedonic response between age groups (p < 0.05).
However, when the participants used the 5-point scale, age- and concentration-related differences emerged (Fig. 2b). Hedonic responses between adults and children did not differ when tasting the lower concentrations of each of the sweeteners (all p > 0.76), but for higher concentrations more children than adults liked the taste of the highest concentration of sucrose (1050 mM: Yates's χ2(4df) = 10.3, p = 0.03), sucralose (2.0 mM: Yates's χ2(4df) = 14.9, p = 0.005), and aspartame (10.0 mM: Yates's χ2(4df) = 9.4, p = 0.05). Partition analyses revealed that for each of these stimuli the significant differences were specifically due to more children than adults selecting the “super good” face to indicate hedonic response (1050 mM sucrose: Yates's χ2(4df) = 10.1, p = 0.001; 2.0 mM sucralose: Yates's χ2(4df) = 12.8, p = 0.0004; 10.0 mM aspartame: Yates's χ2(4df) = 7.4, p = 0.006). When only one sibling per family was included in analyses, age-related differences were no longer significant for sucrose (p = 0.08) or aspartame (p = 0.15); however, this is likely due to a combination of the small number of subjects and the psychophysical method. There was no difference between children and adults in their hedonic ratings for KCl, which was generally disliked, when using the 5-point scale for either concentration (all p's > 0.41).
Forced-choice tracking procedure
Compared with adults, children most preferred significantly higher concentrations of both sucrose (children: 765 mM, adults: 576 mM; F(1, 63df) = 6.7, p = 0.01) and sucralose (children: 1.08 mM, adults: 0.86 mM; F(1, 58df) = 4.0, p = 0.05; Fig. 3). The results remained unchanged when we focused on only one child per family (sucrose: F(1, 52df) = 6.63, p = 0.012; sucralose: F(1, 47df) = 4.10, p = 0.048). The higher the most preferred level of sucrose, the higher the most preferred level of sucralose (r(58df) = 0.79, p < 0.001).
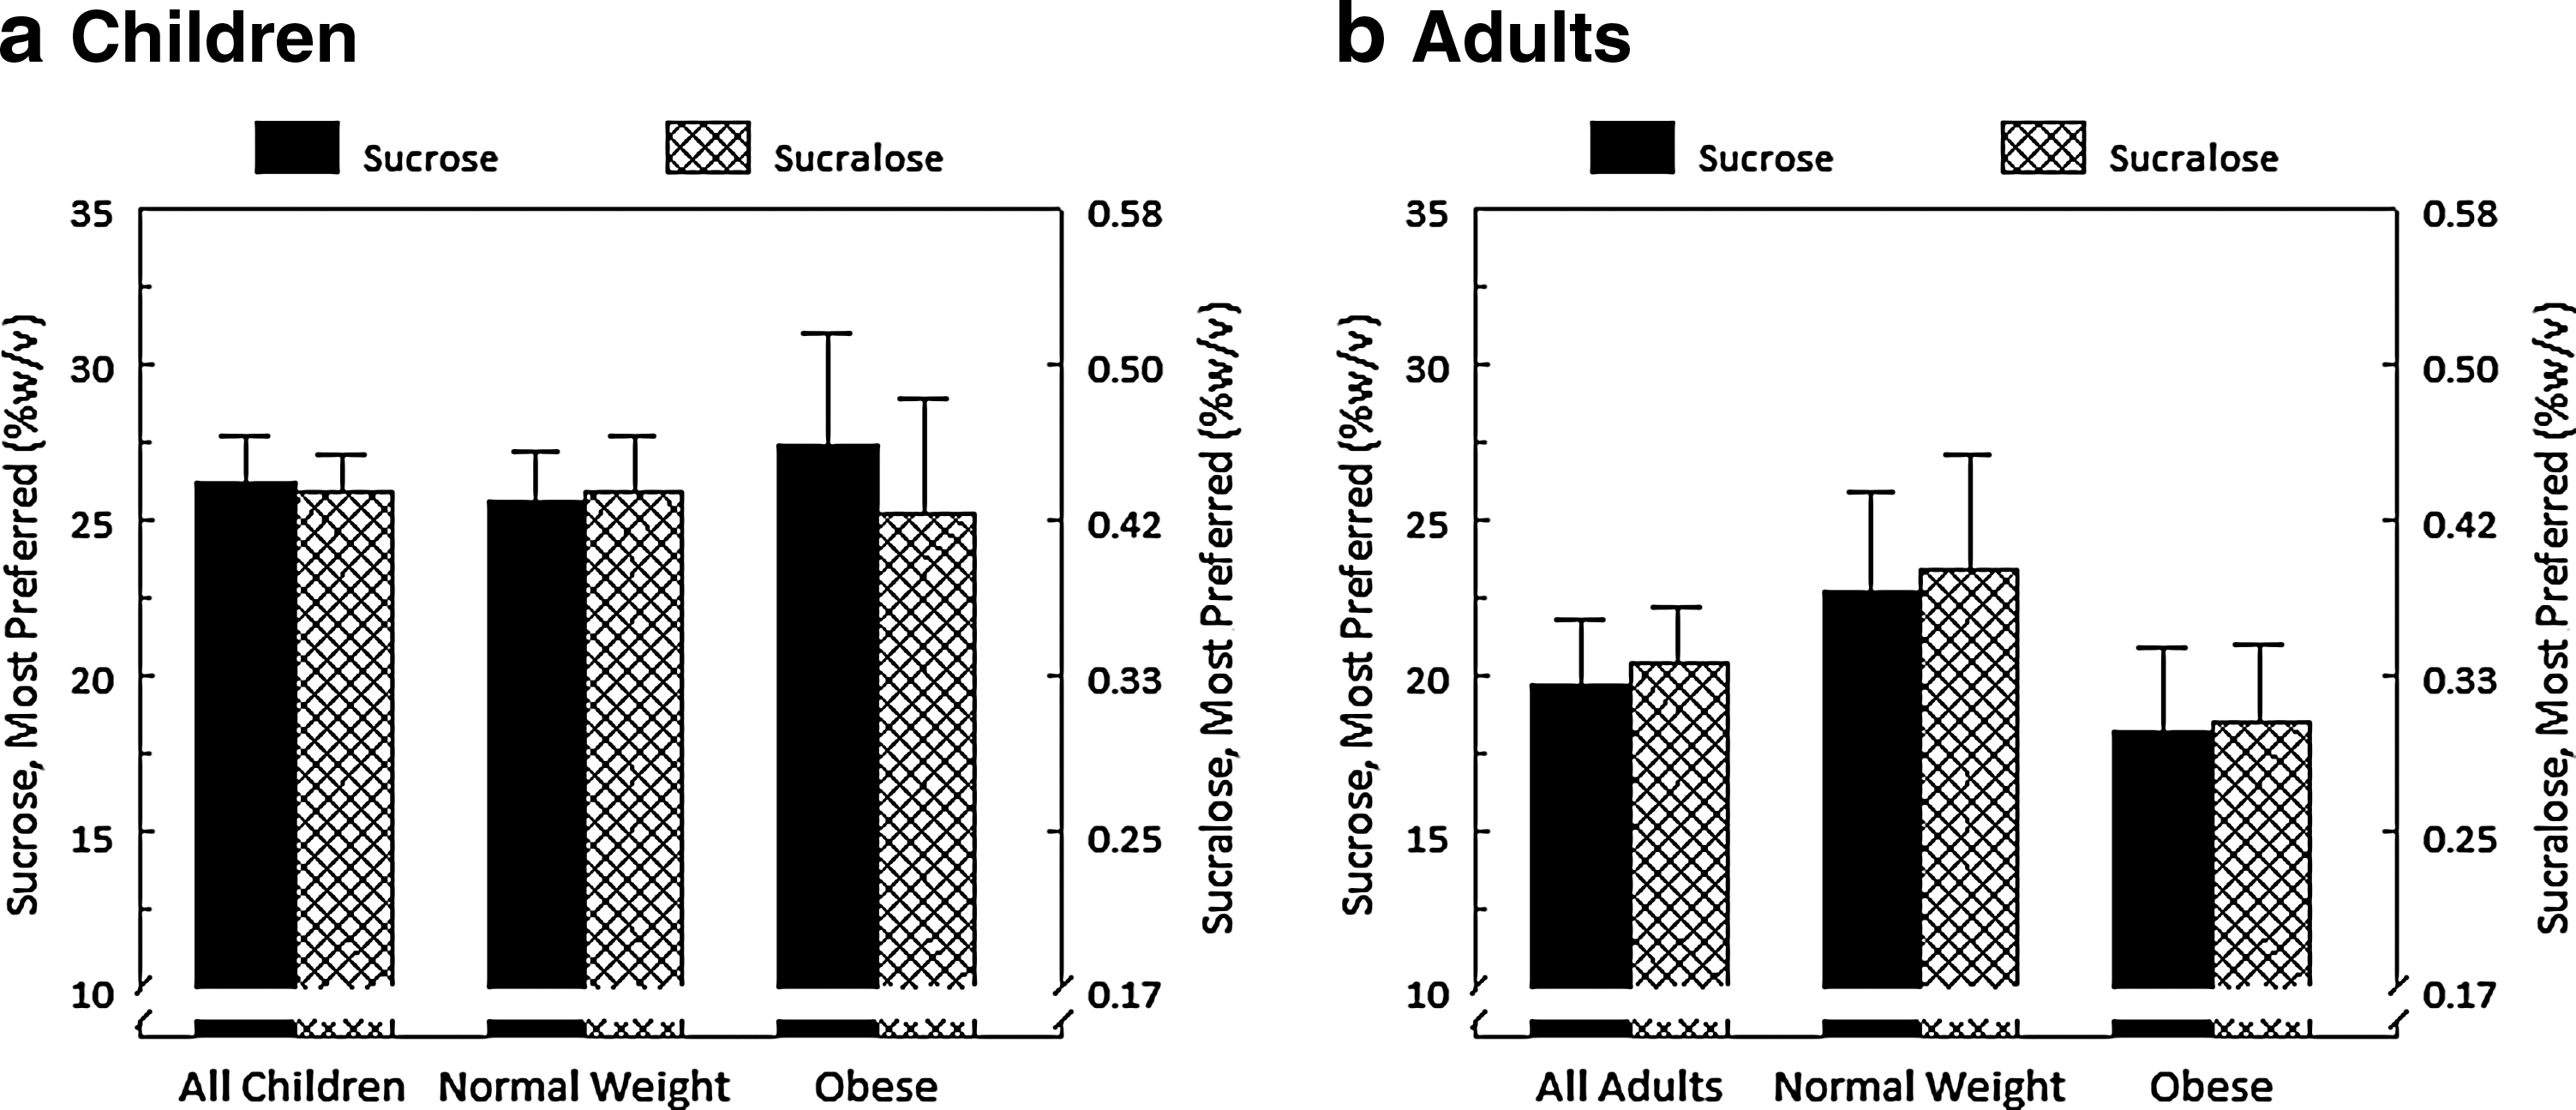
Most preferred levels of sucrose and sucralose among all and among obese vs. nonobese children (a) and adults (b). Data are means ± standard error.
There were no significant relationships between BMI and most preferred level of sucrose or sucralose, regardless of age (adults: sucrose, r(24df) = −0.20, p = 0.34; sucralose, r(23df) = −0.17, p = 0.40; children: sucrose, r(35df) = −0.06, p = 0.71; sucralose, r(31df) = −0.11, p = 0.53). In addition, there was no difference in most preferred level of sucrose or sucralose between obese and nonobese children (Fig. 3a, sucrose: obese, 800 mM; nonobese, 747 mM; F(1, 36df) = 0.29, p = 0.59; sucralose: obese, 1.05 mM; nonobese, 1.09 mM; F(1, 32df) = 0.06, p = 0.81) or adults (Fig. 3b, sucrose: obese, 533 mM; nonobese, 662 mM; F(1, 25df) = 0.98, p = 0.33; sucralose: obese, 0.79 mM; nonobese, 0.99 mM; F(1, 24df) = 1.3, p = 0.27).
PEMS/KPEMS scores were not associated with most preferred levels of sucrose (all p's > 0.38) or sucralose (all p's > 0.35). However, social (r(33df) = 0.34, p = 0.05) and conformity (r(33df) = 0.48, p = 0.04) subscale scores, both of which represent externally driven motives for palatable food intake, were positively associated with BMI z-scores in children only.
Discussion
The liking that children have for higher concentrations of sucrose than do adults generalized to the sweet taste of the NNSs sucralose and aspartame. However, not all psychophysical methods were sensitive enough to reveal such age-related differences in taste hedonics. Regardless of age, there was no association between obesity and the level of sweetness most preferred. Rather, among children, BMI was positively associated with externally driven motives for eating palatable foods, including sweets.
Although the vast majority of both children and adults understood and completed the tasks, age-related differences in sweet taste preferences were revealed only during the forced-choice tracking method, which allows for direct comparisons between pairs of stimuli, or when participants could select from varying degrees of liking (good or “super good”) on the 5-point scale. Both methods demonstrated children's liking for intense sweetness, with more children than adults selecting the “super good” face on the 5-point scale (adults were more likely to select the good face). As expected, such age-related differences were not observed on the 3-point scale, which unlike the forced-choice tracking method and 5-point scale does not allow for evaluating differences in degrees of liking.
When testing children, one should incorporate internal controls to validate their responses. In the present study, we validated these findings in two ways. First, we compared responses from different methods to determine convergence. We found that children's heightened hedonic responses to higher concentrations of sucrose and sucralose on the 5-point scale agreed with findings from the forced-choice tracking procedure, a method previously shown to be both reliable and valid. 41 Second, we included a taste stimulus of different hedonic valence. We found that children's ratings did not differ from those of adults for KCl, suggesting that children could use the 5-point scale to indicate both positive and negative hedonic taste responses. Despite the importance of taste in children's development of food preferences, psychophysical methods to measure children's taste hedonics are still in its infancy, with few methods systematically tested for validity. 49 The method used should depend on the hypothesis tested. As evidenced by the present findings, the 3 psychophysical methods varied in effectiveness for determining age-related differences in taste hedonics.
The present study adds to the body of evidence that children most prefer a significantly higher concentrations of sucrose than do adults.35,50 This heightened preference during childhood for sweet taste, which signals energy, may have served children well by attracting them to energy-rich foods during periods of maximal growth.31,51,52 Experimental research has shown that this heightened preference is also evident in “real-life” food preference: children consume a greater percentage of calories from added sugars than do adults 53 ; their preference for sucrose in solution as measured in the laboratory relates to sugar content of their favorite breakfast cereals and level of sucrose most preferred in puddings 54 and gelatins 31 ; and when presented with sweetened and unsweetened versions of the same food (e.g., Kool-Aid, 55 spaghetti, 56 and vegetables spritzed with sweetened water 57 ), children ingest more of the sweetened food.
That children's heightened liking for the sweet taste of sucrose extends to the NNSs sucralose and aspartame suggests that, as with sugar-sweetened products, children may be especially vulnerable to overconsumption of sucralose- and aspartame-sweetened foods and beverages. 58 Given the paucity of research on the long-term consequences of NNS intake by pediatric populations, additional research is required to understand what impact early and consistent NNS exposure might have on sweet taste preference and proclivity for sweet-tasting foods,23,59 particularly given that in the current food environment, NNSs are often used to add sweetness to foods that might otherwise be unsweetened, teaching the child that sweet taste is appropriate within a particular food context. 58
The frequently held assumption that obese individuals prefer sweets more than nonobese individuals was not supported by our findings, consistent with prior research. 37 Although added sugars are widely recognized as contributing to excess energy intake and are associated with rates of obesity, 60 our data support the idea that differences in intake of added sugars between obese and nonobese individuals are not likely a result of differences in sweet taste preference per se but, rather, may relate to motives for food intake.
In agreement with previous findings, we found a significant association between children's BMI z-scores and externally driven motives for palatable food intake as measured with the KPEMS 40 : the higher a child's BMI, the more likely the child was to consume palatable foods, including sweets (sweet foods comprise 10 of the 18 examples of palatable foods included in KPEMS instructions), to enjoy a party or improve a celebration (social motives), or to not feel left out and to be liked by others (conformity motives). We found no association between adults' BMI and PEMS scores, perhaps because a higher percentage (61%) of the relatively small sample (n = 34) of adults in the present study were obese than in prior studies that reported a relationship.45,46
Conclusions
Findings from this study add to our understanding of age-related differences in sweet taste preference by showing that, as is true for nutritive sugars, children prefer higher concentrations of the sweet taste of both sucralose and aspartame—two of the most commonly used NNSs in the food supply—than do adults. Our findings support previous research revealing no difference in liking for sweet taste between obese and nonobese individuals, highlighting instead a relationship between motives underlying intake of palatable foods and body weight among children. Continued focus on individual variation should include identifying the motives for, and the physiological and psychological consequences of eating sweets,38,61,62which will in turn shed light on what children are more vulnerable to develop unfavorable food habits, increasing their risk for obesity, and other diseases.
Footnotes
Acknowledgments
The project was supported by National Institutes of Health grant R01DC01128 and National Research Service Award F32 DC15172 from the National Institute of Deafness and Other Communication Disorders. The content is solely the responsibility of the authors and does not necessarily represent the official views of the National Institutes of Health. The funding agencies had no role in the design and conduct of the study; in the collection, analysis, or interpretation of the data; or in the preparation, review, or approval of the article. We thank Loma Inamdar, Phoebe Mathew, and Regina O'Brien for expert technical assistance.
Author Disclosure Statement
No competing financial interests exist.