




Abstract
Abstract
Background:
Variations in gut microbiota composition and diversity have been associated with childhood adiposity, although most studies describing this have been cross-sectional in nature. Our objective was to evaluate associations between body weight and the gut microbiota over time in obese preschool-age children.
Methods:
Obese, preschool-age, Hispanic children provided stool samples at baseline and following a 6-month behavioral intervention. Normal-weight (NW) children also provided stool samples. Stool microbial community composition was characterized using 16S rRNA gene sequencing. Estimates of within-sample diversity were calculated on operational taxonomic unit (OTU) count data, and the Firmicutes:Bacteroidetes (F:B) ratio was determined on per-sample basis. Estimates of between-sample diversity were generated using the weighted Unifrac metric, differential abundances were evaluated using Wilcoxon rank-sum tests, and associations of microbiome features with clinical data were quantified using Spearman rank correlations.
Results:
For the 30 obese children sampled preintervention and postintervention, a decrease in body mass index (BMI) z-score from 2.55 to 2.34 (p = 0.004, paired t-test) was observed. Bacteroides massiliensis was significantly enriched in obese children, while B. plebius was significantly enriched in NW controls. We identified significant correlations between multiple Bacteroides-like OTUs and BMI z-score, but neither F:B ratios nor OTU-level abundances were altered in conjunction with weight change in the obese children. Rather, highly individualized OTU-level responses were observed.
Conclusions:
Although differences exist between the gut microbiota of obese and NW children, we detected highly individualized responses of the gut microbiota of obese children over time and following weight loss.
Introduction
Childhood obesity is a global health problem. In the past two decades, the number of children suffering from obesity has increased significantly, and the age at which children become overweight and obese has decreased. Hispanic and African American populations are the most affected in the United States. 1 The understanding of obesity as the result of an imbalance between the energy requirements and the energy consumption is incomplete, and the effect of gut microbes is a major potential confounding factor in this relationship.2,3
The gut microbiota contributes to nutrient acquisition and the extraction of energy from the foods we ingest, and can influence overall energy balance. Although this relationship provides benefits to the human host, it also represents a potential mechanism through which a dysbiotic gut microbiota may influence adiposity, weight gain, and the development of obesity.3–5 Altered microbiota composition has been associated with metabolic syndrome and increased adiposity in both human studies6–8 and animal models. 5 Transferring such altered gut microbial communities (e.g., from human or animal sources) into lean animals can confer an obese phenotype, 9 and anecdotal evidence, including a published case study, 10 suggests that this can occur in humans as well.
The gut microbiome has been implicated in the pathogenesis of childhood obesity starting at birth with reported associations between Caesarean section and childhood adiposity.11,12 Variations in gut microbiome composition and relative diversity have been found to be associated with weight status in early childhood.3,13 Further evidence for a role of the microbiome in weight status comes from observed associations between early antibiotic exposure and increased adiposity.14,15 Early feeding practices, such as breastfeeding and introduction of solid foods, are also recognized as factors which shape the microbiome and have been described as having potential influence on an individual's long-term vulnerability toward obesity.3,16,17 Most previous studies of the pediatric gut microbiome and obesity have been cross-sectional and few clinical studies have examined how the microbiome changes in association with weight and diet change in children. One study in adolescents participating in a multidisciplinary obesity treatment program showed a significant reduction in the proportion of gram-positive bacteria (e.g., Clostridium histolyticum and Eubacterium rectale- C. coccoides), associated with weight loss, and a significant increase in gram-negative bacteria (e.g., Bacterioides and Prevotella) in participants with >4 kg of weight loss. 4
Few human trials have been conducted regarding possible microbiome-based interventions in obese children (e.g., prebiotics and probiotics), but data from adult studies suggest the potential for successful modulation of the gut microbiome in the context of weight loss. A randomized double-blind crossover trial with probiotics showed satiety effects in healthy women. 2 A randomized controlled trial (RCT) using fermented milk-containing probiotics administered to otherwise healthy, overweight adults demonstrated significant decreases in visceral and subcutaneous fat, body weight, and body mass index (BMI). 18 Similarly, an RCT using probiotics in obese children with nonalcoholic fatty liver disease showed reductions in adiposity and some markers of liver function. 19 However, another RCT using a different probiotic in adolescents with metabolic syndrome found no effect on adiposity or proxy inflammatory markers. 20
In this study, we characterized the stool microbial communities of preschool-age, obese children enrolled in a behavioral clinical trial aimed at improving weight status and sought to evaluate associations between changes in body weight and children's gut microbiota. We hypothesized that that significant improvement in adiposity as measured by BMI z-score would be associated with an increase in the relative abundance of bacteria belonging to the phylum Bacteroidetes.
Methods
Subjects
A randomized clinical trial was conducted with preschool (2–5-year old) obese children (OB) enrolled in Head Start programs in south Texas, comparing a parent mentor intervention designed using positive deviance methods with a behavioral intervention implemented by a community health worker as previously described. 21 Children enrolled in the study were all obese (>95th percentile BMI for age and sex) and of Hispanic ethnicity. Demographic information is reported here only for those providing a stool sample, not the entire cohort. Normal-weight (NW) peers of the same age (2–5 years) and ethnicity were recruited from the same Head Start programs and enrolled as controls. NW children were eligible for enrollment if they were Hispanic and had a weight status of <85th percentile for age and sex.
Ethics
The University of Texas Health Science Center at San Antonio Institutional Review Board approved the study protocol. All parents participating in the study provided written consent for themselves and their child to participate. Data and all samples were assigned a unique identifier after collection, with the linking file kept securely in the primary investigator's office.
Clinical Data Analysis
Weight and height collected with duplicate measurements on standardized equipment were used to calculate BMI. BMI z-scores were calculated using Centers for Disease Control and Prevention standards. Dietary data were collected using the Block screener22,23 at baseline and follow-up. Descriptive statistics were used to compare the OB and NW children, using either t-tests or Fisher's exact tests. Paired t-tests were used to analyze the clinical data for the OB children who provided stool samples at both baseline and follow-up.
Sample Collection
Parents of enrolled children were asked to collect a stool sample from their child at the baseline time point and at the end of the 6-month intervention. Parents of NW children enrolled at the same educational centers were also recruited to collect a baseline stool sample from their child. A collection kit, which included a basin for the toilet to eliminate cross-contamination and a sterile vial with a built-in spoon, was provided to all parents. Parents were instructed to place collected specimens in the refrigerator until they brought the sample to the research unit, done within 24 hours of collection.
Sample Processing and Sequencing
Stool community DNA was isolated using the QIAamp Fast DNA Stool Mini Kit (Qiagen), following the manufacturer's protocol. Genomic DNA yields were quantified using a Nanodrop spectrophotometer (Thermo Scientific).
Microbial communities were profiled using V1–V3 24 amplicons of the 16S rRNA gene, Illumina's 16S Metagenomic Sequencing Library Preparation protocol, 25 and the MiSeq600 cycle V3 kit with Nextera XT dual-index barcodes. Libraries were normalized and pooled before sequencing in paired-end mode on the MiSeq platform (Illumina, Inc., San Diego, CA).
Sequence Analysis
Given declining quality scores associated with the reverse reads, the analysis presented in this study is based on forward reads only. The forward reads from demultiplexed libraries were quality filtered such that reads with average quality scores >20, containing no more than 1ambiguous base call, and having a minimum length >170 bp after quality trimming were retained. Reads were clustered into operational taxonomic units (OTUs) using the Lotus pipeline. 26 Specifically, the pipeline utilized a 97% similarity threshold and the UPARSE algorithm to cluster sequences into OTUs. The UTAX classifier (www.drive5.com) and Ribosomal Database Project reference database 27 were used to assign taxonomic identities to representative sequences with an 80% confidence threshold. Species-level identities were obtained, where possible, using SPINGO. 28
Estimates of within-sample diversity (i.e., alpha diversity), including the Shannon diversity and Simpson evenness metrics, were calculated on OTU count data using QIIME 29 (version 1.9.1). OTU tables were iteratively sampled (n = 10 repetitions) across sequencing depths ranging from 1000 to 23,000 reads, and rarefaction curves were produced. Alpha diversity metrics, including the number of observed OTUs, Shannon diversity index, and Simpson diversity index, were calculated at a depth of 9000 reads per sample. The Firmicutes:Bacteroidetes (F:B) ratio was determined on a per-sample basis using nonrarefied data. Differences in alpha diversity metrics and the F:B ratio were compared using two-tailed t-tests or Wilcoxon rank-sum tests, as appropriate. Estimates of between-sample diversity were generated using the relative abundance-transformed values and the Bray-Curtis dissimilarity in QIIME. Group-based differences with respect to beta diversity were assessed using Adonis analysis, and Random Forest analysis was used to determine the degree to which group membership (e.g., weight status) or eventual weight loss could be predicted on the basis of bacterial community composition. The randomForest package 30 (v 4.6–7) for R (v 3.3.1) was used with relative abundance-transformed OTU data under default settings, and baseline error rates were calculated as previously described. 31
Differential abundances of taxa, ranging from the phylum to OTU levels, were assessed between NW and OB children or between collections among the OB children using Wilcoxon rank-sum tests or paired t-tests, as appropriate. Analysis of covariance (ANCOVA) was also used to evaluate differential abundances of taxa between weight-loss groups, controlling for baseline microbiota composition. Before assessing these differences, read count data were center-log transformed using the ALDEx2 package 32 and taxa occurring in fewer than 10% of the samples were removed. p-values were adjusted to account for multiple testing using the Benjamini-Hochberg procedure.
Bacterial community composition was also correlated with clinical variables, including BMI z-scores. Spearman correlations of center log-transformed OTU counts (generated as described above) with clinical variables were performed using the rcorr package in R, and Benjamini-Hochberg corrections were applied using the multtest package. 33
Results
Recruitment and Demographics
Sixty OB children enrolled in the clinical trial. Forty-two provided stool samples at baseline, and 30 children provided both preintervention and postintervention (6 month) samples. An additional 22 NW children from the same preschool centers were recruited as controls, and each provided a baseline stool sample.
Most of the families participating in the behavioral clinical trial reported low household incomes with 63% (19/30) reporting less than $25,000 USD per year. Spanish was the preferred language of 40% (12/30) of the participants. The mean parental BMI for these children was obese at 33.2 (standard deviation [SD] = 9.6), and mean family size was 5.1 (SD = 1.9).
As expected, the mean BMI z-score was much higher among OB children (2.6, SD = 0.7) than the NW children (0.1, SD = 0.6) (p < 0.001, t-test). The mean age of children on enrollment was 54 months (SD = 7 months) in the OB group and 57 months (SD = 6 months) in the NW group (p = 0.11, t-test), resulting in a tighter age range than was initially targeted for enrollment. At the extremes of age, the youngest child participating in the study was 41 months and the oldest was 69 months. Both groups were composed of 55% males (p = 0.99, Fisher's exact test). No significant differences in antibiotic use were detected, with 3 of 22 (14%) of NW and 9 of 30 (30%) of OB children reporting antibiotic use in the prior 6 months (p = 0.20, Fisher's exact test).
Obese Children over Time
For the 30 children in the OB group for whom baseline and 6-month follow-up stool samples were collected, an overall decrease in BMI z-score from 2.55 (SD = 0.59) to 2.34 (SD = 0.55) was observed (p = 0.004, paired sample t-test). Twenty-one children had decreased BMI z-scores (median decrease of 0.32), and nine children had increased BMI z-scores (median increase of 0.17).
Changes in diet were also observed, and they were not dependent on BMI z-score outcome. Independent of change in BMI z-score, children's reported sugar consumption declined from a median of 54 g/day to a postintervention median of 46 g/day (p = 0.01, Kruskal-Wallis test), as did consumption of sugar-sweetened beverages from a median of 0.3 cans per day at baseline to a median of 0.1 postintervention (p = 0.002, Kruskal-Wallis test). An increase in whole grain consumption was also observed (p = 0.05, Kruskal-Wallis test) (see Supplementary Table S1 for all reported dietary changes; Supplementary Data are available online at www.liebertpub.com/chi).
Microbiome
An average of 217 OTUs (SD = 48) was observed in the stool communities of OB children at baseline and this did not differ significantly from NW children (average 199 OTUs, SD = 53, p = 0.20, Mann-Whitney U-test) or from OTU counts observed for those OB children who submitted a sample at the 6-month follow-up visit (average 224 OTUs, SD = 51, p = 0.80, paired t-test). Similar trends were observed for the Shannon (Shannon: NW average 4.65, SD = 0.94; OB baseline average 4.78, SD = 0.79; OB 6-month average 4.80, SD = 0.84) and Simpson diversity metrics (Simpson: NW average 0.88, SD = 0.11; OB baseline average 0.89, SD = 0.08; OB 6 month average 0.89, SD = 0.08). Neither OTU counts nor either diversity metric differed among subjects as a function of recent (i.e., within the last 6 months) antibiotic exposure (see Supplementary Fig. S1 for PCA plot by antibiotic exposure).
The F:B ratio ranged from 0.08 to 3.11 among all subjects, but did not differ significantly between NW with a median ratio of 0.50 (interquartile range [IQR]: 0.28–0.86) and OB subjects at baseline with a median ratio of 0.62 (IQR: 0.39–0.96), p = 0.22, Mann-Whitney U test, between NW and OB subjects after the 6-month intervention who had a ratio of 0.69 (IQR: 0.28–0.96), p = 0.38, Mann-Whitney U test, or between OB subjects following the intervention (p = 0.13, paired t-test). Likewise, the F:B ratio did not differ as a function of recent antibiotic exposure.
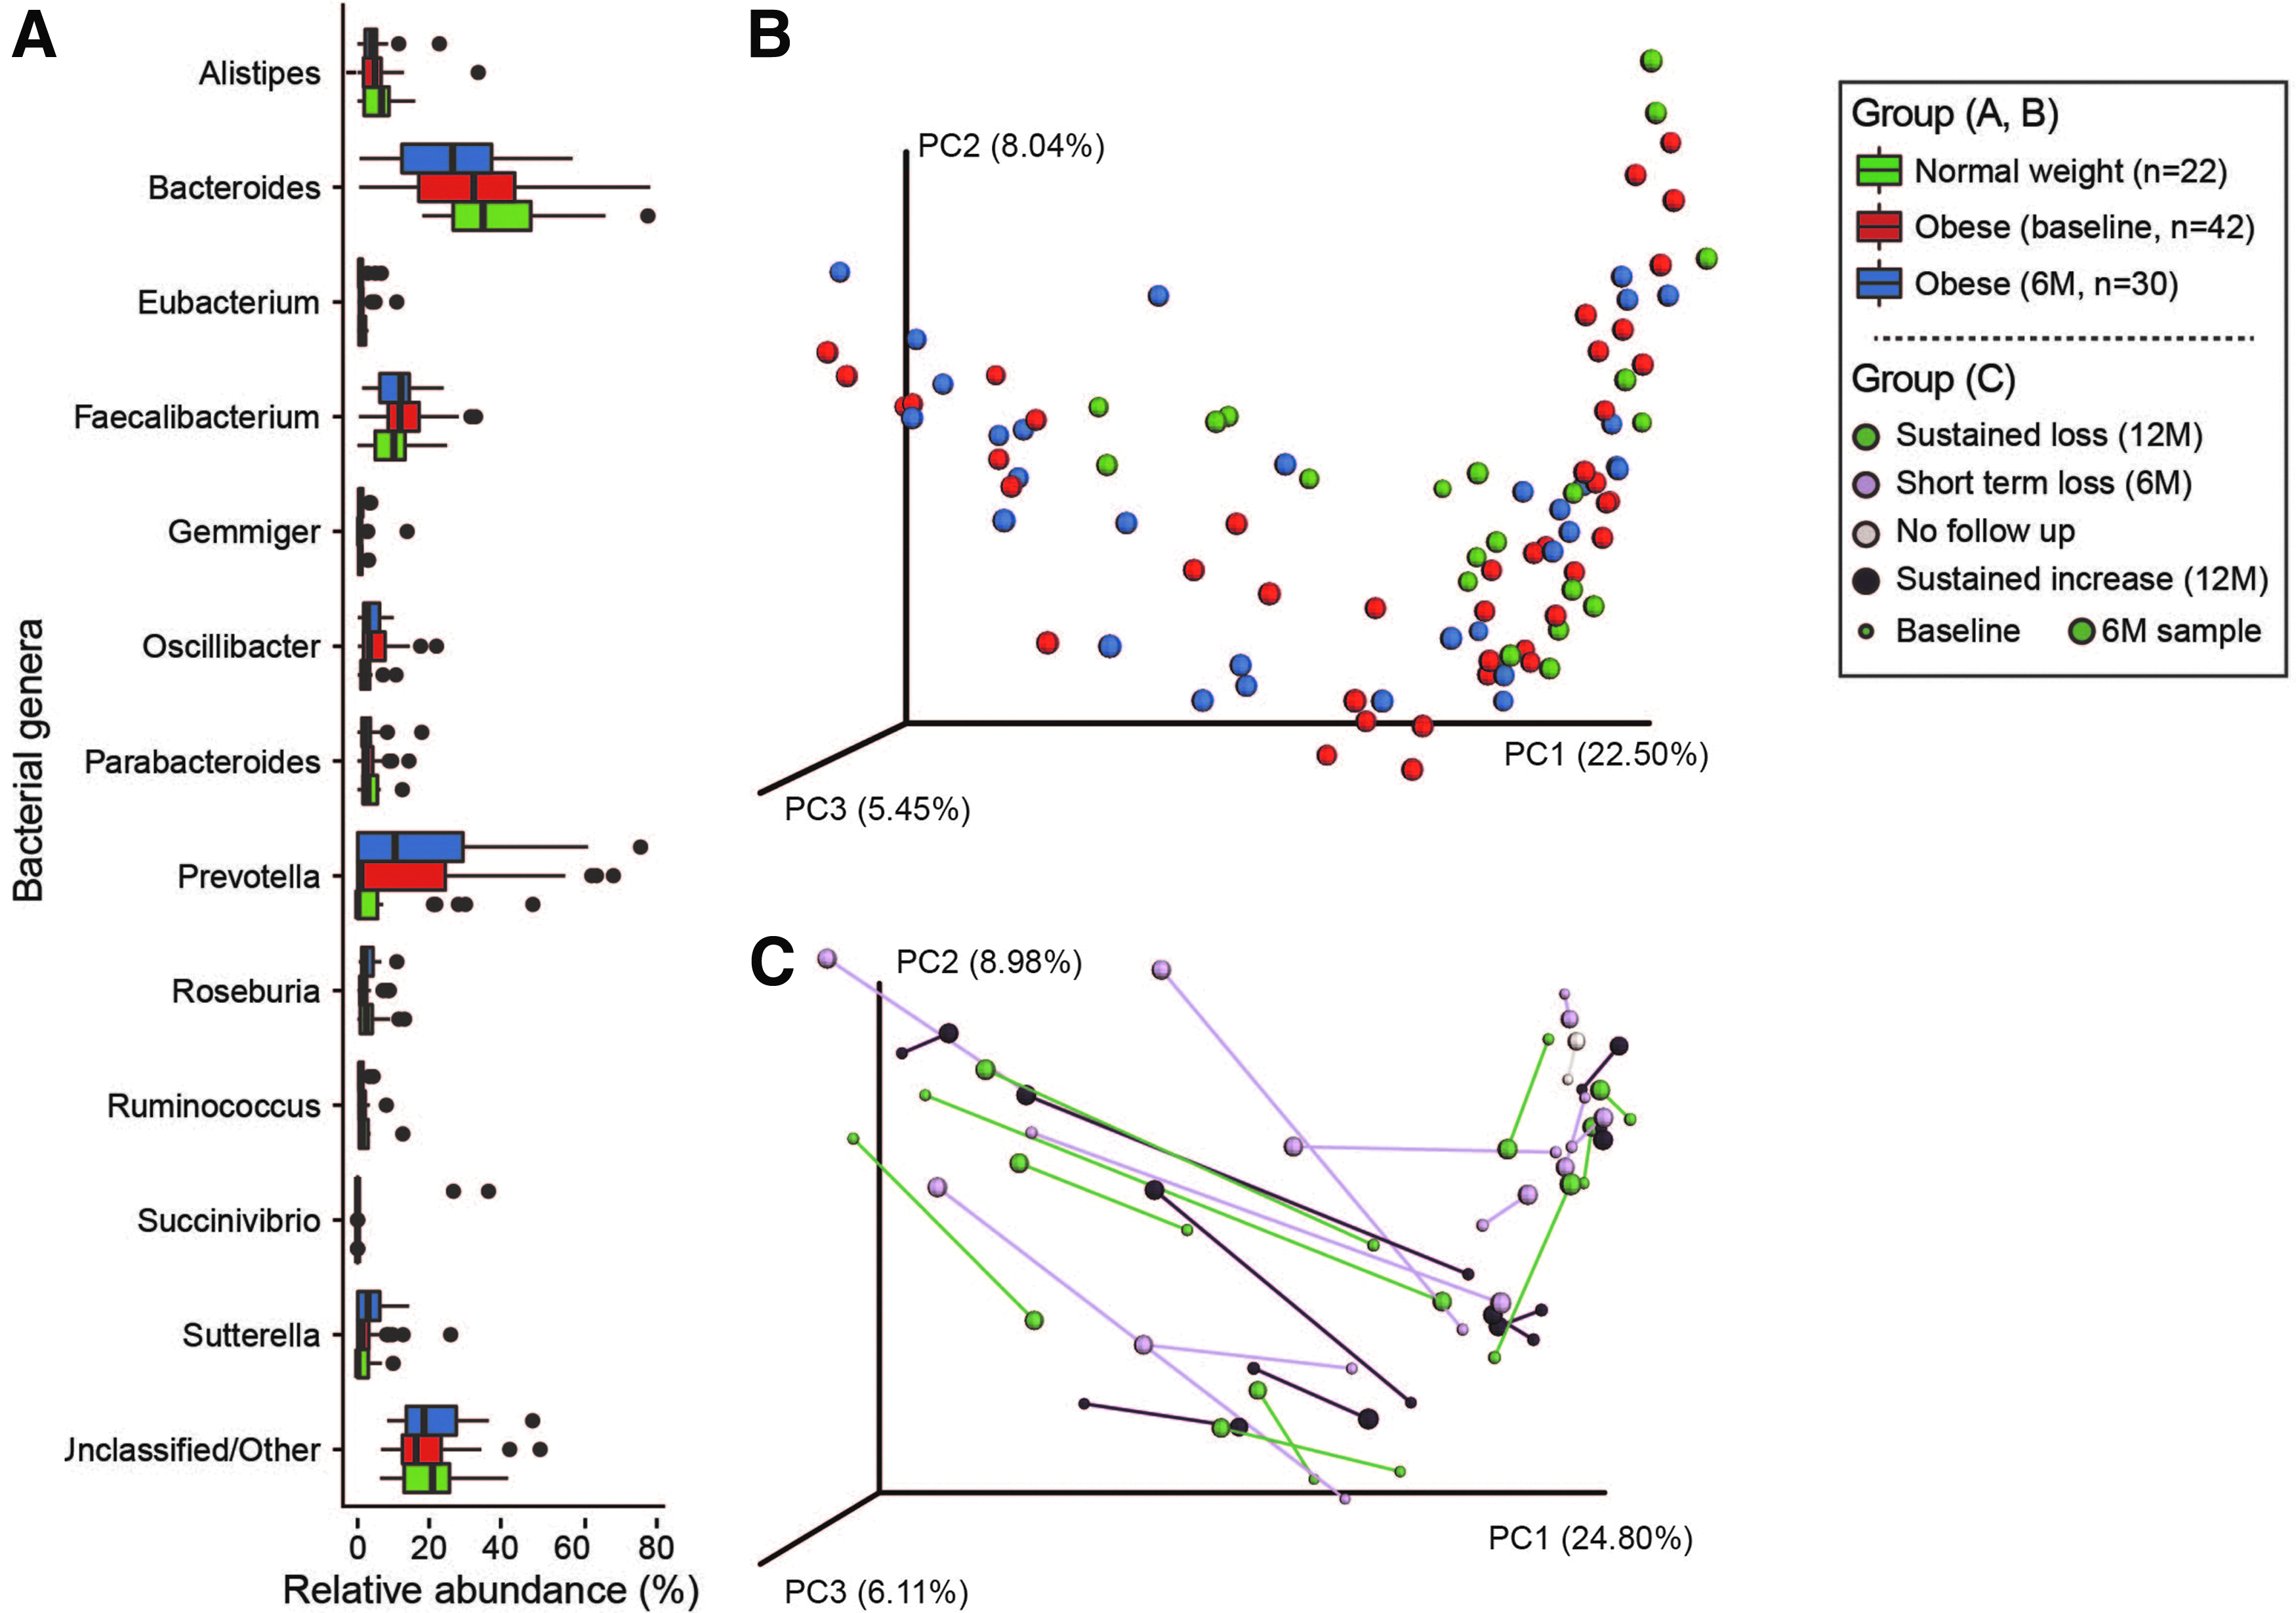
The stool microbial communities of NW and OB children contained a variety of bacterial genera. Bacteroides, Prevotella, and Faecalibacterium were encountered most frequently (Fig. 1A–box plot), but from a global perspective, the stool communities of NW and OB children did not differ significantly from one another (Fig. 1B–PCOA, Adonis analysis p > 0.05). Similarly, recent antibiotic exposure did not result in global differences among subjects (Supplementary Fig. S1).
Differential Abundance
Despite sharing a high degree of similarity at the community level (Fig. 1B), statistically significant differences were detected between NW and OB children (at baseline) with respect to the abundances of four OTUs (Table 1). Three were enriched among the NW children (OTU_59, OTU_515, and OTU_86), and these most closely resembled Bacteroides plebeius, an unclassified member of the Proteobacteria, and an additional unclassified bacterium. The fourth OTU (OTU_13) represented a significantly greater proportion of the sequence reads obtained from the baseline stool communities of OB children and most closely resembled Bacteroides massiliensis. With the exception of the enrichment of unclassified Proteobacteria in NW subjects at the class level, no other statistically significant differences were observed with respect to the abundances of other bacterial taxa between NW and OB at baseline.
Operational Taxonomic Units Differing in Abundance in the Stool Communities of Normal Weight and Obese Children at Baseline (T0) and following the 6-Month (6 M) Intervention
Differences were evaluated using center log-transformed median abundances and tested using Wilcoxon rank-sum tests with Benjamini-Hochberg multiple testing corrections.
NS, not significantly different; NW, normal weight; OB, obese; OTU, operational taxonomic unit.
Utilizing OTU count data, Random Forest analysis was unable to identify bacterial community features (at baseline), which correctly predicted weight-loss success, but it did successfully identify a subset of bacterial community features, which correctly classified the majority of samples according to their weight status (i.e., NW vs. OB) at baseline. With an overall error rate of 14% (vs. a baseline error rate of 34%), all but one of the OB samples was classified correctly by this set of features. The remaining misclassified samples were from the NW controls. Their misclassification could not be explained by BMI z-score or age, but most of the misclassified samples (six of eight) were from female subjects. Features ranked with high importance in the classifier included those identified as a part of the differential abundance analysis described above, as well as seven additional OTUs (see Supplementary Fig. S2 for visual representation of relative contributions to classifier accuracy).
Correlations with BMI z-Scores
The abundances of seven OTUs correlated significantly with BMI z-scores (q < 0.05) and an additional seven OTUs displayed marginally significant correlations (q < 0.10) (Fig. 2).
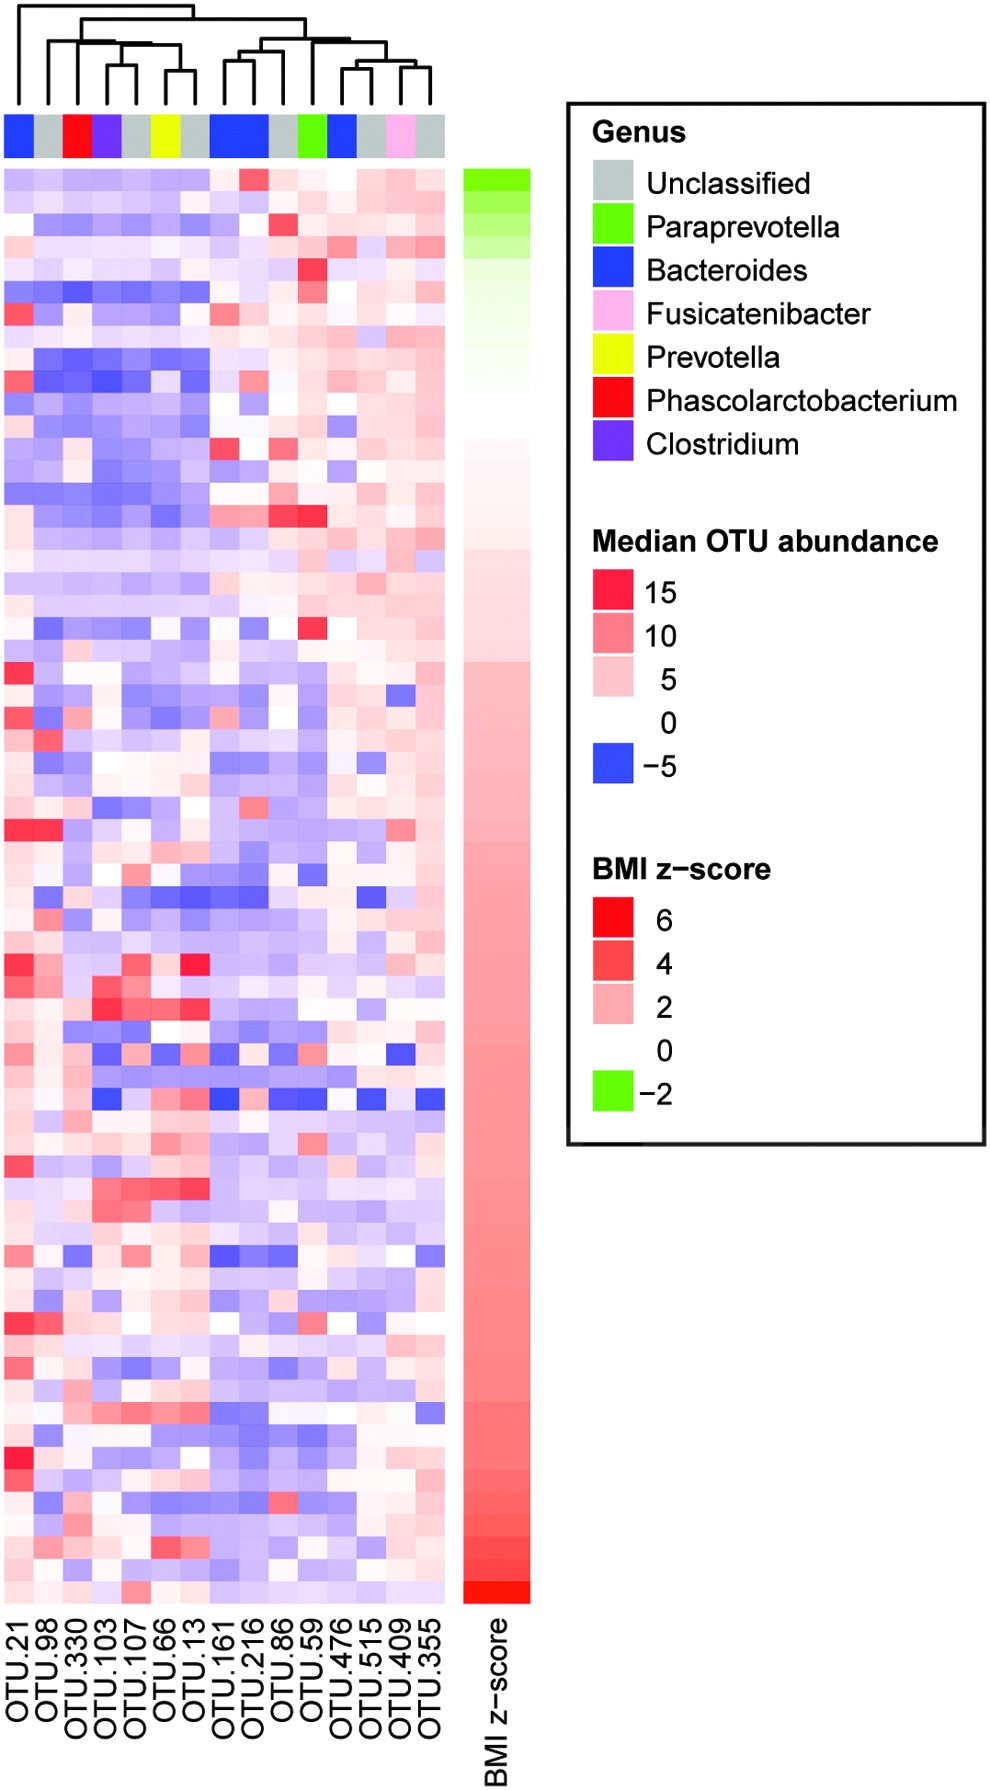
Heat map depicting the distribution and relative abundance (median-transformed values) of OTUs, which correlated with BMI z-scores across normal-weight and obese children (baseline specimens, n = 64 subjects). BMI, body mass index.
Obese Children over Time
From subject to subject, a wide degree of variation was observed with respect to the relative similarity (or “stability”) of stool microbiota between the baseline and postintervention samples (Fig. 1C). Although within-subject shifts in microbiota composition were observed, they did not occur in a consistent manner across subjects. Thus, no significant differences were identified with respect to microbiota composition over the 6-month period between baseline and completion of the behavioral intervention in the OB children (n = 30). Likewise, no significant differences were observed as a function of long-term (i.e., 12 month) weight-based outcomes. Also, using an ANCOVA model where differences in reported diet at 6 months were controlled for as a function of baseline composition, there were no significant differences in microbiota composition.
Obese Children at 6 Months vs. NW
In comparing the stool microbial community composition of the OB children after the 6-month intervention to the NW children (at baseline), we identified six OTUs that differed significantly in terms of their relative abundance (Table 2). As identified at baseline, OTU_13, a Bacteroides massiliensis-like organism, remained enriched in the stool of OB children, and OTU_59, a Bacteroides plebeius-like organism remained enriched in the stool of NW children. Following the 6-month intervention, the relative abundance of OTU_21, an unclassified member of the class Bacteroidales, which also correlated with BMI z-score (Table 2), was significantly enriched in OB children, and the relative abundances of two Clostridium-like OTUs and a Ruthenibacterium-like OTU were significantly enriched in NW children.
Correlation of Operational Taxonomic Unit Abundances with Body Mass Index z-Scores Across Normal Weight (n = 22) and Obese (n = 42) Children
Spearman correlations were used to identify relationships between variables, and the Benjamini-Hochberg procedure was used to apply false discovery rate corrections.
Discussion
The role of the intestinal microbiome in the pathophysiology of obesity is an area of great interest and many studies have demonstrated associative or potentially causal links between the gut microbiome and obesity. In particular, data from animal models support a role for the microbiome in the pathogenesis of obesity, as obese phenotypes can be conferred following fecal transfer from obese donors.9,34 Human studies have also found associations between the gut microbiome composition and obesity;35–37 however, the strength of these associations may be weaker than initially thought, as implicated species have varied from study to study and recent meta-analyses have demonstrated that the ability to classify patients as obese or nonobese, based on their microbiome characteristics alone is limited.6,36,38
In this examination of the stool microbiota in children, we found minor differences between OB and NW participants with respect to microbiota composition and no differences with respect to diversity metrics or summary measures like the F:B ratio, which is now considered largely meaningless with respect to obesity in humans. 36 Although we observed a high degree of intra-individual variation with respect to microbiota composition over time, we did not observe statistically significant changes over a 6-month period of time in the OB children, despite significant decreases in weight and changes in their reported dietary intake.
A lack of distinction between NW and OB microbiota profiles at the whole community level, but identification of individual OTUs or species, which differed significantly between NW and OB children in this study, is consistent with prior findings. 39 The OTU classified as Bacteroides plebius was significantly more abundant in NW children, and the enrichment of a Bacteroides plebeius-like organism in NW individuals has also been described in the study of NW and OB adults from the Netherlands. 35 We found Bacteroides massiliensis to be both enriched in the stool of OB children and positively correlated with BMI z-scores. Similarly, B. massiliensis was also more abundant in OB German adults (stool assessed at baseline) who did not have success with weight loss vs. those who had sustained success, suggesting that it may contribute to or help maintain an obese phenotype. 39
Gut microbiota composition is known to vary as a function of habitual diet.40–42 Dramatic and reproducible shifts in microbiota composition have been induced with defined diets,43,44 and associations between sugar-sweetened beverages and the intestinal microbiome have been described in animal model work, 45 but individualized responses of the human gut microbiota to dietary interventions are commonly observed. For example, the adoption of low fermentable carbohydrate diets or consumption of prebiotic compounds has resulted in variable and often individualized responses at the microbiome level.46–48 Work from a humanized mouse model suggests that a microbial community's response to dietary intervention may depend upon the presence of diet-responsive taxa. 49 Although the children participating in this study reported changes to their diet, including reduced consumption of sugar and sugar-sweetened beverages and increased consumption of fiber, it is possible that subject-to-subject variation with respect to the types and quantities of food consumed and/or baseline microbiota configurations may have contributed to the individualized microbiome responses we observed.
Timing may also explain the lack of consistent microbiome response across subjects. A recent study in mice showed that the microbiome changes associated with diet-induced obesity were not fully reversed upon recovery of NW and metabolic profiles. 50 Rather, there was a 21-week lag between the animals' return to NW and reversion of the gut microbiota to a normal phenotype. 50 This may explain the lack of a significant association seen in this study where obese children made significant changes in their diet, while no significant differences in the stool microbiome were observed. An alternative hypothesis is that there may be multiple pathways by which the microbiota contributes to obesity, and the lack of a consistent signal is a function of that heterogeneity.
The limitations of this study include the relatively small sample size, although the longitudinal nature of the data within an obese cohort of children is novel. In addition, while the control samples (NW children) were recruited from the same educational centers, had the same food offered during their attendance at the centers, and were Hispanic, it is possible that they came from distinct family environments (e.g., family size and parental BMI). Since we did not collect such information on the controls, unmeasured potentially confounding variables may be a limitation.
In conclusion, we identified clear, but limited, differences between the gut microbiota of young children at a normal weight compared with children at an obese weight in this south Texas cohort. We did not, however, observe common group shifts in microbiota composition among the obese children, despite having significant dietary and body weight changes.
Footnotes
Acknowledgments
Research reported in this publication was supported by the National Institute of Diabetes And Digestive And Kidney Diseases of the National Institutes of Health under Award Number K23DK109199 to Dr. B.A.F. This research was also supported by a grant from the John L. Santikos Charitable Foundation Fund of the San Antonio Area Foundation. Clinical trials registry:  NCT02373670
Author Disclosure Statement
No competing financial interests exist.
References
Supplementary Material
Please find the following supplemental material available below.
For Open Access articles published under a Creative Commons License, all supplemental material carries the same license as the article it is associated with.
For non-Open Access articles published, all supplemental material carries a non-exclusive license, and permission requests for re-use of supplemental material or any part of supplemental material shall be sent directly to the copyright owner as specified in the copyright notice associated with the article.
