
Abstract
Abstract
Objective:
Higher body–mass index (BMI) and lower birth weight (BW) are associated with elevated risk of diabetes in adulthood, but the extent to which they compose two distinct pathways is unclear.
Methods:
We used data from the National Longitudinal Study of Adolescent to Adult Health, a cohort of adolescents (1994–1995) followed for 14 years over four waves into adulthood (n = 13,413). Sex-stratified path analysis was used to examine pathways from BW [kg; linear (BW) and quadratic (BW2)] to latent trajectories in BMI from adolescence to adulthood to prevalent diabetes or prediabetes (pre/diabetes) in adulthood, adjusting for sociodemographic characteristics.
Results:
Two pathways from BW to pre/diabetes were characterized: one from higher BW to elevated BMI and pre/diabetes and a second from lower BW, independent of BMI. In the BMI-independent pathway, greater BW was associated with marginally lower odds of pre/diabetes in women, but not men. Girls born at lower and higher BW exhibited elevated BMI in adolescence [coeff (95% CI): BW: −2.1 (−4.1, −0.05); BW2: 0.43 (0.09, 0.76)]; higher BW predicted marginally faster BMI gain and higher adolescent BMI and faster BMI gain were associated with pre/diabetes [coeff (95% CI): BMI intercept: 0.09 (0.06, 0.11); BMI slope: 0.11 (0.07, 0.15)]. In boys, BW was weakly associated with BMI intercept and slope; BMI slope, but not BMI intercept, was positively associated with pre/diabetes [coeff (95% CI): 0.29 (0.19, 0.39)].
Conclusions:
Findings suggest that in girls, slowing BMI gain is critical for diabetes prevention, yet it may not address distinct pathology stemming from early life.
Introduction
The prevalence of diabetes is ∼9.4% in the United States 1 and 8.5% worldwide. 2 Obesity during childhood or adulthood is associated with greater risk of diabetes,3,4 and prenatal development has emerged as an important contributor to diabetes susceptibility.5,6 These mechanisms support the conceptualization of type 2 diabetes as a heterogeneous condition 7 that emerges through multiple pathways.
Elucidation of pathways leading from prenatal development to diabetes is critical for informing diabetes prevention strategies. Low birth weight—an indicator of fetal growth restriction that is often followed by compensatory growth in infancy—consistently predicts higher diabetes risk.8,9 Obesity prevention is a cornerstone of diabetes prevention, yet overall low birth weight is associated with lower overweight risk. 10 Importantly, experimental research suggests that fetal growth restriction may increase vulnerability to diabetes through insulin resistance and impaired insulin secretion, even in the absence of obesity. 11 Macrosomia—an indicator of developmental overnutrition—is associated with higher body–mass index (BMI) later in life 10 and, in some studies, higher diabetes risk. 9 Therefore, diabetes may develop through obesity-dependent and obesity-independent mechanisms, but these pathways have not been well studied.
The transition from adolescence to adulthood may be a particularly sensitive period during which trajectories of BMI gain differentiate individuals who do or do not develop diabetes. These pathways may further vary by sex due to behavioral, psychosocial, or biological differences. The objective of this study was to characterize sex-specific pathways between birth weight and diabetes in adulthood that occur through BMI-dependent and BMI-independent pathways from adolescence to adulthood in a nationally representative, contemporary US cohort.
Methods
Study Population
We examined data from the National Longitudinal Study of Adolescent to Adult Health (Add Health), a cohort of over 20,000 adolescents followed for over 14 years into adulthood. 12 Initially a school-based study, the core sample represents all adolescents attending US public, private, and parochial schools, grades 7–12, in the 1994–1995 school year, with oversampled groups (e.g., non-Hispanic black adolescents with a college-educated parent). The Wave I in-home participant and parental interview was conducted in the 1994–1995 academic year (11–21 years of age; N = 20,745). Wave II included all eligible adolescents who would have been in school in 1995–1996 (excluding those who graduated in 1995) (N = 14,738). All located Wave I respondents were eligible for Waves III (2001–2002; N = 15,197) and IV (2008–2009; N = 15,701). All waves included an in-home interview and biospecimens were collected in Wave IV.
Among participants in the probability sample (n = 18,923), we included 17,288 non-Hispanic white, non-Hispanic black, and Hispanic participants (n = 1635 other race/ethnicities excluded). Inclusion of Asian or other race led to difficulties with model convergence, likely due to the small number and heterogeneity of participants in these categories. Of these, we excluded 3866 with fewer than 2 nonpregnant BMI measurements (n = 980 with 0 BMI measures, 2886 with 1 BMI measure). As a result of our age-specific cohort design, we further excluded participants who were 11 years of age at Wave I (n = 9). Information about multiple births or gestational age at birth of the participant was not available. The remaining 13,413 participants composed the analytic sample for this study.
Study Variables
Birth weight (exposure) was reported by the participant's parent in pounds and ounces during the in-home Wave I interview; parent-reported birth weight is valid. 13 We converted birth weight to kilograms then, to characterize diabetes risk across the full birth weight spectrum, and examined continuous birth weight (kg) in primary analysis. We categorized birth weight as low (<2500 g), normal, and high (>4000 g) for descriptive analysis. Gestational age at birth was not recorded, precluding the distinction of fetal growth restriction from premature birth.
Diabetes or prediabetes (pre/diabetes; outcome). Diabetes was defined as HbA1c≥6.5%, self-reported physician diagnosis, or report of diabetes medication. Prediabetes was defined as HbA1C of 5.7%–6.4% or fasting glucose of 100–125 mg/dL. HbA1c was collected at Wave IV from standardized whole blood spot assays 14 collected from finger pricks, which exhibit similar precision and reliability as venipuncture. 13 While the prevalence of diabetes in this young adult study population indicates substantial public health burden (6%), we combined prediabetes and diabetes (pre/diabetes), comparing with no diabetes, to achieve stable estimates in our path analysis. In general, the percentage of diabetes (vs. prediabetes) was similar across birth weight groups (Supplementary Table S1; Supplementary Data are available online at www.liebertpub.com/chi); in one exception, among those with pre/diabetes, a greater percentage of participants had diabetes among low birth weight females (38%) compared with normal and high birth weight females (≈30%). Because we were unable to distinguish between type 1 and type 2 diabetes, we examined prediabetes (vs. no diabetes), a precursor to type 2 diabetes, in a sensitivity analysis.
BMI (mediator) was calculated from height and weight measured at Waves II, III, and IV using standardized protocols. BMI trajectory analysis analyzed BMI (kg/m2), rather than BMI z-scores, as recommended for analysis spanning the transition from adolescence to young adulthood. 14
Control variables. Race/ethnicity (non-Hispanic white, non-Hispanic black, Hispanic) was classified based on adolescent self-report or, if missing, parental report at Wave I. Sex was self-reported at each wave. Age was calculated from self-reported date of birth and interview date at each wave. Socioeconomic status (SES) in adolescence was indicated by highest parental education (<high school graduate, high school graduate, some college, college graduate) and household income, both reported by the parent at Wave I; SES at Waves III and IV was indicated by the participant's education and household income. Participant smoking status (current smoker or not) was self-reported at each wave.
Statistical Analyses
We conducted data management and descriptive analyses using Stata 13 15 and latent growth curve (LGC) analyses in Mplus 7.2. 16 Mplus accounts for missing data within the analytic sample of 13,413 participants using full information maximum likelihood estimation. Sample weights provided by Add Health helped to account for nonparticipation in Wave II, III, or IV. 17 All analyses adjusted for complex survey design (e.g., clustering) using the Stata survey function or the complex analysis command in Mplus. We stratified by sex due to prior research suggesting sex differences in the relationship between birth weight and BMI. 18
Latent growth curve analyses
We estimated the effects of birth weight (as a proxy for prenatal development) on BMI at baseline (Wave II, the first wave with objectively measured height and weight) and over time (Waves III and IV) and pre/diabetes (Wave IV) (Fig. 1). Trajectory analysis offered the advantages of examining BMI from adolescence to adulthood, addressing within-person correlation of BMI across time points, and maintaining temporal sequencing of birth weight, BMI, and diabetes.
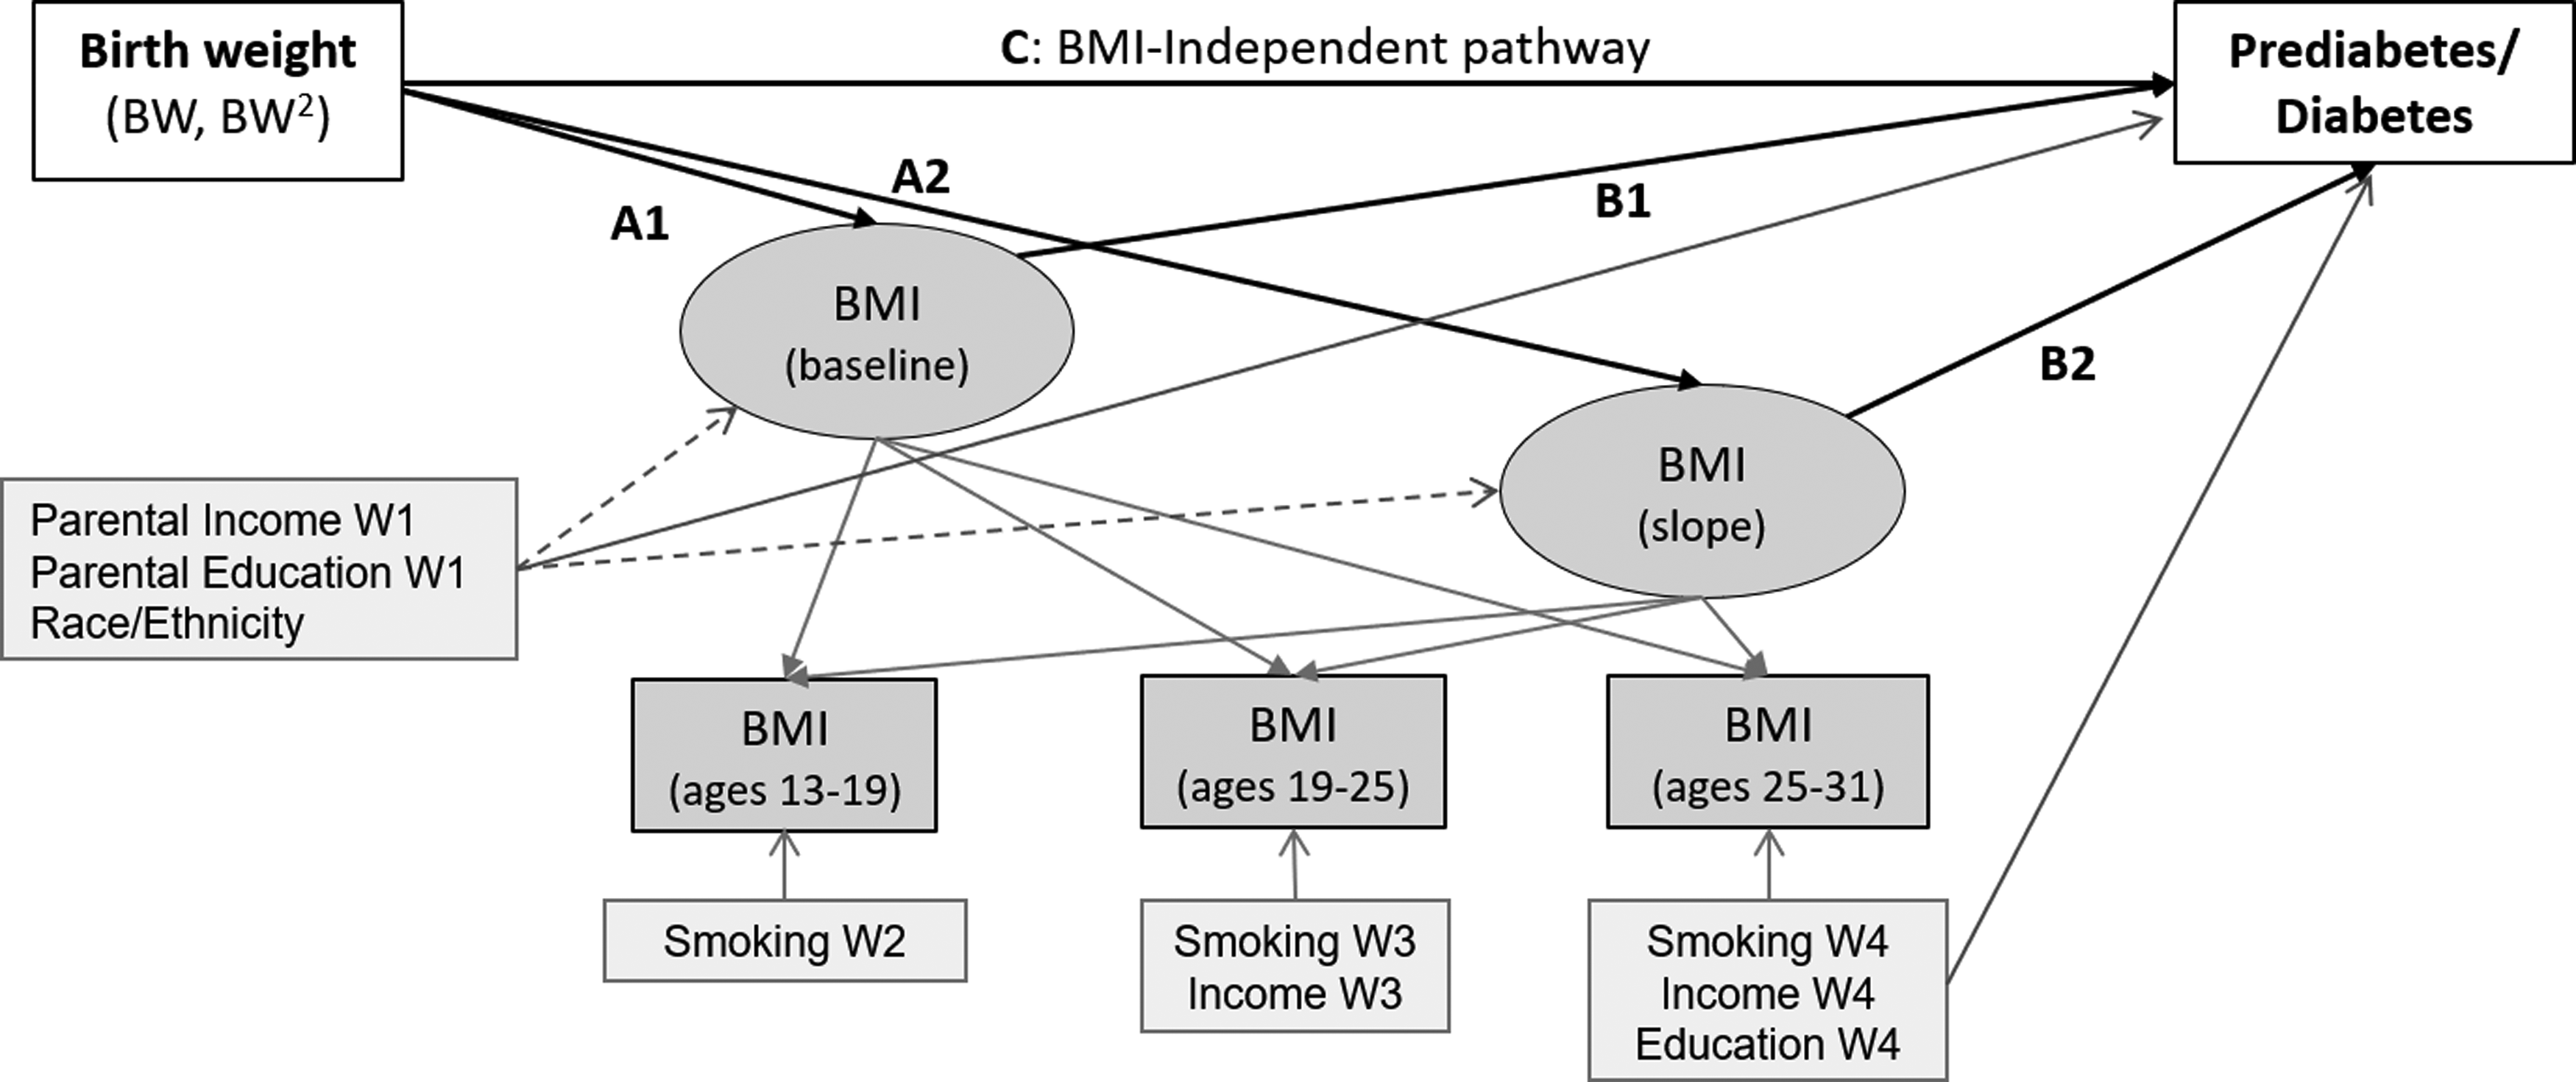
Path analysis of pathway from birth weight to latent BMI trajectory and prediabetes/diabetes. Path analysis was sex stratified and included birth weight to BMI intercept and BMI slope (paths A1 and A2; Model 2) and pre/diabetes (path C; Model 1) and from BMI intercept and BMI slope to pre/diabetes (paths B1 and B2; Model 3). Latent BMI trajectory used an accelerated cohort design to account for the broad age range at each wave by examining BMI trajectory over age (rather than over wave).
An accelerated cohort design was used to examine BMI trajectory with increasing age, rather than across study wave. Because adolescence is a critical period of BMI change, trajectories from baselines of early versus late adolescence observed in Wave I can mask age-related differences. Participants were 12–19 years of age at Wave I, providing eight age cohorts (12-year-old cohort, 13-year-old cohort, etc.). The 11-year-old cohort was small (n = 9) and therefore excluded. Each participant had at most three data points of 20; to accommodate the large degree of planned missingness, we set the acceptable minimum covariance coverage to zero.
The robust maximum likelihood estimator addressed the skewed distribution of BMI in LGC models. Model comparisons were made using the Bayesian information criterion (BIC); we were unable to calculate standard SEM fit statistics (e.g., Comparative Fit Index) because numerical integration was required to fit our models.
BMI trajectories were defined by their average intercept (i, baseline, age 13) and slope (s, change from 13 to 31 years of age). We estimated linear trajectories because a maximum of three BMI time points were available for each participant; while pediatric growth is curvilinear, BMI increases approximately linearly throughout the ages under study. 19 For each sex, we built three adjusted LGC models, each controlling for time invariant and time-varying control variables (full model with covariates shown in Fig. 1). Analogous crude associations are reported in Supplementary Tables S2 and S3. Model 1 examined the overall association between birth weight and pre/diabetes. Model 2 examined the association between birth weight and BMI trajectory. Linear, quadratic, and cubic birth weight terms were tested; linear and quadratic terms were retained in association with BMI intercept and BMI slope on the basis of statistical significance (Wald p < 0.05) of the quadratic term and change in BIC (>10) in models with versus without the quadratic term. Model 3 combined Models 1 and 2, estimating the full pathway from birth weight to BMI trajectory to pre/diabetes (BMI-dependent) and the BMI-independent pathway from birth weight to pre/diabetes.
We did not conduct formal mediation analysis, which would quantify the extent to which inclusion of the BMI-dependent pathway attenuates the birth weight–diabetes association. Based on prior evidence22,23 and known biological mechanisms, 11 we expected BMI adjustment to yield stronger rather than weaker associations, suggesting substantive importance of the BMI-independent pathway. Therefore, our goal was to characterize two pathways leading from birth weight to diabetes.
Results
Study participants were racially and ethnically diverse and, on average, 15 years of age at Wave I and 29 years at Wave IV (Table 1). Girls and boys lived in households with similar income and parental education level in adolescence. In adulthood, women gained more education, but had lower incomes than men. Girls and boys were born with similar birth weights (3.3 and 3.4 kg in girls and boys, respectively) and experienced similar gains in BMI across Waves II–IV. In adulthood, pre/diabetes prevalence was higher in men (25.3%) versus women (19.3%).
Study Sample Characteristics: National Longitudinal Study for Adolescent and Adult Health
Thirteen thousand four hundred thirteen participants with ≥2 BMI measures; non-Hispanic white, non-Hispanic black, or Hispanic race/ethnicity; 12 years of age or older at Wave I.
GED, general equivalency diploma.
Overall and BMI-Independent Pathways from Birth Weight to Pre/Diabetes
Overall associations between heavier weight at birth and pre/diabetes were negative, but not statistically significant in women and men (Tables 2 and 3, Model 1); these overall associations represent combined BMI-dependent and–independent pathways. In women, higher birth weight was significantly and more strongly associated with lower odds of pre/diabetes in the full model [odds ratio (OR) (95% CI): Model 3, 0.79 (0.68, 0.92); Model 1, 0.88 (0.76, 1.03); exponentiated coefficients from Table 2; Fig. 2c], which adjusted for BMI trajectory, thus representing the birth weight–pre/diabetes association that occurs through pathways other than BMI. In men, birth weight was not associated with pre/diabetes regardless of adjustment for BMI trajectory (Table 3, Models 1 and 3).
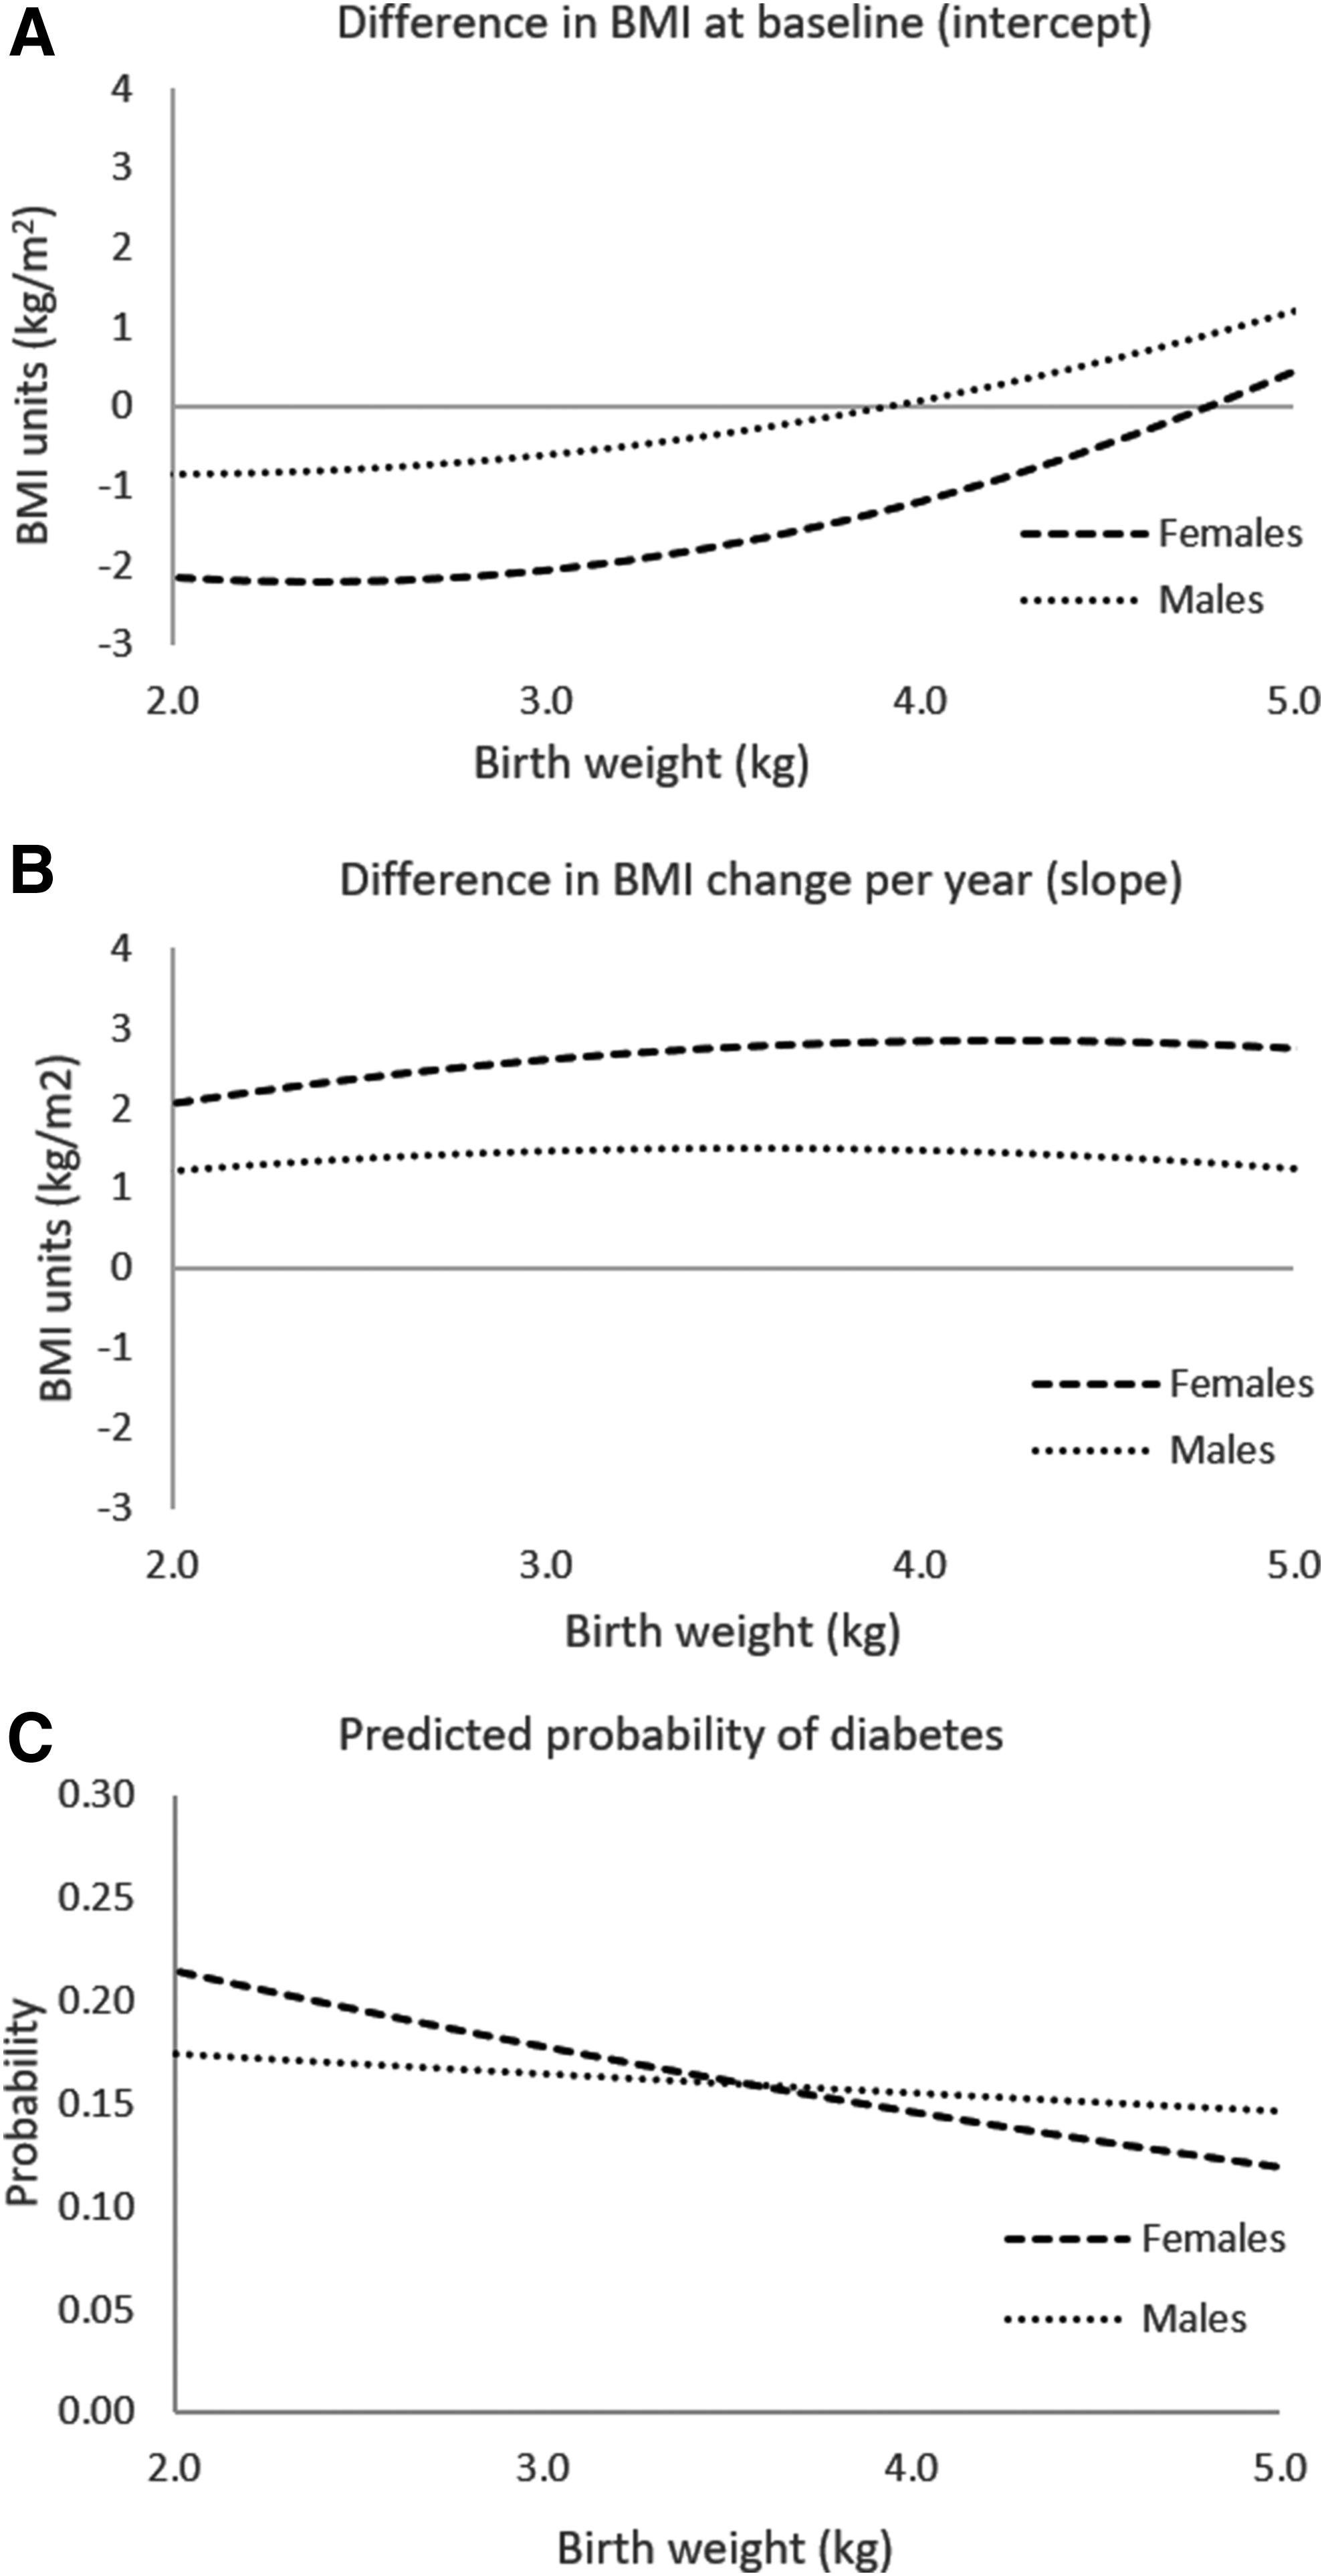
Graphical display of association between birth weight and BMI intercept and slope in females and males. National Longitudinal Study for Adolescent and Adult Health (n = 7012 females, 6401 males). Predicted curves calculated from coefficients estimated from sex-stratified path analysis models of pathways from birth weight (linear and quadratic terms) to BMI intercept, BMI slope, and pre/diabetes and from BMI intercept and BMI slope to pre/diabetes (Model 3, Tables 2 and 3). Adjusted for race/ethnicity, parental education, and parental income at Wave I and time-varying smoking, participant income, and participant education.
Associations between Birth Weight, BMI Trajectory, and Pre/Diabetes in Adulthood: Females
National Longitudinal Study for Adolescent and Adult Health (n = 7012 females). Associations estimated from gender-stratified path analysis models predicting latent BMI trajectories from adolescence (age 12–19) to adulthood (age 25–32). All models adjusted for race/ethnicity, parental education, and parental income at Wave I and time-varying smoking, participant income, and participant education. Bold font indicates statistical significance (p < 0.05).
Log-odds estimates (95% confidence interval); odds ratios are calculated as exp(coefficient).
Unstandardized linear regression coefficients.
Model 1 examines the overall association between birth weight and pre/diabetes.
Model 2 examines the association between birth weight and BMI trajectory.
Model 3 examines the full pathway from birth weight to BMI trajectory and BMI trajectory to pre/diabetes.
Associations between Birth Weight, BMI Trajectory, and Pre/Diabetes in Adulthood: Males
National Longitudinal Study for Adolescent and Adult Health (n = 6401 males). Associations estimated from gender-stratified path analysis models predicting latent BMI trajectories from adolescence (age 12–19) to adulthood (age 25–32). All models adjusted for race/ethnicity, parental education, and parental income at Wave I and time-varying smoking, participant income, and participant education. Bold font indicates statistical significance (p < 0.05).
Log-odds estimates (95% confidence interval); odds ratios are calculated as exp(coefficient).
Unstandardized linear regression coefficients.
Model 1 examines the overall association between birth weight and pre/diabetes.
Model 2 examines the association between birth weight and BMI trajectory.
Model 3 examines the full pathway from birth weight to BMI trajectory and BMI trajectory to pre/diabetes.
BMI-Dependent Pathway from Birth Weight to Pre/Diabetes
We identified pathways from greater birth weight to higher BMI trajectory, which in turn predicted a greater probability of pre/diabetes in adulthood (Tables 2 and 3). In this study, we describe estimates from the full model (Model 3); associations between birth weight and BMI trajectory were similar in models without pathways to pre/diabetes (Model 2). To aid in interpretation, associations are graphically displayed in Figure 2.
In girls, greater birth weight was associated with higher BMI in early adolescence (BMI intercept); this association was nonlinear, such that it was observed in birth weights of 3.0 kg and greater, and was more pronounced in the upper range of birth weights (Fig. 2a; Table 2). Girls born with higher birth weights gained BMI marginally faster from adolescence to adulthood (BMI slope; Fig. 2b). In turn, both BMI in early adolescence and BMI gain were associated with higher odds of pre/diabetes [OR (95% CI): 1.1 (1.06, 1.12) for each 1-unit difference in BMI intercept, 1.1 (1.07, 1.16) for each 1-unit increase in BMI per year; exponentiated coefficients from Table 2, Model 3].
In boys, associations were similar, but attenuated relative to girls (Fig. 2; Table 3). In one exception, faster BMI gain from adolescence to adulthood was associated with 34% greater odds of adulthood pre/diabetes [OR (95% CI): 1.34 (1.2, 1.5) for 1-unit increase in BMI per year].
In the analysis examining prediabetes (vs. no diabetes) as an alternative outcome, model results were similar (Supplementary Table S4), suggesting that our findings were not attributable to type 1, as opposed to type 2, diabetes.
Discussion
In this study, we characterized two pathways from birth weight to diabetes in adulthood in a contemporary US cohort. One pathway occurred from higher birth weight to elevated BMI and subsequent pre/diabetes. A second pathway stemmed from lower birth weight, independent of BMI throughout adolescence and adulthood. Our trajectory analysis further suggests that pathways through BMI may occur over specific time periods in the life course, such as rapid BMI gain from adolescence to adulthood in boys and girls, and before adolescence in girls. These findings have implications for the type and timing of diabetes prevention strategies.
Overall Association between Birth Weight and Pre/Diabetes in Adulthood
Our findings about the overall association between birth weight and pre/diabetes in adulthood corroborate a substantial body of research. In women, we found odds ratios of 0.79 and 0.88 of pre/diabetes for a 1-kg increment in birth weight; while these associations were not statistically significant, the direction and magnitude of association are virtually identical to a pooled odds ratio of 0.80 in a meta-analysis of 31 studies. 8
Our analysis differed from most prior studies on birth weight and diabetes in two key ways. First, we found that birth weight was unrelated to pre/diabetes in men. In a handful of prior studies that tested for effect modification by sex 24 or examined study populations restricted to men or women,12,22,23 evidence of sex differences in the association between birth weight and diabetes was mixed. Sex differences could reflect numerous biological, developmental, or behavioral processes discussed in a later section. Second, our outcome included both prediabetes and diabetes ascertained at 25–32 years of age, capturing future cases that may emerge in subsequent decades of life. However, our combined outcome also includes prediabetes that does not progress to diabetes, potentially resulting in misclassification bias; the extent to which prenatal development impacts resilience to progression from prediabetes to diabetes is an important area of future study.
BMI-Independent and BMI-Dependent Pathways from Birth Weight to Diabetes
BMI-independent pathway
In girls, the BMI-independent association was similar, but slightly stronger than the overall association (OR = 0.79 vs. 0.88 for a 1-kg greater birth weight), consistent with Whincup et al.'s meta-analysis 8 and recent studies that compare associations with and without adjustment for BMI.22,23 These findings suggest that in girls, lower birth weight is associated with pre/diabetes in adulthood largely through BMI-independent pathways. However, this BMI-independent association was not observed in boys.
BMI-independent pathways from lower birth weight to diabetes likely reflect well-described characteristics of individuals who experienced intrauterine growth restriction. These characteristics include low pancreatic beta cell mass (lower capacity for insulin secretion), low muscle mass (lower capacity to metabolize glucose), insulin resistance, and inflammation. 25 Pathways stemming from these prenatally induced characteristics may underlie the diabetes phenotype that occurs in the absence of obesity. 26 Moreover, the BMI-independent pathway may be heterogeneous, involving multiple prenatally induced pathways that can be studied in populations with repeated measurements of body composition and requisite biomarkers.
Explanations for the observed sex differences in the BMI-independent pathway are unknown, but may include sex differences in developmental programming effects 27 or velocity of diabetes progression. In addition, BMI can mask differences in body composition or fat distribution that are important for diabetes risk, 28 and these differences may be more pronounced in boys as they grow into adults. Further investigation of physiologic or behavioral differences that may explain sex-specific pathways from early life to diabetes in adulthood is needed.
BMI-dependent pathway
A second pathway, more pronounced in girls, led from higher birth weight to higher BMI from adolescence to adulthood and later increased the likelihood of pre/diabetes. This pathway is consistent with a vast literature on the association between higher birth weight and obesity 10 and the role of obesity in the pathogenesis of diabetes. 29
Prior studies seeking to understand the role of BMI in the association between birth weight and diabetes typically compared associations before and after adjusting for BMI in adulthood.22,23 In one exception, Eriksson et al. examined associations along the pathway from birth weight to BMI to diabetes, focusing on childhood growth before 11 years. 7 Our findings are consistent with Eriksson et al.'s study, contributing complimentary evidence with regard to growth through adolescence to adulthood. Our path analysis approach enabled characterization of not only the BMI-independent pathway but also the pathway that occurs through BMI over a critical life stage transition period. Our approach also helps to prevent collider-stratification bias resulting from BMI adjustment 30 by modeling the two pathways separately and adjusting for confounding in the mediator–outcome association (Fig. 1).
Limitations and Strengths
Our study findings should be interpreted with regard to several limitations. We used birth weight as an indicator of prenatal development, but future research should examine size for gestational age and specific prenatal exposures (e.g., maternal obesity or nutrition). Similarly, BMI can mask interindividual differences in adiposity, including differences resulting from early life development. 31 We were unable to ascertain when BMI differences at our study baseline (adolescence) emerged, or examine sensitive developmental periods earlier in childhood; in particular, birth weight correlates with development in infancy, which is independently associated with later BMI. We lacked data on age at pubertal onset, which impacts the BMI trajectory during the age range under study. 32 Our trajectory analysis examined the critical life stage transition from adolescence to adulthood, yet did not test associations of BMI at specific adult time points with diabetes. We also lacked information on pre/diabetes before Wave IV, such that our dependent variable reflected prevalent pre/diabetes at 25–32 years of age; however, diabetes in adolescence is rare. 33 Furthermore, the analysis did not distinguish between type 1 and type 2 diabetes; type 1 diabetes accounts for only 5% of total diabetes cases in the United States, 34 but this proportion is higher in younger populations. 33 However, findings were similar in sensitivity analyses that examined prediabetes, a precursor to type 2 diabetes, suggesting that this limitation minimally influenced our results. Finally, although we adjusted for several important covariates, residual confounding may be present.
Balancing these limitations, our study leveraged valuable information spanning from birth to objectively measured height and weight throughout adolescence and adulthood and biomarker assessment of diabetic status in adulthood. Furthermore, the large, representative study population provided findings that are generalizable to a national population and supported sex-specific path analysis to understand complex pathways from prenatal to adult health.
Public Health Implications
Our findings suggest that diabetes prevention strategies may require elements that address pathways induced not only by obesity but also by adverse prenatal development. That is, ongoing efforts to reduce excess weight gain throughout childhood and adulthood are critical, but may be insufficient for preventing diabetes in subgroups with lower birth weight. Notably, low birth weight remains prevalent even in the context of Western obesogenic environments, corresponding to other risk factors such as maternal tobacco exposure and psychosocial stress,35–37 and maternal obesity-induced placental insufficiency. 38 Diabetes prevention in children with adverse prenatal development may include therapeutics,25,39 physical activity,20,40–44 or healthy diet45,46 that overcomes physiologic abnormalities stemming from adverse prenatal development. 47 Mitigation of adverse prenatal development requires a deeper understanding of pathways leading to diabetes in children and how these pathways vary by sex.
Footnotes
Acknowledgments
This research uses data from Add Health, a program project designed by J. Richard Udry, Peter S. Bearman, and Kathleen Mullan Harris, and is funded by a grant, no. P01-HD31921, from the Eunice Kennedy Shriver National Institute of Child Health and Human Development, with cooperative funding from 17 other agencies. Special acknowledgment is due to Ronald R. Rindfuss and Barbara Entwisle for assistance in the original design. Persons interested in obtaining data files from Add Health should contact Add Health, The University of North Carolina at Chapel Hill, Carolina Population Center, 206W. Franklin Street, Chapel Hill, NC 27516–2524 (addhealth_contracts@unc.edu). No direct support was received from grant no. P01-HD31921 for this analysis. The project described was supported by the Office of Research in Women's Health and the National Institute of Child Health and Human Development, Oregon, BIRCWH Award Number K12HD043488 (J.B.H.), and National Institute of Digestive Disorders and Nutrition K01DK102857 (J.B.H.). J.B.H. conceived the study, supervised all aspects of the study, and drafted the manuscripts. R.M.S. and E.T. performed statistical analysis. N.F.D. assisted with statistical analysis and interpretation of statistical findings and critically reviewed the manuscript. E.R.H., C.S.H., and K.L.T. assisted with the interpretation of study findings and critically reviewed the manuscript. All authors approved the final version of the manuscript and take responsibility for the contents of the article. An abstract of this study was presented at the American Heart Association Epidemiology/Lifestyle meeting in Portland, OR, on March 8, 2017.
Author Disclosure Statement
No competing financial interests exist.
References
Supplementary Material
Please find the following supplemental material available below.
For Open Access articles published under a Creative Commons License, all supplemental material carries the same license as the article it is associated with.
For non-Open Access articles published, all supplemental material carries a non-exclusive license, and permission requests for re-use of supplemental material or any part of supplemental material shall be sent directly to the copyright owner as specified in the copyright notice associated with the article.