
Abstract
Abstract
Background:
This study presents the impact of a 2-year implementation of Coordinated Approach to Child Health Early Childhood (CATCH EC), a preschool-based healthy nutrition and physical activity program, on child BMI z-scores, BMI percentiles, diet, physical activity, and sedentary behaviors among 3- to 5-year old children across Head Start centers in Houston and Austin, Texas.
Methods:
We used a quasi-experimental study design with serial cross-sectional data collection (Intervention catchment area: n = 12 centers, 353 parent-child dyads in Year 1; n = 12 centers, 365 parent-child dyads; Comparison catchment area: n = 13 centers in year 1, 319 parent child dyads; and n = 12 centers, 483 parent-child dyads in year 2). Child height and weight were measured and parent self-report surveys were conducted at year 1 (fall 2012) and year 2 (spring 2014).
Results:
In year 1, 34.8% of the children were overweight or obese, 74% were Hispanic, and >80% reported an annual household income of <$25,000. In year 2, 32.2% were overweight or obese, 72% were Hispanic, and 82.3% reported an annual income of <$25,000. Results demonstrated significantly lower child BMI z-scores [β = −0.26 (95% confidence interval, CI: −0.50 to −0.01), p = 0.041] and BMI percentiles [β = −6.5 (95% CI: −12.4 to −0.69), p = 0.028] from year 1 to 2 follow-up among those in intervention Head Start centers, compared to those in the comparison centers. There were no significant between-group changes in child dietary, physical activity, or screen time behaviors.
Conclusion:
Implementation of a preschool-based obesity prevention program can be modestly effective in lowering the prevalence of child overweight in low-income populations.
Introduction
The United States continues to struggle with the obesity epidemic. Even the nation's youngest are not spared with recent data from the 2015 to 2016 National Health Nutrition Examination Survey (NHANES) reporting 13.9% of children ages 2–5 years of age being obese with BMI percentile of ≥95.0. 1 These rates increase with increasing age; 18.4% of 6–11 years olds, 20.6% of 12–19 years old, and 39.6% of adults being classified as obese. Furthermore, the rates of extreme obesity (at or above 120% of the 95th BMI percentile) in this age group of 2–5 years old children has also been increasing over time. 1 Ethnic disparities in obesity rates are observed among children with 22.4% and 20.2% of Hispanic and Black children being obese, compared with 14.3% of their White counterparts. 2 Geographic differences are also observed with states in the southern part of the United States being most impacted from the disease when compared with other parts of the country. 3
Research has established that creating healthy lifestyle habits early on, including healthy diet and physical activity, can prevent obesity and mitigate the risk of other chronic diseases later in life. 4 The Texas Childhood Obesity Research Demonstration (TX CORD) study was conducted to address this persistent childhood obesity epidemic among those at highest risk. The overarching goal of the TX CORD study was to implement and evaluate an integrated, systems-oriented model to incorporate primary and secondary prevention approaches targeting multiple sectors at the clinic, school, preschools, and community organizations levels to mitigate obesity among children ages 2–12 years from low-income populations in Texas. 5 Primary prevention in schools included evidence-based obesity prevention programs, including Coordinated Approach to Child Health Early Childhood (CATCH EC) in preschools. 5 CATCH EC is a theoretically grounded, preschool-based program with the goal of creating opportunities for the child to practice healthy eating and physical activity behaviors in preschool and at home.6,7 The main outcome for the CATCH EC primary prevention component was change in prevalence of obesity measured using child BMI z-scores; secondary outcomes of interest included changes in child BMI percentiles, diet, physical activity, and screen time behaviors. The purpose of this article is to present the primary outcome results of the TX CORD primary prevention program, CATCH EC, implemented among 3–5 years old children across Head Start centers (federally funded preschools for low-income families) in Houston and Austin, Texas.
Methods
Participants
TX CORD primary prevention component for children ages 3–5 years used a quasi-experimental study design with serial cross-sectional data collected from Head Start centers in the intervention and comparison catchment areas in Houston and Austin, TX (Intervention catchment area: n = 12 centers in year 1 baseline, n = 12 centers in year 2 follow-up; Comparison catchment area: n = 13 centers in year 1 baseline, and n = 12 centers in year 2 follow-up). The Head Start sites at baseline and follow-up were the same. In year 2 follow-up, 1 Head Start comparison site participating at baseline closed and merged with another year 1 site resulting in 13 comparison Head Start centers at baseline, and 12 comparison Head Start centers at follow-up.
Sampling of the intervention and comparison catchment areas and description of the study design for TX CORD are presented elsewhere.5,8 Briefly, a three-stage Geographical Information System (GIS) methodology resulted in the selection of intervention and comparison catchment areas in Houston and Austin with demographic and socioeconomic characteristics that fit the target population: ethnically diverse population; lower-median household income; and lower home ownership rates. 8 Intervention and comparison catchment areas were assessed for comparability across sociodemographic characteristics. Briefly, the TX CORD study had multiple components including a secondary prevention randomized control trial (RCT) embedded within a community-based primary prevention CATCH implementation across preschools and elementary schools. While the RCT employed a longitudinal design, the primary prevention component employed a serial cross-sectional design primarily for ease of recruitment and measurement.
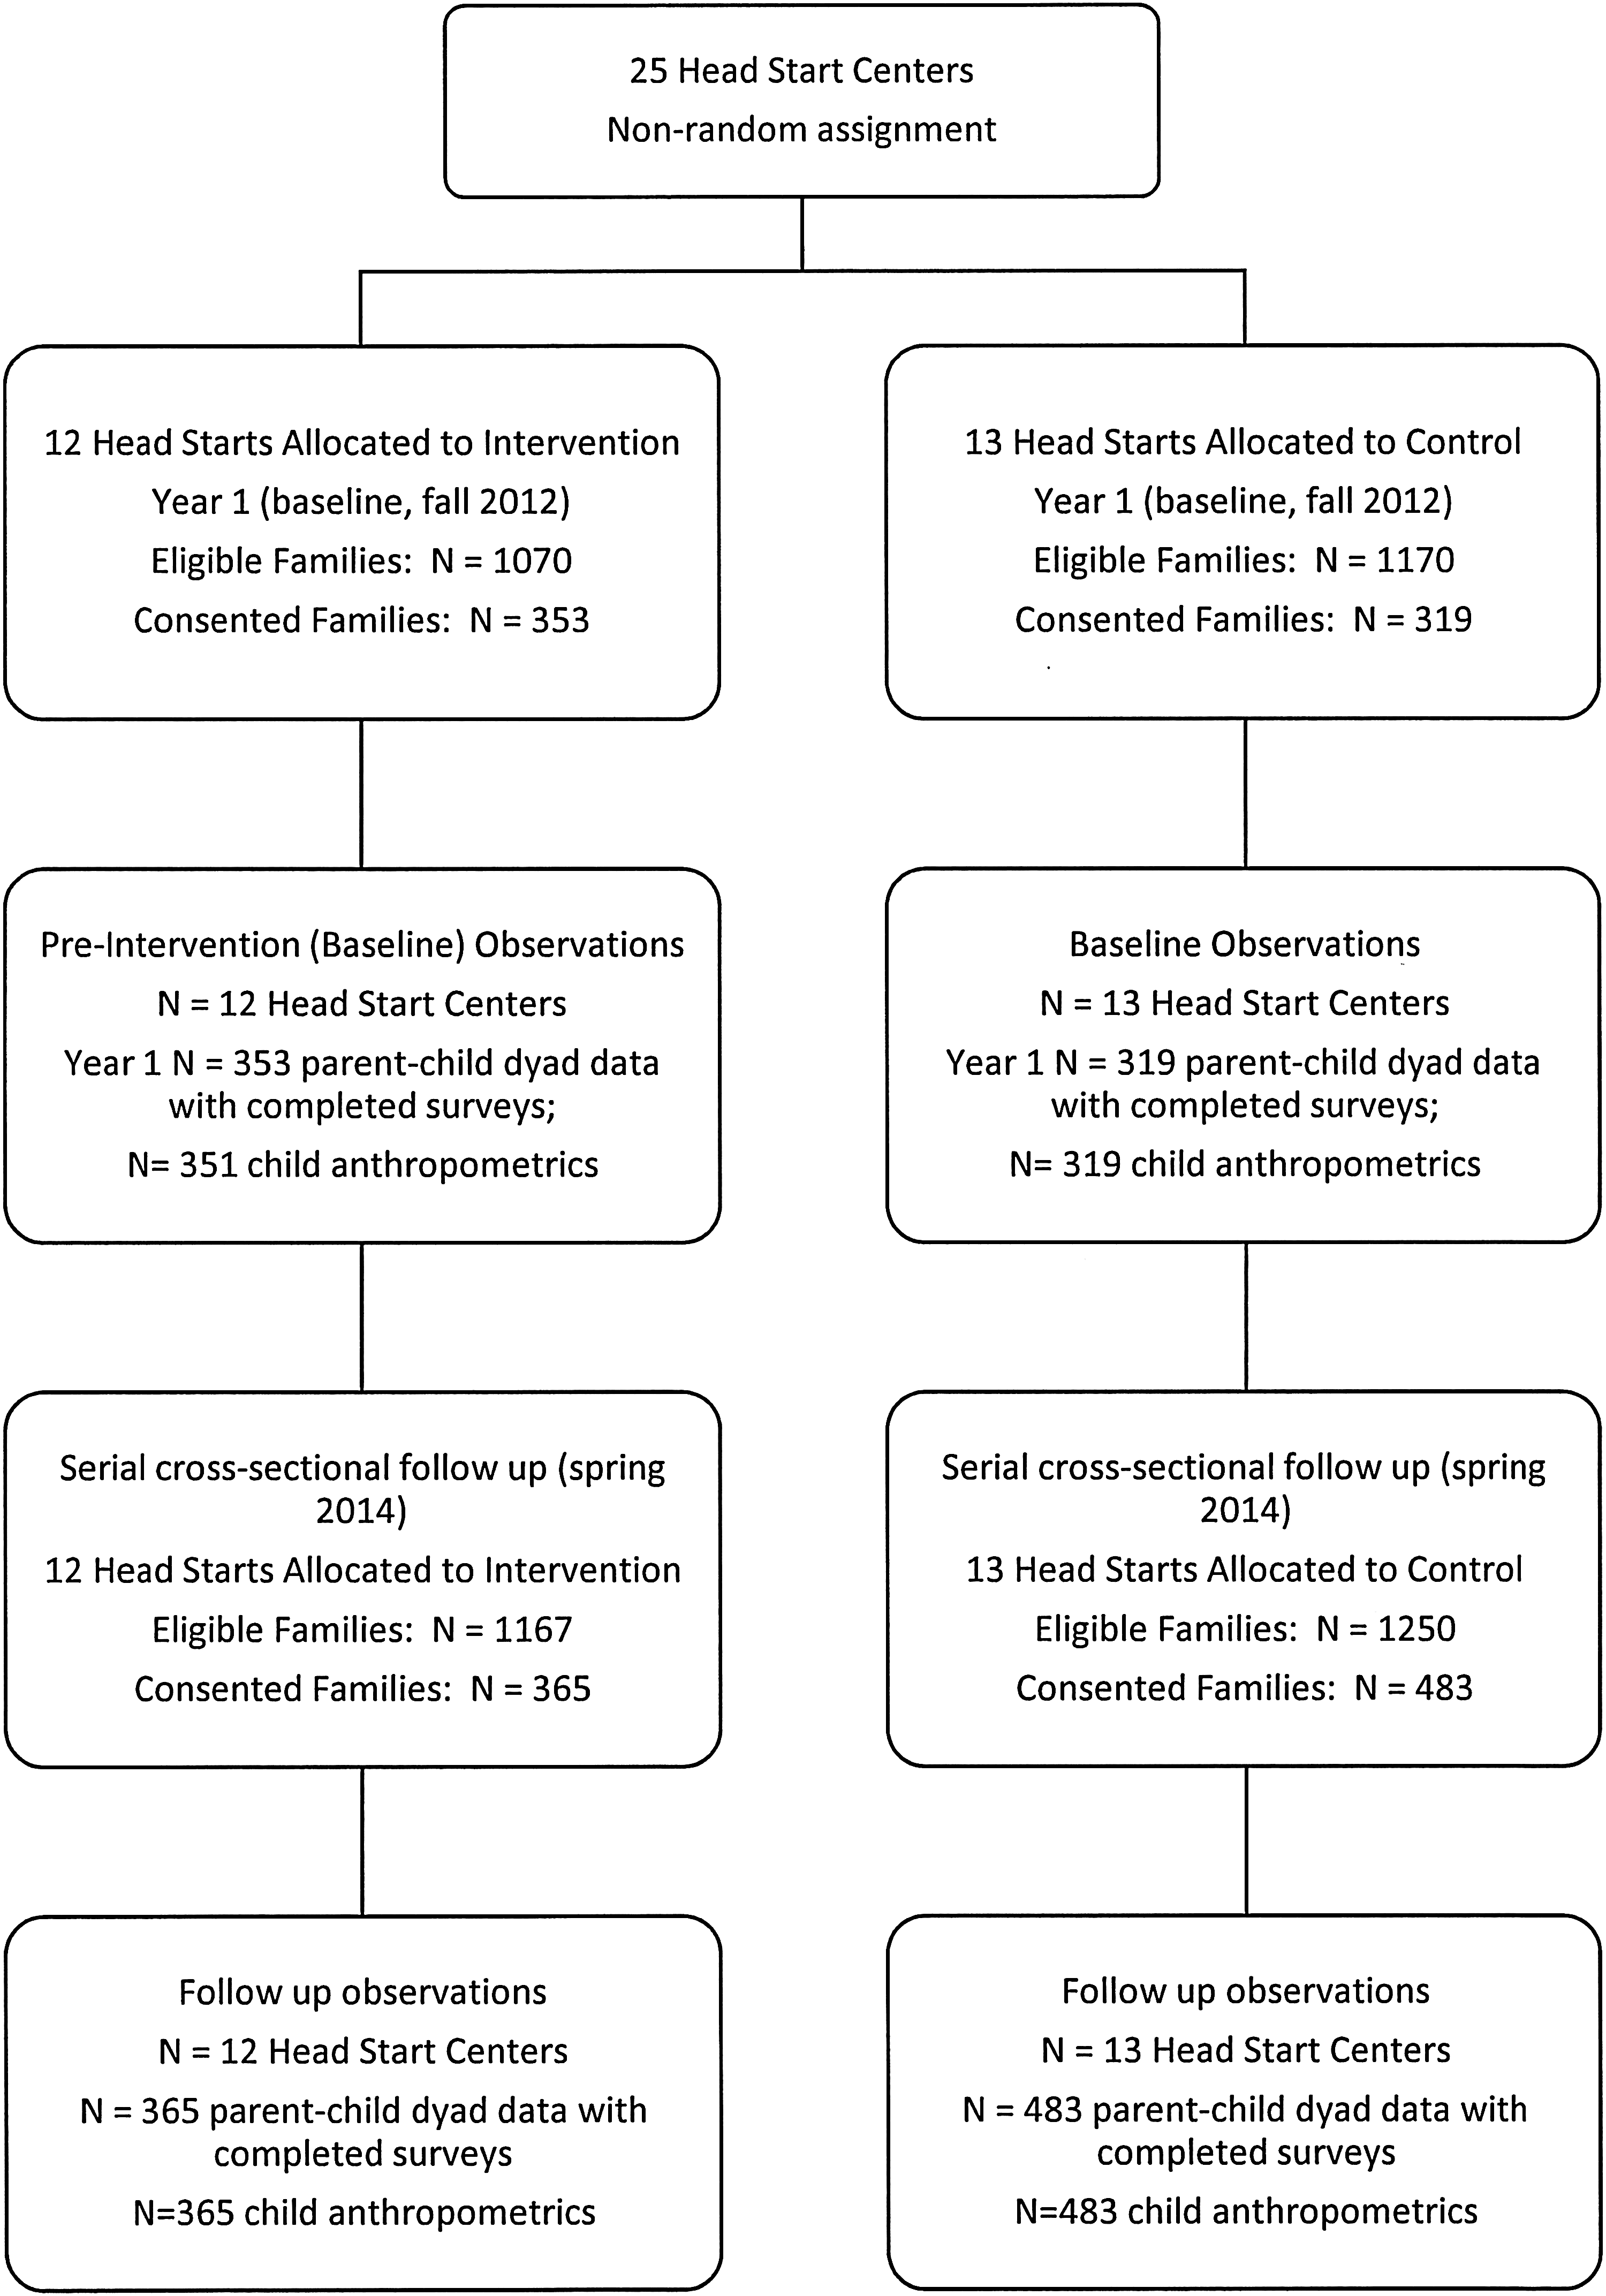
The CATCH EC program was implemented across Head Start centers in the intervention catchment areas in Houston and Austin. Project staff met with participating Head Start center directors to present the goals of the study and discuss recruitment strategies. Bilingual consent forms in English and Spanish along with parent surveys were sent home to the parents through their children in fall 2012 for the first cross-sectional measurement (baseline), and again in spring 2014 for the second cross-sectional measurement (follow-up). While the CATCH EC program was implemented across all the participating intervention centers across 2 school years, only those children whose parents consented to the study were measured. CATCH EC program was implemented across 2 school years starting fall 2012. Child and parent measurements were conducted in fall 2012 before implementation of CATCH EC (baseline) and spring 2014 (follow-up) after 2 school years of implementation. The final sample size for the analysis was n = 672 parent-child dyads at baseline (n = 353 intervention; n = 319 comparison) and n = 848 parent-child dyads at follow-up (n = 365 intervention; n = 483 comparison). See Figure 1 for the Consolidated Standards of Reporting Trials (CONSORT) diagram depicting study flow.
Description of the CATCH EC program
CATCH EC is a preschool-based program modeled after CATCH. CATCH is a behaviorally based school health promotion program based on Social Cognitive Theory 9 constructs to improve the school environment for healthy nutrition and physical activity. CATCH has been most effective in reducing obesity among very low income, African American and Hispanic children.10,11 CATCH EC has three main components: (1) It's Fun to be Healthy! a nutrition and gardening-based curriculum; (2) developmentally appropriate structured, indoor and outdoor physical activities; and (3) parent tip-sheets including recipes, meal plans, parent-child activities, and recommendations for preschoolers' diet, physical activity, and screen time. CATCH EC has been found to be highly acceptable and feasible among preschoolers from low-income, minority populations. 6 CATCH EC uses a train-the-trainer model whereby the preschool staff is trained over a 4- to 6-hour training period. Primary prevention approaches, such as CATCH EC, are complex with multiple intervention targets aimed to change multiple psychosocial and behavioral factors among children and their caregivers (e.g., teachers, parents). For the TX CORD study, CATCH EC trainings were conducted with the preschools in the intervention catchment areas in fall 2012 at the start of the study. A total of 92 Head Start teachers/directors were trained in the 12 intervention centers in year 1. At the start of year 2, another full training was conducted across the intervention centers for all teaching staff. Furthermore, across both years of implementation, program staff conducted technical support in the form of booster trainings, monthly messages, and email reminders. See Table 1 describing CATCH EC program components.
Coordinated Approach to Child Health Early Childhood Program Components
CATCH EC, Coordinated Approach to Child Health Early Childhood; MVPA, moderate-to-vigorous physical activity.
Data Collection Measures
Demographics
Parent and child demographics were collected at baseline and follow-up using parent surveys including child age, gender, race, and ethnicity. Parent demographics included parent age, gender, race, ethnicity, primary language spoken at home, income, and education level.
Child anthropometrics
Child height and weight were measured using stadiometers (Perspective Enterprises) and digital scales (Tanita). All measurements were conducted by trained project staff using standard protocols in fall 2012 and spring 2014. Height and weight were used to compute age and gender-specific BMI percentiles and z-scores. 12
Parent surveys
Parent surveys were sent home to the two cohorts of consenting parents at baseline (fall 2012) and follow-up (spring 2014). All surveys were offered in English or Spanish. Parents were requested to send the completed surveys back to their child's Head Start center in sealed envelopes provided, which were then collected by project staff. Surveys included items developed from previous survey instruments, including the School Physical Activity and Nutrition (SPAN) survey and other items including CORD common measures13–16 measuring child frequency of consumption of various foods including fruit, vegetables, French fries, sports drinks, water, and other sugar-sweetened beverages (e.g., sodas). For example: “Yesterday, did your child eat fruit? Do not count fruit juice. Please think about all forms of fruits, including cooked or raw, fresh, frozen, or canned.” Response options ranged on a 4-point scale from 0 times to 3 or more times. Parents were also asked about their child's frequency (times per week) of eating breakfast, eating dinner with the family, watching TV while eating dinner, and eating dinner from a restaurant. Parents were also asked about their child's time spent in sedentary behaviors, including minutes spent during the weekday and weekend day watching TV, playing video games. Finally, parents were asked about their child's time spent in physical activity, including number of days per week participated in more than 60 minutes of physical activity, and the number of days per week played outside for 30 minutes.
Process evaluation
Process evaluation was conducted using teacher and center director surveys documenting implementation of various CATCH EC program components. Furthermore, the surveys also asked questions regarding implementation of other health-related activities at the center. These data on other non-CATCH related health events were collected because Head Start performance standards17,18 mandate the implementation of nutrition and health education in their centers. Data were collected across both, intervention and comparison centers because the CATCH EC program has been available for purchase nationwide since 2010. Also, we wanted to monitor implementation of other non-CATCH health-related activities since this could significantly influence the study outcomes. All intervention and comparison center directors and teachers completed the surveys at the end of years 1 and 2 of implementation (Spring 2013 and Spring 2014, respectively). A total of 122 teachers in year 1, and 105 teachers in year 2 across 12 intervention Head Start centers completed the survey. In the comparison catchment area, a total of 120 teachers in year 1 and 102 teachers in year 2 across 13 Head Start centers completed the surveys. The survey included 23 questions on CATCH EC implementation including (1) access to materials (4 items), (2) usage (4 items), (3) support for implementation (4 items), (4) child enjoyment of the program (3 items), (5) sending parent tip-sheets home (1 item), (6) sending program extension activities home (1 item), and (7) implementation of non-CATCH preschool health-related events and activities (6 items). Additionally, the center director survey measured center policies and practices and staff opportunities around nutrition and physical activity (11 items). Response options were Yes/No on a Likert-type scale. Details regarding the TX CORD process evaluation methodology and results are presented elsewhere. Briefly, two composite implementation indices were developed. The CATCH EC implementation index measured the implementation of the CATCH EC program, while the overall implementation index measured the implementation of CATCH EC plus non-CATCH health-related activities. Implementation scores were first computed separately for teachers and center directors, and then averaged to compute mean CATCH EC implementation index (CATCH EC II) and overall implementation index (Overall II) scores for each year of implementation. Surveys with <80% completion were excluded from the analysis (<5% exclusion). Percent implementation score was computed to standardize scores for CATCH EC II and Overall II: Percent Score = [(observed score)/(total available score)] × 100.
Power analysis
For the TX CORD project, the primary prevention assessments of a representative sample of children from the target and comparison catchment areas were compared at baseline and year 2 of implementation to examine the effect of the primary prevention program on child BMI z-scores as the primary outcome. Our analyses accounts for clustering of children within child care centers, as outlined in the statistical analysis section below. Power analyses conducted assuming power = 0.80, alpha = 0.05 two-tailed, effect size = 0.15, and one random effect to account for school-based sampling indicates that a total sample of 538 children (n = 269 per intervention and comparison group) at each of the two time points needed to compare the intervention and comparison catchment areas.
Statistical Analysis
STATA version 15.0 statistical software was used for all analysis (STATA Corp, College Station, TX). The final sample size for the analysis was n = 672 parent-child dyads at baseline (n = 353 intervention; n = 319 comparison) and n = 848 parent-child dyads at follow-up (n = 365 intervention; n = 483 comparison). Missing data were excluded from the analysis. For descriptive analysis, means, standard deviations, and frequencies were computed for the sociodemographic and BMI variables that were primary outcomes of interest for this study. Pearson's chi-square test and student's t-test were used to examine the baseline differences in years 1 and 2 between the intervention and comparison groups for sociodemographic characteristics and parent and child BMI.
This study examined the effects of whether the 2 school-year implementation of the CATCH EC program had an impact on BMI z-scores and percentiles among children enrolled in the Head Start centers in the intervention catchment areas compared with those in the comparison catchment areas. Secondary outcomes of interest included changes in frequency of child intake of various healthy and unhealthy foods, time spent in physical activity, and screen time behaviors. Multilevel linear regression analysis was used to compare the serial cross-sectional pre-to-post changes in the outcome variables in the intervention and control groups. This study adjusted for the variation among Head Start centers and the variation among children nested within Head Start centers, thus controlling for cluster effects. 19 We employed a random-intercept regression model with Head Start center as a random effect in the analysis. Various known confounders that were considered for inclusion into each of the regression models included city (Houston and Austin), child race/ethnicity and gender, parental race, and education level. Collinearity among the variables was assessed. Variance inflation factor for all of the variables was <10. Backward selection technique was used for variables selection. Any covariate that resulted in a change of the point estimate by >10% were included in the final model. Significance level for all analyses was set at 0.05.
Results
Results of the demographic data presented in Table 2 outline the household, parent, and child characteristics of the study sample stratified by the intervention and comparison Head Start centers in years 1 (baseline) and 2 (2-year follow-up) measurements. On average, across both years of measurement, the household size was 4.6 members per household with 2.6 children. Approximately 80% of the sample across both years had an annual household income of ≤$25,000 with no differences between intervention and comparison centers across both years. Also, across years 1 and 2, a significant proportion of the sample reported being on Women, Infants and Children's (WIC) program (>50%) and Supplementation Nutrition Assistance Program (SNAP; >60%), federal assistance programs, and over 80% of the children were on Medicaid. Significantly more parents in the intervention centers reported receiving SNAP benefits compared with those in the comparison centers across both years of measurement (p < 0.05). Also, across years 1 and 2, a majority of the parents were reportedly Hispanic (>70%), married (>59%), employed (>50%), and had a high school diploma or less (>70%). There were no differences by intervention and control group across all these variables. For year 1, children in the comparison centers (mean age: 4.2 years) were slightly younger than those in the intervention centers (mean age: 4.3 years, p = 0.0215). A majority of the sample was Hispanic (>70%), and >20% were Black across both years. In year 2, a greater proportion of the children in the intervention centers were Hispanic and smaller proportion were Black (p < 0.001). Approximately 35% of the children were overweight or obese across years 1 and 2, with no significant differences between the intervention and comparison centers. There were no significant differences in the average BMI z-scores across the BMI z-scores or percentiles across years 1 and 2.
Participant Demographics at Baseline and Follow-Up Stratified by Intervention and Comparison Groups, Texas Childhood Obesity Research Demonstration Study
CHIP, Children's Health Insurance Program; SD, standard deviation; SNAP, Supplementation Nutrition Assistance Program; WIC, Women, Infants and Children.
The primary outcome of the study was change in obesity prevalence using child BMI z-scores. Results of the 2-year implementation of the CATCH EC program demonstrated significantly lower BMI z-scores: [β = −0.26 (95% confidence interval CI: −0.50 to −0.01), p = 0.041], and BMI percentiles [BMI percentiles: β = −6.5 (95% CI: −12.4 to −0.69), p = 0.028] among children at the 2-year follow-up compared with those in year 1 in the intervention centers when compared with those in the comparison centers. Within-group changes demonstrate that the child BMI percentiles and z-scores were lower at year 2 follow-up compared with baseline among children in the intervention centers, whereas they concurrently were higher among those in the comparison centers (Table 3).
Within and Between-Group Changes in Child BMI z-Scores and Percentiles, Texas Childhood Obesity Research Demonstration Study
Within-group changes using mixed-model regression analysis adjusting for school as a random effect.
Between-group changes using mixed-model regression analysis adjusting for school as a random effect. Covariates adjusted for in the analysis include city (Houston and Austin), child age, ethnicity, gender, and parent income level.
Significant at p < 0.05.
CI, confidence interval; SE. standard error.
The secondary outcomes of the study were child diet, physical activity, and sedentary behaviors (Table 4). Results showed that there were no statistically significant between-group changes at year 2 follow-up. There were several noteworthy within-group changes. There was a significantly higher frequency of intake of fruit among children in intervention centers (p = 0.009) in year 2 when compared with year 1, but not among those in the comparison centers. There was a significantly higher intake of French fries among children in the comparison centers in year 2 compared with year 1 (p = 0.000), but not in the intervention centers. Similarly, there was a significantly higher frequency of eating dinner at a restaurant in year 2 compared with year 1 among those in the comparison centers (p = 0.009), with no significant changes among those in the intervention centers.
Within and Between-Group Changes in Child Dietary Habits, Physical Activity, and Sedentary Behaviors, Texas Childhood Obesity Research Demonstration Study
Within-group changes using mixed-model regression analysis adjusting for school as a random effect.
Between-group changes using mixed-model regression analysis adjusting for school as a random effect. Covariates adjusted for in the analysis include city (Houston and Austin), child age, ethnicity, gender, and parent income level.
Significant at p < 0.05.
Process Evaluation
The process evaluation data showed high level of CATCH EC program implementation among the intervention centers for both year 1 (mean score: 81.4% ± 2.9%) and year 2 (mean score: 84.52% ± 2.9%) indicating that across both years, there was over 80% implementation across the various CATCH EC components (Table 5). Interestingly, our data showed some CATCH EC implementation across four comparison centers (mean scores: 51.01% ± 10.8 at year 1; 39.01% ± 11.6 at year 2). Among the intervention centers, the highest scores across both, center directors and teachers were for CATCH EC program access and usage (mean score >85% across both years), followed by CATCH EC enjoyment and support (mean score >75% across both years). The lowest scores were for CATCH EC parent tip-sheets and extension activities sent home to parents with mean scores ranging from 53% to 74% across both years of implementation. The overall implementation index (CATCH + non-CATCH health activities) showed overall higher implementation scores across both years in the intervention centers (mean score: 74.7% in year 1; 72.0% in year 2) compared with those in the comparison centers (mean score: 45.5% in year 1; 44.2% in year 2).
Process Evaluation for Primary Prevention Intervention in Head Start Centers, Texas Childhood Obesity Research Demonstration Study
% Score is calculated: Score = (original score)/(original potential score range) × 100. Higher score indicates higher level of implementation.
Teacher and center director responses.
CATCH EC implementation index for center is calculated based on 12 items from the director-level survey.
Teacher responses only.
CATCH EC implementation index for teacher is calculated based on 17 items from the teacher-level survey.
Overall implementation index for center is calculated based on 37 items from the director-level survey.
Overall implementation index for teacher is calculated based on 22 items from the teacher-level survey.
Result from Mann–Whitney U test to assess differences between intervention and comparison centers in years 1 and 2, p < 0.05.
Discussion
Significantly lower BMI z-scores and BMI percentiles were seen in year 2 compared with year 1 among children across Head Start centers implementing CATCH EC in the TX CORD intervention catchment areas compared with those in the comparison catchment areas. Furthermore, process evaluation demonstrated high implementation of CATCH EC across the intervention sites, and even though the cohorts of children in years and 1 and 2 were different the participating Head Start centers were the same. Finally, we conducted outcome and process evaluation across intervention and comparison sites, and our outcome analysis assessed for between and within-group changes in years 1 and 2 adjusting for baseline differences, city, center, and individual-level covariates, indicating that the outcomes seen in our study were likely due to the implementation of CATCH EC. The literature on testing interventions in Head Start settings is sparse. Our results concur with the findings of other studies that have demonstrated significant improvements in BMI of children following the implementation of preschool-based programs,20–22 and adds to the current body of literature on evidence-based strategies to implement in a preschool environment, specifically Head Start. However, in contrast to our study, a recent study published by Lumeng et al., 23 of a cluster-randomized intervention trial in Head Start classrooms in Michigan demonstrated significant improvements in child self-regulation but no impact on child prevalence of obesity. To our knowledge, there was one other randomized controlled trial of a preschool-based intervention among Head Start children in Illinois that reported significant reductions in child BMI from baseline to 2-year follow-up. 24 These varying results on child BMI across studies in Head Start settings may suggest that subsets of children may respond differently to interventions warranting the need for additional work in this area to identify the biological, behavioral, environmental, or other predisposing moderators of these interventions in future studies. 25 Our results also concur with a recent systematic review of the literature 26 that reported that while a few obesity prevention interventions in child care settings have demonstrated successful changes in the child BMI levels, these interventions may or may not demonstrate favorable improvements in the obesity-related behaviors such as diet and physical activity.
Furthermore, results of the process evaluation, measured using teacher and director surveys, demonstrate high implementation of the various CATCH EC program components (>80% of program components implemented). Interestingly, our process evaluation results also demonstrated similar high implementation of the CATCH EC program across four comparison centers. This was because the participating comparison centers were trained in implementing the CATCH EC program before the TX CORD study as part of their regular “standard of care” (Head Start director, personnel communication). However, it is important to note that, this implementation of the CATCH EC program in the comparison centers could have significantly attenuated the findings of our study. However, our study was a “real-life” effectiveness study and since the comparison centers were implementing CATCH EC before the TX CORD study, from an ethical perspective, restriction of implementation of programs such as CATCH EC was not an option. These results also underscore the importance of process evaluation efforts across both intervention and comparison groups in experimental studies.
Notably, while we did see significantly lower BMI at 2-year follow-up compared with baseline among children in the intervention centers, when compared with those in the comparison centers, we did not see concurrent significant improvements in child diet, activity, and sedentary behaviors (Table 4). One reason for the lack of significant between-group differences in diet and activity could be because these were secondary outcomes and we lacked sufficient power, and also the serial cross-sectional study design used in our study. Thus, children enrolled at baseline were not necessarily those enrolled at the 2-year follow-up. Longitudinal repeated measures studies are stronger in design and warranted in future studies but difficult in Head Start centers in which annual enrollment changes substantially. Finally, the CATCH EC program is a teacher-led preschool-based program, and while there are parent engagement components to the program, a large portion of the program components are preschool based. Also, in Head Start centers, children may receive their breakfast, lunch, and two snacks while at school, thus eating a majority of their meals outside of home away from the parents. Similarly, given that children are spending a majority of their day at school, a significant amount of their time spent in activity is also away from home. Given that the child diet and activity behaviors were measured using parent-reported surveys, parents may not have complete knowledge of these behaviors as they pertain to the time their child spends away from home that can significantly influence findings. Our next step is to assess results of the teacher and center director surveys to evaluate the impact of the CATCH EC program on Head Start center environment.
Strengths of the study include training and execution of the CATCH EC program in a number of Head Start Centers with many competing priorities and challenges; use of validated surveys, achieving adequate sample size, and participation rates in a population of low-income, ethnically diverse children and their parents. Finally, child height and weight were objectively measured across the two time points. These strengths notwithstanding, our study has some limitations. This includes use of parent-reported survey data for child diet and activity that could result in social desirability bias, and potential recall bias in knowing what the child behaviors were at school away from home. Furthermore, the survey items, even though previously validated, were not again validated as part of this study. The serial cross-sectional design (vs. a longitudinal cohort design) limits causality. However, even though the cohorts of children were different across both years of measurement, it is important to note that the Head Start centers measured were the same. Finally, we had a convenience sample (vs. random sample) of Head Start centers located within the intervention and comparison catchment areas that were invited to participate in the study. Lack of random sampling and randomization can limit internal validity of the findings.
Conclusion
In conclusion, the results of our study demonstrate that implementation of a primary prevention program over 2 years was successful and demonstrated modest improvements in BMI z-scores and percentiles among children enrolled in Head Start centers participating in the TX CORD study. These results have significant implications in the promise of such programs using train-the-trainer model for Head Start providers to create healthy environments in the preschool and promote obesity prevention behaviors among preschoolers.
Footnotes
Acknowledgments
This research was supported by cooperative agreement RFA-DP-11-007 from the CDC. The content is solely the responsibility of the authors and does not necessarily represent the official views of the CDC. Additional support was provided by the Michael and Susan Dell Foundation through the Michael & Susan Dell Center for Healthy Living. This work is a publication of the USDA (USDA/ARS) Children's Nutrition Research Center, Department of Pediatrics, Baylor College of Medicine, Houston, Texas, and has been funded, in part, with federal funds from the USDA/ARS under Cooperative Agreement number 58-6250-0-008. The contents of this publication do not necessarily reflect the views or policies of the USDA, nor does mention of trade names, commercial products, or organizations imply endorsement from the U.S. government.
Author Disclosure Statement
The authors do not have any conflicts to disclose.