
Abstract
Abstract
Objective:
To explore the accuracy of using parent-reported data for screening children and adolescents with overweight and/or obesity at both population and individual levels by quantitatively synthesizing previous inconsistent findings in the research literature.
Method:
PubMed, Web of Science, and EBSCOhost were searched up to December 2017. A study was included if it explored the accuracy of using parent-reported data (i.e., BMI based on parent-reported height and weight; BMIpr) relative to directly measured data (i.e., BMI based on measured height and weight; BMIm) for screening children and adolescents with overweight and/or obesity.
Results:
Fourteen studies were identified for the meta-analysis at population level. Using a random-effects model, the use of BMIpr overestimated the prevalence of overweight and obesity among children and adolescents compared with BMIm, with prevalence ratio = 1.118 (95% confidence interval [CI]: 1.027–1.216). Thirteen studies were included in the meta-analysis at individual level. The use of BMIpr for screening children and adolescents with overweight and/or obesity showed a pooled sensitivity of 0.713 (95% CI: 0.700–0.726) and a pooled specificity of 0.918 (95% CI: 0.915–0.922). Moreover, subgroup analyses and meta-regressions showed that its accuracy at both levels differed by certain conditions.
Conclusion:
Based on the results of the current two meta-analyses, the use of BMIpr was not accurate at either population level or individual level. However, considering that its accuracy varied by certain conditions, future researchers using BMIpr may consider these findings to achieve a more accurate screening of overweight and obesity among children and adolescents.
Introduction
Overweight and obesity in youth have been shown to have significant negative effects on their physical health, mental health, and quality of life.1–5 To date, the increasing prevalence of overweight and obesity among children and adolescents has become a well-recognized international public health issue.6,7 Consequently, surveillance of overweight and obesity among children and adolescents is not only crucial for monitoring the prevalence of overweight and obesity among children and adolescents but also important for evaluating the success of policies aiming at controlling the youth obesity epidemic. 8
In consideration of convenience and survey cost, instead of using directly measured height and weight from children and adolescents for BMI (BMIm), both parent-reported height and weight (BMIpr) and self-reported height and weight (BMIsr) are frequently used for screening weight status for children and adolescents, especially in large-scale surveys.9–13 Thus, how accurate is using BMIpr and BMIsr relative to BMIm becomes very important.
In addition, it should be noted that the purpose of using BMIpr/BMIsr is either for monitoring the prevalence of weight status at the population level or for assessing a person's weight status at the individual level. 14 Thus, the accuracy of using BMIpr/BMIsr also has two levels. Specifically, at the population level, the difference between the prevalence derived from BMIpr/BMIsr and that from BMIm is the concern. 15 At the individual level, however, the diagnostic accuracy (e.g., sensitivity and specificity) of using BMIpr/BMIsr, relative to the use of BMIm, is what the researcher cares about. 9
Currently, the accuracy of using BMIsr for screening children and adolescents with overweight and obesity at both population and individual levels has been summarized in the relevant meta-analysis studies.9,15 The results showed that at the population level, the prevalence of overweight and obesity among children and adolescents derived from BMIsr was significantly lower than that based on BMIm, 15 whereas at the individual level, BMIsr had a good overall diagnostic accuracy with moderate sensitivity and high specificity. 9
Similar to BMIsr, BMIpr is also widely used for screening for weight status for children and adolescents.16–19 According to one study comparing both BMIsr and BMIpr relative to BMIm, 20 BMIpr was found to be as accurate as BMIsr, and they could be used interchangeably. Moreover, one strength of BMIpr over BMIsr is that it can be applicable for very young children who cannot report their heights and weights.11,21–28 Thus, the accuracy of using BMIpr is also of importance. To date, many studies, therefore, have explored the accuracy of using BMIpr for screening overweight and obesity status among children and adolescents.11,16,20,22–39
However, as with BMIsr,9,15 the findings concerning the accuracy of using BMIpr from previous literature are also inconsistent at both population and individual levels. Specifically, at the population level, some studies reported that compared with the prevalence of overweight and obesity among children and adolescents derived from BMIm, a higher prevalence from BMIpr was found,11,22,26,29 while some other studies reported that BMIpr and BMIm generated similar prevalence25,28,30,32,33 or even lower prevalence was from BMIpr.20,27 Regarding the findings at the individual level, inconsistency of findings from different studies was also obvious, with previously reported sensitivities ranging from 22.2% 25 to 89.8% 11 and specificities ranging from 72.8% 11 to 99.64%. 27 Consequently, the accuracy of using BMIpr at both population and individual levels remains unclear.
Although there have been meta-analyses exploring the accuracy of using BMIsr for screening overweight and obesity among children and adolescents, to the best of our knowledge, there is no systematic review or meta-analysis about the accuracy of using BMIpr for such purpose at either population level or individual level. Considering the inconsistency among the existing literature and the inevitable use of BMIpr in future studies, a systematic review of previous findings about the accuracy of using BMIpr is important and strongly needed.
Therefore, in the current work, meta-analyses at both population and individual levels were conducted to explore:
(1a) whether, and to what extent, the prevalence of overweight and obesity among children and adolescents derived from BMIpr is different from that from BMIm? (1b) what factors might have contributed to the inconsistencies among previous studies about the difference of prevalence derived from BMIpr and BMIm? (2a) what is the overall diagnostic accuracy (e.g., sensitivity and specificity) of using BMIpr for screening overweight and obesity for individual children and adolescents? (2b) what factors might have contributed to the inconsistencies among previous studies about the diagnostic accuracy of using BMIpr?
Study 1: Meta-Analysis at the Population Level
Methods
The current meta-analysis was conducted following PRISMA (Preferred Reporting Items for Systematic Reviews and Meta-Analyses) guidelines. 40
Literature search
Three databases (PubMed, Web of Science, and EBSCOhost, including all subdatabases, e.g., MEDLINE) were used to identify relevant studies for inclusion in the meta-analysis. The search covered the research literature up to December 2017. The keywords used were: (parent-reported OR parent-report) AND (height and weight OR heights and weights OR body mass index OR BMI) AND (children OR adolescents OR kids OR youngsters OR youth OR pediatric). Moreover, in a follow-up search, from December 2017 to January 2018, Google Scholar was used to find additional relevant articles that might not be included in the three databases used. In addition, the references cited in the included article were also checked for potential additional studies.
Selection Criteria
To be included in the meta-analysis at the population level, a study should meet the following criteria: (1) the study should be written in English and published in a peer-reviewed journal; (2) the age of the participants in the study should be no more than 18 years old (i.e., children and adolescents); (3) the study should be an observational investigation (e.g., not a randomized trial 37 or a simulation study 38 ); (4) the study should have reported the prevalence of overweight and/or obesity using both BMIpr and BMIm from same participants (or there was sufficient information in the study to allow the calculation of the prevalence).
Assessment of quality
The first author and one research assistant independently assessed the quality of the studies included, and disagreements were resolved through discussion. The Revised Tool for the Quality Assessment of Diagnostic Accuracy (QUADAS-2) 41 was used for quality assessment. The QUADAS-2 contains four key domains, namely “patient selections,” “index test” (i.e., BMIpr in the current meta-analysis), “reference standard” (i.e., BMIm in the current meta-analysis), and “flow and timing,” and these four domains were combined to assess the quality of the studies included.
Extraction of data
The first author and one research assistant extracted relevant information from the studies included, and disagreements were resolved by their discussion. Specifically, the following information was coded: (1) the last name of the first author; (2) publication year; (3) country; (4) sample size; (5) age (range and/or mean); (6) gender (percentage of female); (7) weight status measured [overweight (including obesity) and/or obesity]; (8) weight status screening tools [World Health Organization standard (WHO), 42 Centers for Disease Control and Prevention standard (CDC), 43 International Obesity Task Force standard (IOTF), 44 and Nation-specific standard (e.g., the national German reference 45 )]; (9) the prevalence rate of overweight and/or obesity based on BMIpr (i.e., Ppr); and (10) the prevalence rate of overweight and/or obesity based on BMIm (i.e., Pm).
Data analysis
The prevalence ratio (PR) was obtained from each study using the equation of PR = Ppr/Pm. 15 Specifically, PR > 1, PR = 1, or PR < 1 indicates overestimation, equal estimation, and underestimation of the prevalence of overweight and obesity, respectively, by BMIpr. 15 Furthermore, there are two popular statistical models for a meta-analysis,46,47 the fixed-effect model and the random-effects model. The random-effects model is generally a more plausible match when studies are gathered from the published literature. 47 Thus, a random-effects model was used to obtain the pooled estimate of PR. The heterogeneity was assessed by the Q-statistic and the I2 statistic, 48 and I2 values of 25%, 50%, and 75% suggest low, moderate, and high heterogeneity, respectively. 48 Publication bias was graphically displayed by a funnel plot and statistically assessed by Begg's and Egger's tests, with p-values greater than 0.05 indicating no publication bias.49,50 To explore the heterogeneity resulted from potential moderator factors, subgroup analyses and meta-regressions were conducted. The meta-analysis at the population level was conducted using the Comprehensive Meta-Analysis Version 3 (Biostat, Englewood, NJ).
Results
A total of 511 potentially eligible articles were retrieved by the literature search, of which 277 articles were left after duplicate deletion. The remaining 277 were then screened by titles and abstracts. Of these, 26 were screened out and subjected to full-text review. Finally, 14 articles11,20,22–33 were found to have met the criteria of inclusion. The process of literature search is presented in Figure 1.
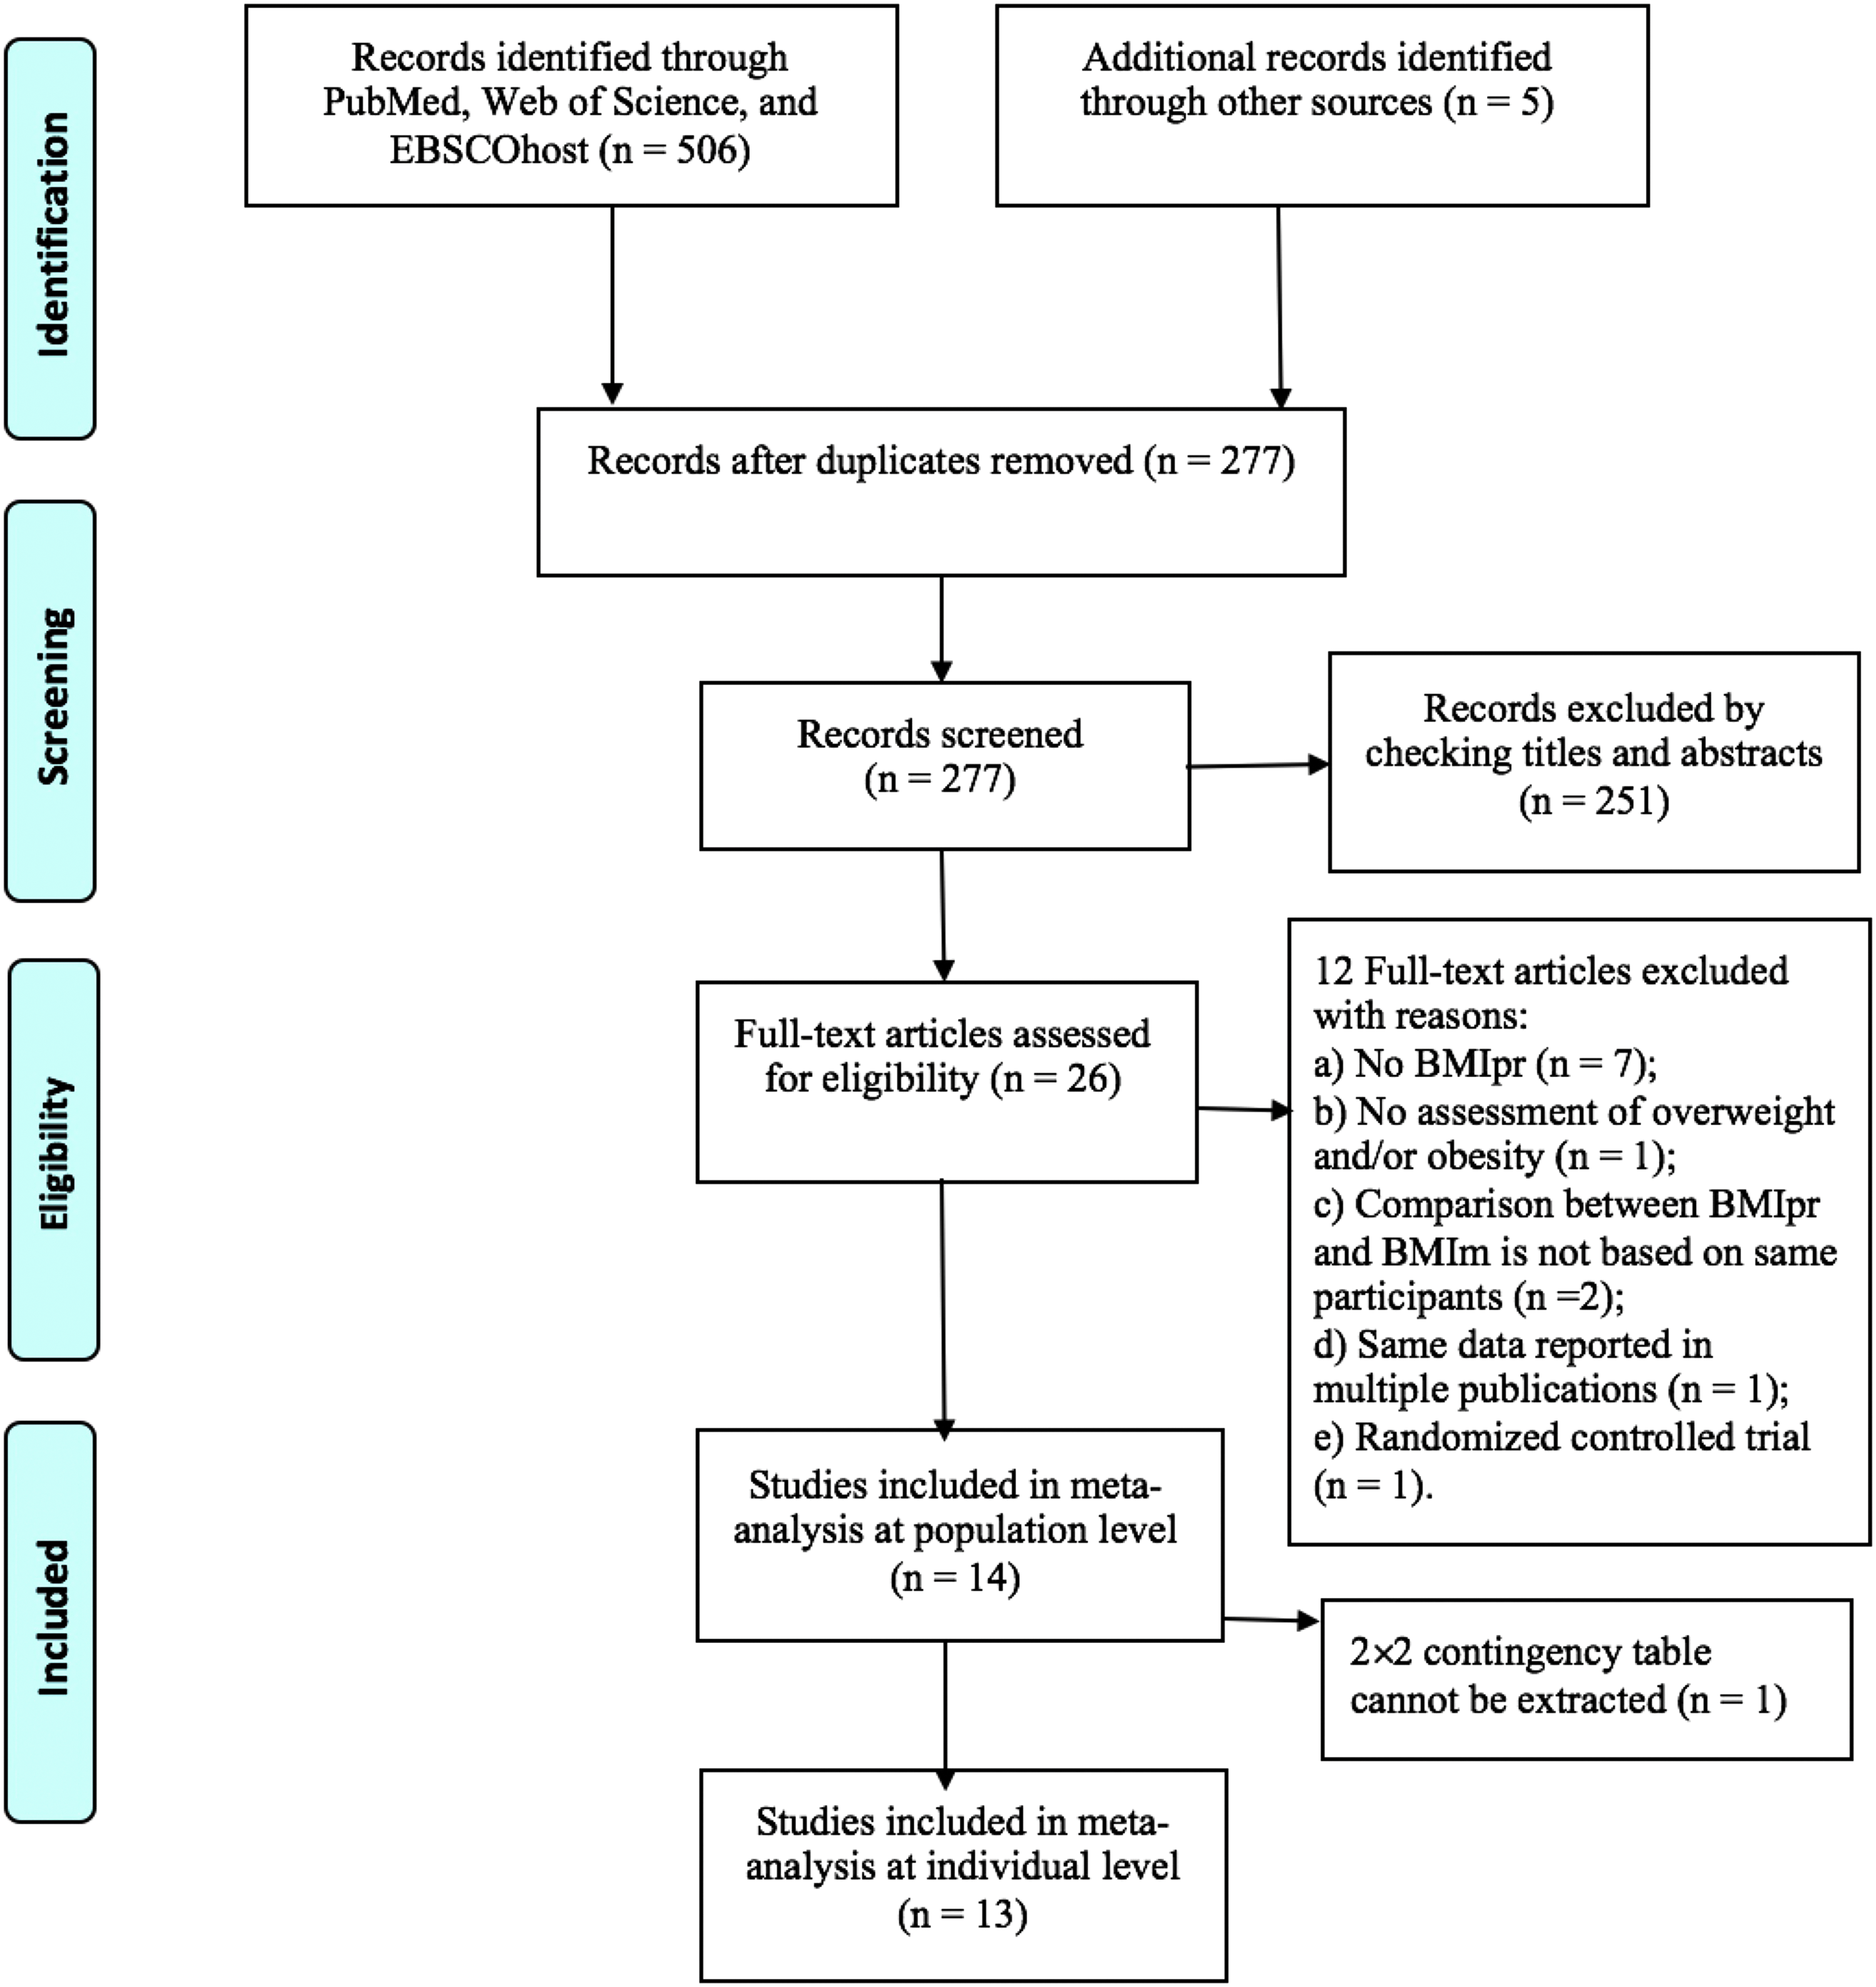
Flow chart of study inclusion.
Descriptive characteristics of the studies included
The 14 articles were published from 2001 to 2016, and the studies in these articles involved a total of 4939 children and adolescents, with their ages ranging from 1 to 17 years old. Moreover, it should be noted that 2 out of the 14 studies25,29 used two different weight status screening tools to screen children and adolescents with overweight and obesity; and 10 out of the 14 studies11,20,22,24,25,27–29,31,33 reported both the accuracy of using BMIpr for screening overweight (including obesity) and obesity, respectively. Therefore, the number of comparisons between BMIpr and BMIm was 28, which were used in the following data analysis. The summary of the characteristics of the included studies is outlined in Table 1.
Characteristics of Included Studies
The study concerning screening overweight. bThe study concerning screening obesity.
OWB, overweight (including obesity), OB, obesity; screening tools: IOTF, the International Obesity Task Force standard, WHO, the World Health Organization standard; PR, prevalence ratio; TP, true positive, FP, false positive, FN, false negative, TN, true negative.
Quality of the studies included
In terms of the QUADAS-2 tool, the quality is indicated by the risk of bias for each study in four domains. Specifically, in the current meta-analysis, the risk of bias in the patient selection domain was low in 12 studies included, whereas 2 studies27,30 showed an unclear risk of bias for patient selection owing to inadequately describing their sampling process. For the index test domain, as BMIpr was obtained prior to BMIm for all studies, risk of bias regarding the index test domain was low for all studies included. With respect to the reference standard domain, considering that all studies used BMIm as its reference, risk of bias regarding this domain was also low for all studies. Finally, for the flow and timing domain, 9 studies were considered having low risk of bias, whereas 5 studies22,24,27,29,30 were considered to have high risk due to the relatively long-time interval between BMIpr and BMIm in these studies. In summary, the overall low risk of bias in the four domains of the QUADAS-2 indicated that the quality of these studies was generally high. The details of the quality assessment are presented in Appendix Table A1.
Overall analysis
The forest plot of the PR for the studies included is shown in Figure 2. The pooled estimate PR was 1.118 (95% CI: 1.027–1.216, p < 0.01), with a significant Q statistic [Q(27) = 124.48, p < 0.01] and a relatively large I2 (78.31%). The findings from the overall analysis suggested: (1) BMIpr generally overestimated the prevalence of overweight and obesity among children and adolescents compared with BMIm; (2) a considerable amount of heterogeneity existed in these studies, pointing to the need for conducting moderator analyses. 51 Thus, in order to understand what factors might have contributed to the inconsistencies of the findings across the previous studies, subgroup analyses and meta-regressions were carried out.
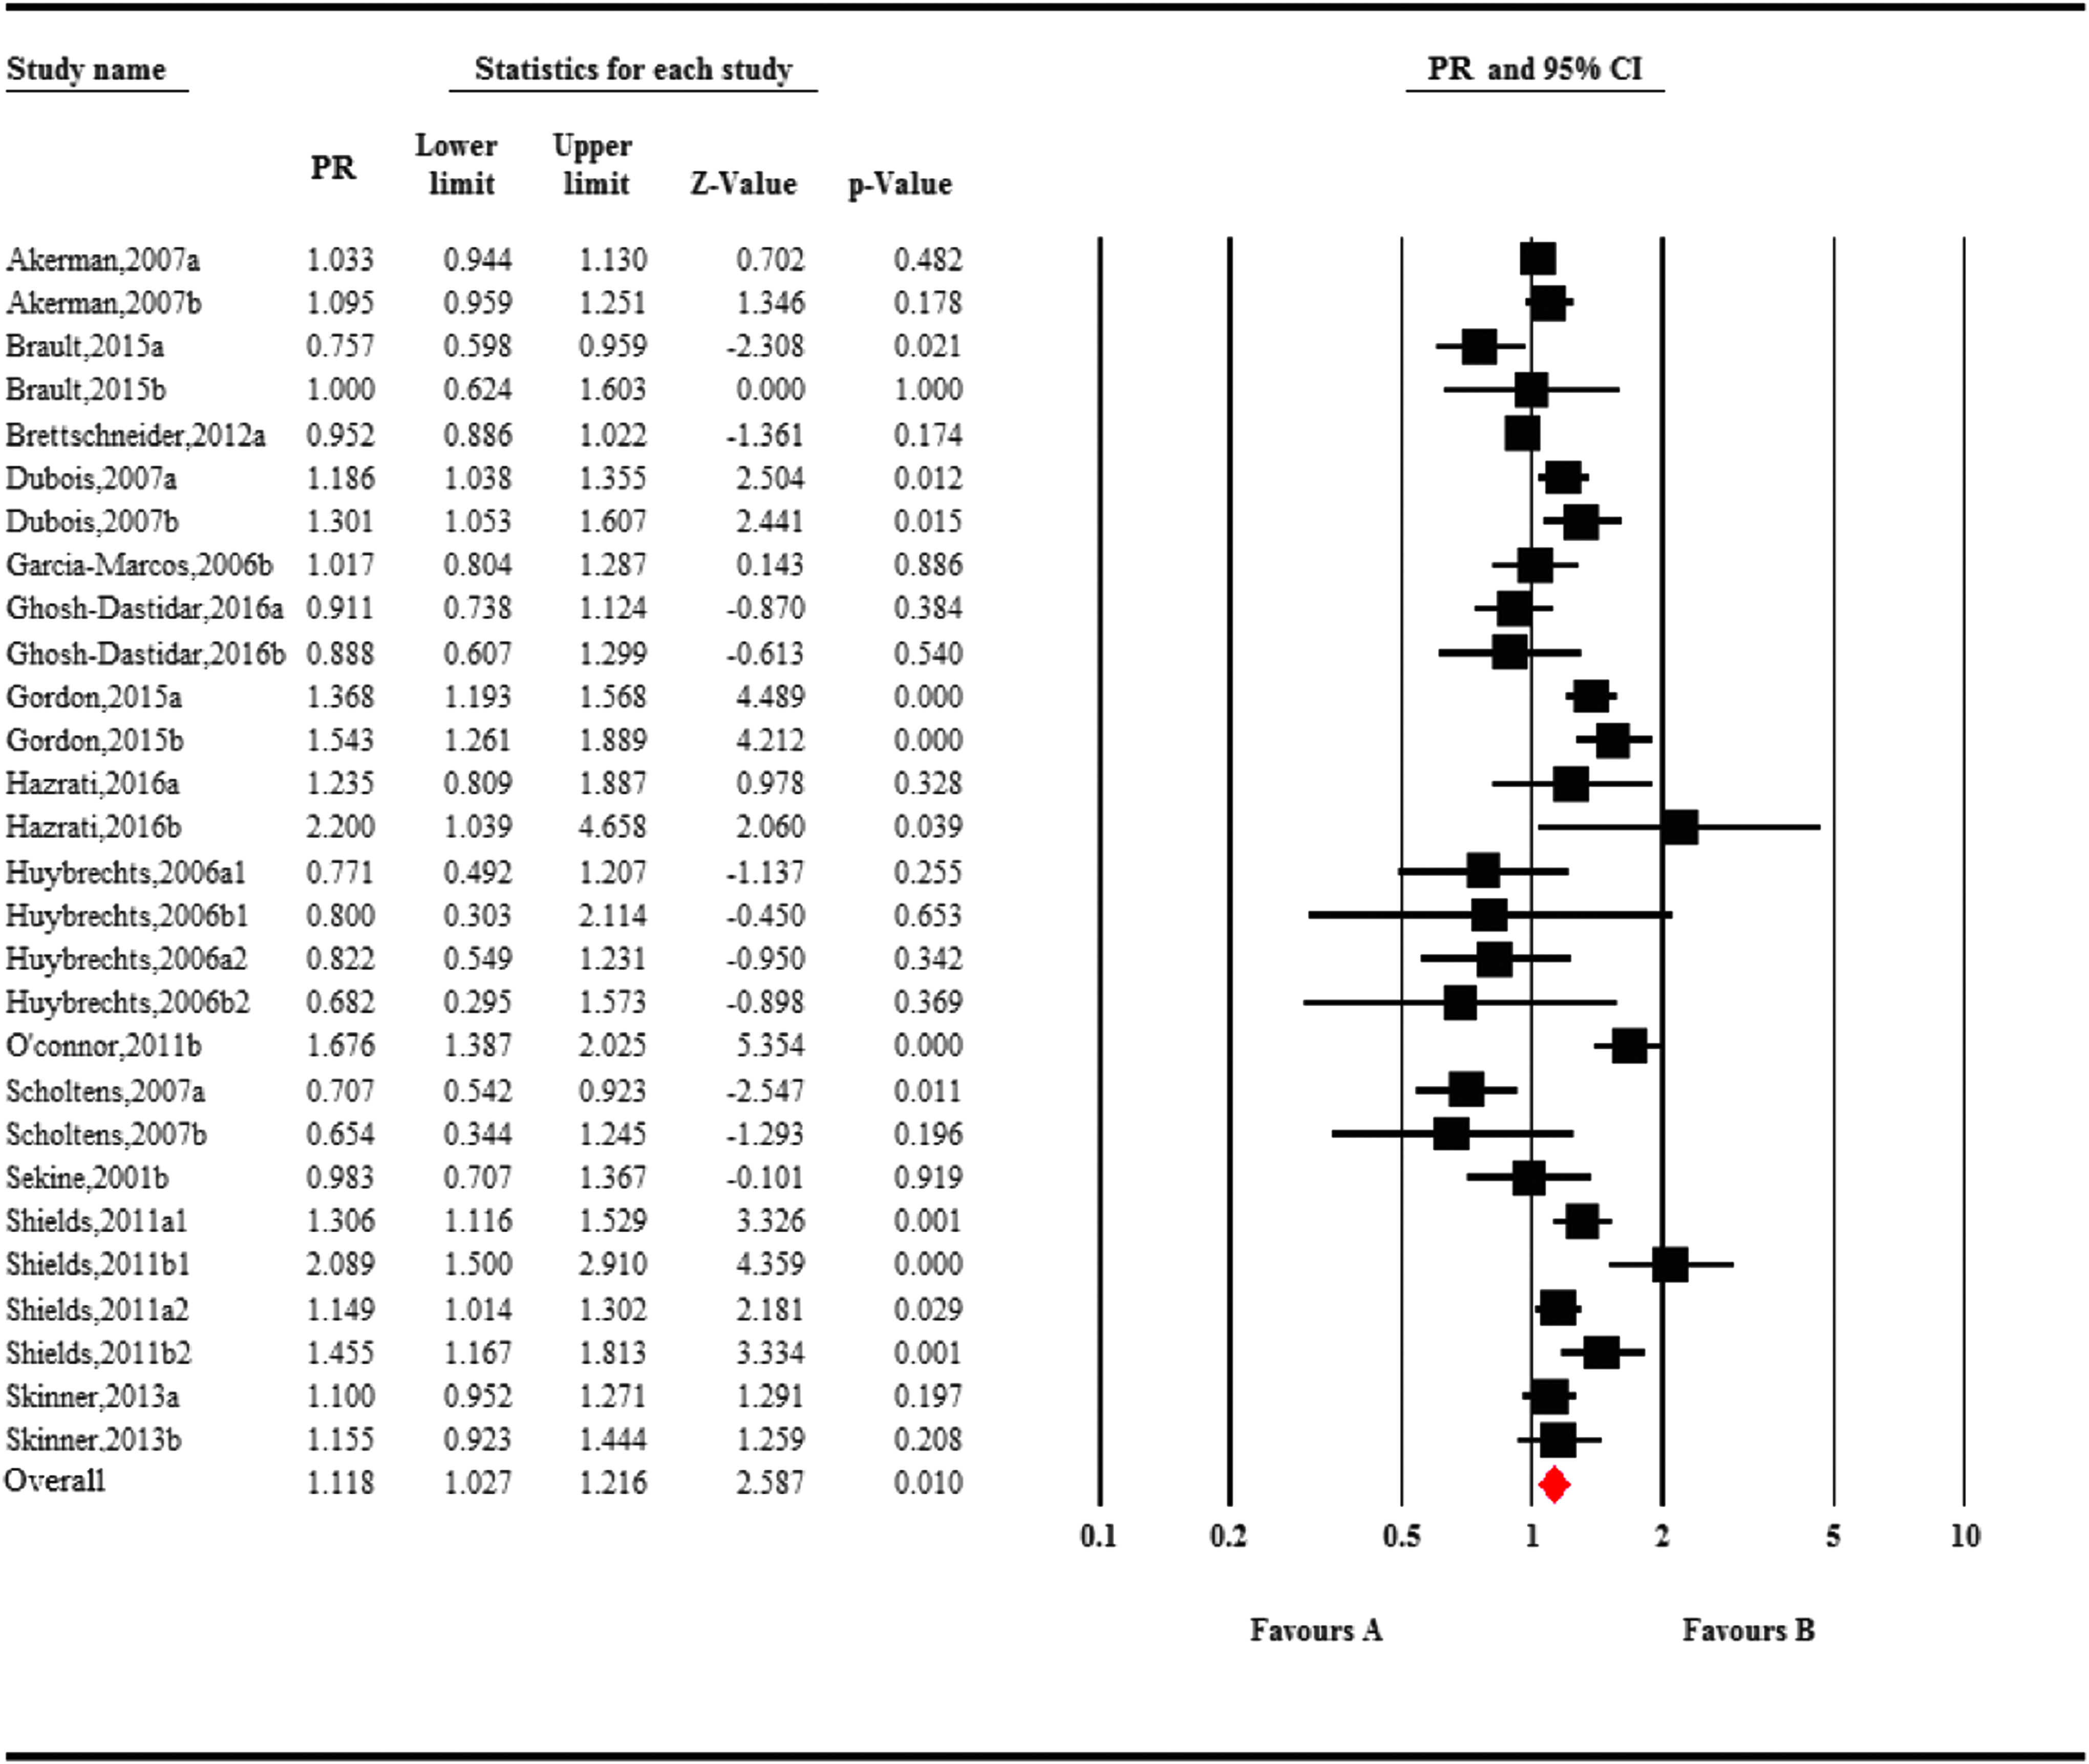
Forest plot for the meta-analysis at population level. CI, confidence interval; PR, prevalence ratio.aThe study concerning screening overweight. bThe study concerning screening obesity.
Subgroup analyses and meta-regressions
As shown by the results presented in Table 2, the moderator effect for regions was statistically significant, QB(2) = 19.734, p < 0.01, with a pooled PR estimate of 1.213 (95% CI: 1.107–1.328; p < 0.01) for North America (k = 19), 0.902 (95% CI: 0.821–0.991; p < 0.01) for Europe (k = 8), and 0.983 (95% CI: 0.707–1.367; p > 0.05) for Asia (k = 1). Specifically, based on the p-values for each subgroup, the pooled PR was statistically greater than 1 for North America, not statistically different from 1 for Asia, and statistically less than 1 for Europe.
Subgroup Analyses for the Prevalence Ratio Estimates
Overweight includes obesity.
k, number of studies; CI, confidence interval; QB, between-group heterogeneity statistic to test the effect of the moderator variable on the prevalence ratio.
The moderator effect for weight status screened was also statistically significant, QB(1) = 4.090, p < 0.05, with a pooled PR estimate of 1.034 (95% CI: 0.939–1.140; p > 0.05) and 1.232 (95% CI: 1.072–1.414; p < 0.01) for overweight (including obesity) (k = 13) and obesity (k = 15), respectively. Specifically, based on the p-values for each subgroup, the pooled PR was not statistically different from 1 for overweight screening and statistically greater than 1 for obesity screening.
The moderator effect for weight status screening tools was statistically significant, QB(3) = 19.516, p < 0.01, with a pooled PR estimate of 1.193 (95% CI: 1.076–1.324; p < 0.01) for CDC (k = 11), 0.981 (95% CI: 0.783–1.228; p > 0.05) for IOTF (k = 10), 1.303 (95% CI: 1.077–1.577; p < 0.05) for WHO (k = 4), and 0.945 (95% CI: 0.882–1.014; p > 0.05) for Nation-specific standard (k = 3). Specifically, based on the p-values for each subgroup, the pooled PR was statistically greater than 1 for CDC and WHO, not statistically different from 1 for IOTF and Nation-specific standard.
Furthermore, meta-regressions showed that neither the effect from gender (B = −0.037; 95% CI: −0.420–0.345) nor the effect from age (B = −0.002; 95% CI: −0.020–0.016) was statistically significant.
Publication bias
The funnel plot, Appendix Figure A1a, was visually symmetric. Moreover, both Begg's and Egger's tests were greater than 0.05 with p-values for Begg's test and Egger's test being 0.38 and 0.46, respectively, indicating that publication bias was less likely to be an issue for the meta-analysis at the population level.
Discussion
This meta-analysis focused on the accuracy of using parent-reported height and weight for estimating the prevalence of overweight and obesity among children and adolescents. Our results revealed that BMIpr generally overestimated the prevalence of overweight and obesity among children and adolescents compared with that from BMIm (PR = 1.118). Moreover, the accuracy differed by regions, weight status screened, and weight status screening tools.
Specifically, for regions where the studies were conducted, the pooled estimate PR for North America (PR = 1.213; p < 0.01) was higher than Europe (PR = 0.902; p < 0.01), indicating that the parent-reported data from North America generally overestimated the prevalence of overweight and obesity among children and adolescents, whereas parent-reported data from Europe tended to underestimate such prevalence. Thus, as previous studies have shown that the accuracy of BMIpr for estimating the prevalence of overweight and obesity among children and adolescents was different by race/ethnicity,11,16 cultural differences might exist. Furthermore, the pooled PR was 0.983 (p > 0.05) for Asia, but it should be noted that although PR close to 1 indicates more accuracy of using BMIpr for estimating such prevalence, our finding for Asia (i.e., no statistical difference to 1) is likely resulted from only one study in Asia included. Thus, its estimation should be considered as tentative, and more research is needed for investigating how accurate is using BMIpr in Asia countries for estimating the prevalence of overweight and obesity among children and adolescents.
Regarding the moderator effect of weight status screened, our results showed that the pooled PR estimate for estimating overweight (including obesity) was 1.034 (p > 0.05) which was lower than that for estimating obesity (PR = 1.232, p < 0.01). Moreover, considering that the pooled PR for overweight (including obesity) was not significantly different from 1, it seems that the prevalence estimation for overweight (including obesity) by BMIpr is generally accurate. Thus, future researcher may only consider using BMIpr for estimating the prevalence of overweight but not for the prevalence of obesity, as which is generally overestimated.
For the effect of weight status screening tools, the pooled PRs were significantly higher than 1 for WHO (PR = 1.303; p < 0.05) and CDC (PR = 1.193; p < 0.01), whereas the pooled PRs were not significantly different from 1 for IOTF (PR = 0.981) and Nation-specific standard (PR = 0.945). These findings indicated that the use of BMIpr tended to overestimate the prevalence of overweight and obesity when WHO and CDC were used, whereas it was relatively accurate when IOTF and Nation-specific standard were used. However, as the small number of studies using WHO (k = 4) and Nation-specific standard (k = 3) were included in the current meta-analysis, our findings for the comparisons among the weight status screening tools should be considered as tentative, and future confirmatory research is highly recommended.
For the effect of gender, our finding of no gender effect was consistent with one study, 22 but inconsistent with another study. 16 However, it should be noted that the study showing gender difference also reported that the gender effect was further moderated by age, that is, “overestimation of overweight prevalence using parent-reported data was greater for boys and persisted until older ages compared with girls.” 16 Thus, our finding of no gender effect could be a result of not considering the influence from age.
Furthermore, for the effect of age, our results also showed a nonsignificant effect, indicating that the accuracy of using BMIpr for estimating prevalence of overweight and obesity does not differ by age. However, according to two previous studies,16,23 the prevalence of overweight and obesity based on BMIpr gradually changed from overestimation to underestimation over the age span of 2–17 years. Thus, there might be a nonlinear relationship between age and the accuracy of using BMIpr for estimating prevalence of overweight and obesity, so it should be cautious to interpret our finding of no age effect.
Study 2: Meta-Analysis at the Individual Level
Methods
As the meta-analysis at the individual level (i.e., diagnostic meta-analysis) was to analyze the same literature from a different perspective (i.e., population level vs. individual level), there was a large overlap between the two meta-analyses in the methods section. Thus, for a more concise description for the method section of the meta-analysis at the individual level, only unique features of the meta-analysis at individual level were described in the following sections.
Literature search and selection criteria
The process of literature search at the individual level was the same as that for the meta-analysis at the population level. However, as a meta-analysis at the individual level (i.e., diagnostic meta-analysis) needs a 2 × 2 contingency table to be constructed from each of the studies included, one study 24 was deleted from the 14 studies included at the population level (Fig. 1) for its lack of sufficient information for this contingency table. Thus, 13 studies were finally used for the meta-analysis at the individual level.
Assessment of quality
The assessment of quality for meta-analysis at the individual level was same with the meta-analysis at the population level (Appendix Table A1).
Extraction of data
Except for the information extracted in the meta-analysis at the population level, a 2 × 2 contingency table for each study included was extracted for the meta-analysis at the individual level (Table 1). The 2 × 2 contingency table was constructed by the number of true positive (TP), the number of false positive (FP), the number of true negative (TN), and the number of false negative (FN). Specifically, in the context of the current meta-analysis, TP means that relative to the identification results based on BMIm, the number of overweight and/or obese participants is correctly identified as overweight and/or obese by BMIpr; FP means that the number of nonoverweight participants are falsely identified as overweight or obese by BMIpr; TN means that the number of nonoverweight and/or nonobese participants is correctly identified as nonoverweight and/or nonobese by BMIpr; and FN means that the number of overweight and/or obese participants is falsely identified as nonoverweight or nonobese by BMIpr.
Data analysis
As suggested by Šimundić, 52 the following measures of diagnostic accuracy were calculated for each of the studies included: the sensitivity [i.e., TP/(TP + FN)], specificity [i.e., TN/(FP + TN)], positive likelihood ratio [LR+; i.e., sensitivity/(1 − specificity)], negative likelihood ratio [LR−; i.e., (1 − sensitivity)/specificity], and diagnostic odds ratio [DOR; i.e., (TP/FN)/(FP/TN)]. Furthermore, a random-effects model 48 was used to calculate the pooled values of sensitivity, specificity, LR +, LR−, and DOR. The heterogeneity was assessed by the Q-statistic and the I2 statistic. 48 Publication bias was graphically displayed by a funnel plot and statistically assessed by Deeks' test, 53 which is specially designed for diagnostic meta-analysis for evaluating publication bias, with a p-value greater than 0.10 indicating no publication bias.
To explore the heterogeneity from potential moderator variables, subgroup analyses and meta-regressions were conducted for regions, weight status screening tools, weight status screened, gender (percentage of female), and age (mean age).
The meta-analysis at the individual level was conducted using the Meta-DiSc Version 1.4 (Clinical Biostatistics Unit, Ramón y Cajal Hospital, Madrid, Spain), which is specially designed for diagnostic meta-analyses. 54
Results
Overall analysis
Results showed that the pooled sensitivity was 0.713 (95% CI: 0.700–0.726), Q(25) = 253.21 (p < 0.01), I2 = 90.1%. The pooled specificity was 0.918 (95% CI: 0.915–0.922), Q(25) = 1066.98 (p < 0.01), I2 = 97.7%. The pooled LR+ was 9.315 (95% CI: 7.196–12.057), Q(25) = 623.98 (p < 0.01), I2 = 96.0%. The pooled LR− was 0.335 (95% CI: 0.289–0.388), Q(25) = 241.81 (p < 0.01), I2 = 89.7%. The pooled DOR was 29.847 (95% CI: 21.725–41.004), Q(25) = 300.46 (p < 0.01), I2 = 91.7%. The forest plots of sensitivity and specificity are presented in Appendix Figure A1b and c.
Subgroup analyses and meta-regressions
Results in Table 3 showed that the studies from North America had larger pooled sensitivity (0.746; 95% CI: 0.730–0.761) than those from Europe (0.647; 95% CI: 0.624–0.670), while the studies from North America had lower pooled specificity (0.879; 95% CI: 0.873–0.885) than those from Europe (0.955; 95% CI: 0.951–0.959). In addition, because there is only one study conducted in Asia, subgroup analysis at individual level could not be done for Asia.
Subgroup Analyses Based on Regions, Weight Status Screened, and Weight Status Screening Tools
Overweight includes obesity.
k, number of studies; LR+, positive likelihood ratio; LR−, negative likelihood ratio; DOR, diagnostic odds ratio.
Furthermore, the use of BMIpr for screening overweight (including obesity) showed similar pooled sensitivity (0.710; 95% CI: 0.695–0.725) to those for screening obesity (0.721; 95% CI: 0.696–0.745), whereas its pooled specificity (0.914; 95% CI: 0.909–0.919) was lower than that for screening obesity (0.925; 95% CI: 0.919–0.931).
Moreover, for weight status screening tools, CDC had the largest pooled sensitivity (0.755; 95% CI: 0.737–0.773), which was followed by WHO (0.716; 95% CI: 0.669–0.759), IOTF (0.694; 95% CI: 0.660–0.726), and Nation-specific standard (0.655; 95% CI: 0.630–0.680). The highest specificity was found for IOTF (0.953, 95% CI: 0.947–0.958), and it was followed by Nation-specific standard (0.949, 95% CI: 0.944–0.953), CDC (0.868, 95% CI: 0.859–0.875), and WHO (0.839, 95% CI: 0.818–0.858).
In addition, the results of meta-regressions for age (mean age) and gender (percent of female) showed that the effect from age was statistically significant (B = 0.222, p < 0.01), but the effect from gender was not (B = 0.032, p > 0.05).
Publication bias
The funnel plot, Appendix Figure A1d, was visually symmetric, and the p-value for Deeks' test was 0.46, which was greater than 0.10. Thus, publication bias was also less likely to be an issue for the meta-analysis at the individual level.
Discussion
The results for the meta-analysis at the individual level showed that the pooled sensitivity of using BMIpr for screening children and adolescents was moderate with a value of 0.713, whereas the pooled specificity was relatively high with a value of 0.918. Specifically, these overall results for sensitivity and specificity indicate that the use of BMIpr could accurately identify 71.3% the total number of children and adolescents who were actually overweight and/or obese, and it inaccurately missed 28.7% of the total number of children and adolescents who were actually overweight and/or obese. Moreover, the use of BMIpr could accurately identify 91.8% of children and adolescents who were not overweight/obese, but it inaccurately identified 8.2% of them as overweight and obese.
Furthermore, based on the results of the subgroup analyses and meta-regressions, similar to what has been found for the use of BMIpr at population level, the accuracy of BMIpr used at the individual level was also found to be differentiated by regions (North America vs. Europe), weight status screened (overweight vs. obesity), and weight status screening tools (CDC vs. WHO vs. IOTF vs. Nation-specific standard).
However, it should be noted that, unlike the findings related to age for the meta-analysis at the population level, the effect of age at the individual level was statistically significant, suggesting that the accuracy of using BMIpr at the individual level increased with the age of children and adolescents. This finding is consistent with previous studies reporting that obesity classification based on BMIpr was more accurate for children of older ages.11,26
General Discussion
In consideration of convenience and low cost, when BMIm is not feasible, BMIsr and BMIpr are two alternative measures for screening children and adolescents with overweight and obesity. In the current study, we systematically reviewed previous literature by doing two meta-analyses for exploring the accuracy of using BMIpr at both population and individual levels.
According to the results of the meta-analysis at the population level, we found that, in contrast to the use of BMIsr that underestimated the prevalence of overweight and obesity among children and adolescents (PR = 0.823), 15 the use of BMIpr tends to overestimate such prevalence (PR = 1.118). Thus, both BMIsr and BMIpr cannot replace BMIm for an accurate estimation of the prevalence.
However, it should be noted that for large-scale surveys aiming at monitoring the prevalence of overweight and obesity, BMIm may not be feasible in many situations. Thus, BMIsr and BMIpr might be inevitably used for surveillance studies in the future. Fortunately, as with BMIsr,9,15 the accuracy of BMIpr at the population level also varied by certain conditions (e.g., regions, weight status screened, and weight status screening tools). Thus, if BMIpr has to be used when BMIm is not feasible, the findings in the current meta-analysis at the population level can be considered for achieving a better estimation of the prevalence. Specifically, higher accuracy of using BMIpr for prevalence might be associated with Asia (in contrast to North America and Europe), overweight (in contrast to obesity), and IOTF and Nation-specific standard (in contrast to CDC and WHO).
With respect to the accuracy at the individual level, the use of BMIpr showed a pooled sensitivity and specificity of 0.713 and 0.918, respectively, in contrast to previous meta-analysis for BMIsr where a pooled sensitivity and specificity of 0.760 and 0.960 were observed, respectively. Thus, compared with BMIsr, the use of BMIpr was not only more likely to miss children and adolescents with overweight and obesity but also more likely to falsely identify normal children and adolescents as overweight/obese. Therefore, considering that its performance at the individual level is generally worse than BMIsr, the use of BMIpr at individual level may not be recommended.
In addition, it is worth noting that the regions and the weight status screening tools were somewhat confounded. For example, the CDC criteria were developed and mainly used in America. Thus, caution should be taken in interpreting our findings of both the regions and the weight status screening tools as the sources of the observed heterogeneity, and it could be possible that the regions, or the tools, or some combination of both were responsible for the observed heterogeneity in previous studies.
Finally, one main strength for a meta-analysis is the high statistical power in detecting statistical differences. However, under some circumstances, small differences that are found to be significant in a meta-analysis could not be clinically meaningful in practice. For example, the difference in specificity for overweight vs. obesity was statistically significant, but the difference was only 0.011 which might not be different enough for concern in practice. Thus, applied researchers should take this into consideration when applying the statistically significant findings in the current study that only showed small differences.
Limitation
It should be noted that the large heterogeneity was the main limitation for the present meta-analyses at both population and individual levels. Specifically, although several study characteristics have been found to have contributed to the heterogeneity (e.g., regions, weight status screened, weight status screening, age, and gender), some other potential factors reported among previous studies (e.g., socioeconomic status 22 ) were not considered because of insufficient information in the original studies.
Moreover, because it is better to have at least five studies at each level for subgroup analyses, 55 our findings concerning certain moderator variables should be considered as tentative; thus, caution is needed in interpreting the pooled estimates for Asia (k = 1), WHO (k = 4), and National-specific standard (k = 3) in the meta-analysis at the population level, as well as the pooled estimates for WHO (k = 2) and National-specific standard (k = 3) in the meta-analysis at the individual level.
Conclusion
In general, the use of BMIpr at the population level tends to overestimate the prevalence of overweight and obesity among children and adolescents, and its accuracy at this level differs by regions, weight status screened, and weight status screening tools. Considering that there are several large surveillance surveys using parent-reported height and weight, such as the National Health Interview Survey (NHIS), 56 the National Survey of Children's Health (NSCH), 57 and the National Longitudinal Survey of Children and Youth (NLSCY), 58 existing and future reports using these data should be interpreted in light of the biases associated with parent-reported data. Moreover, future researchers using BMIpr for prevalence estimation may consider the findings in the current study for achieving a better estimation of the prevalence. As for the use of BMIpr at the individual level, compared with BMIsr, it is not only likely to miss children and adolescents with overweight and obesity but also likely to falsely identify nonoverweight/nonobese children as overweight/obese; so its use at the individual level may be problematic and may not be recommended.
Footnotes
Author Disclosure Statement
No competing financial interests exist.
Assessment of Risk of Bias for the Studies Included by QUADAS-2
| Risk of bias | ||||
|---|---|---|---|---|
| Study | Patient selection | Index test | Reference standard | Flow and timing |
| Akerman, 2007 | Low | Low | Low | Low |
| Brault, 2015 | Low | Low | Low | Low |
| Brettschneider, 2012 | Low | Low | Low | Low |
| Dubois, 2007 | Low | Low | Low | High |
| Garcia-Marcos, 2006 | Low | Low | Low | Low |
| Ghosh-Dastidar, 2016 | Low | Low | Low | Low |
| Gordon, 2015 | Low | Low | Low | Low |
| Hazrati, 2016 | Low | Low | Low | High |
| Huybrechts, 2006 | Low | Low | Low | Low |
| O'connor, 2011 | Low | Low | Low | Low |
| Scholtens, 2007 | Unclear | Low | Low | High |
| Sekine, 2001 | Unclear | Low | Low | High |
| Shields, 2011 | Low | Low | Low | High |
| Skinner, 2013 | Low | Low | Low | Low |
A revised tool for the quality assessment of diagnostic accuracy studies.