
Abstract
Background:
Failure to recognize children's overweight status by parents may contribute to children's risk for obesity. We examined two methods of measuring mothers' perceptions of children's weight and factors associated with weight perception inaccuracy.
Methods:
Cross-sectional analyses of clinical and self-report data from 287 Mexican-heritage mother–child dyads. Mothers identified their child's weight category using a scale (e.g., “normal/overweight/obese”) and a visual silhouette scale (11 child gender-specific weight-varying images). Children's height and weight were measured to calculate body mass index (BMI). Chi-square tests examined associations between categorical, silhouette, and BMI percentile categories of children's weight. Bivariate logistic regression analyses examined factors associated with mothers' inaccuracy of their children's weight.
Results:
Only 13% of mothers accurately classified their child as obese using the categorical scale, while 78% accurately classified their child as obese using the silhouette scale. Mothers were more likely to underestimate their child's weight using BMI categories (62%) compared to using the silhouette scale (23%). Predictors of mothers' underestimation using the categorical method were child sex [female] (adjusted odds ratio [AOR] = 1.99; 95% CI: 1.02–3.86), child age [younger age] (AOR = 10.39; 95% CI: 4.16–25.92 for ages 5–6 years), and mother's weight status (overweight AOR = 2.99; 95% CI: 1.05–8.51; obese AOR = 5.19; 95% CI: 1.89–14.18). Child BMI was the only predictor of mothers' overestimation (AOR = 0.89; 95% CI: 0.85–0.94) using the silhouette method.
Conclusions:
Using silhouette scales to identify children's body weight may be a more accurate tool for clinicians and interventionists to activate parents' awareness of unhealthy weight in children compared to using traditional categorical weight-labeling methods.
Introduction
Hispanic/Latino children are disproportionally affected by obesity in the United States.1–4 Youth of Mexican and Puerto Rican heritage experience the fastest increases in weight compared to other Hispanic/Latino (hereafter referred to as Hispanic) subpopulations.5,6 Approximately 39% of youth of Mexican heritage, aged 2–19 years, are overweight or obese vs. 29% of non-Hispanic white youth. 7 High rates of obesity among youth of Mexican heritage raise concerns about the current and future chronic disease burden among this growing population.8,9 Youth with overweight are at increased risk for obesity-related comorbidities, including elevated blood pressure, dyslipidemia, fatty liver disease, obstructive sleep apnea, 10 and psychological distress. 11 Moreover, these risk factors may track into adulthood and increase risk for cardiovascular disease such as high blood pressure, dyslipidemia, impaired glucose tolerance, and vascular abnormalities. 12
Overweight in youth of Mexican heritage represents a significant health disparity that needs to be addressed through effective and culturally tailored prevention efforts targeting multilevel factors that influence children's weight. Evidence supports that parents (or caregivers) play an integral role in their children's weight.9,13–15 Parents are responsible for structuring their children's home environment and daily lifestyles 16 and, thus, can shape their children's eating and physical activity behaviors.17–19 However, despite public health efforts to raise awareness regarding obesity, parents of children with overweight often fail to recognize their children with overweight or obesity. 20 Among Hispanics, sociocultural factors play an important role in obesity-related attitudes and behaviors.4,21–23
Consistent evidence indicates that parents from Hispanic heritage tend to underestimate their children's weight and do not correctly identify their children to be overweight.9,24 Studies show that Hispanic mothers perceive bigger children as healthy or at the perceived ideal weight20,25 and, conversely, see thinner children as undernourished.21,26 Underestimating a child's weight may lead to a failure in ameliorating weight-related risk factors such as poor monitoring of food intake and lack of encouragement for physical activity from parents.9,27
In a recent systematic review regarding parental perceptions of children's weight, underestimation ranged from 28% to 100% among 13 studies; of those, 6 of the 13 studies reported that more than 70% of parents underestimated the weight of their children with overweight. 27 However, only one study 26 focused primarily on perceptions of Mexican-heritage parents. Given the diversity of different Hispanic subpopulations, more research is needed to examine weight and weight perceptions among individuals from Mexican heritage.
A parents' ability to accurately recognize their children's weight status can vary by certain parent and child characteristics. Hispanic parents of normal weight, with higher educational attainment, who speak English at home, and who have lived in the United States for more than two generations are more likely to identify the correct weight status of their children. 28 As for children's characteristics, a meta-analysis of studies worldwide suggests that there may be a difference in the way parents define their children's weight based on age and sex. 29 As children get older, parents are more likely to express concern and initiate conversations about weight management.30–32 In a study of 80 Hispanic (predominantly Mexican) children, 60% of mothers of young children with overweight (5–6 years old) did not recognize their child as overweight. 33 When examining sex differences among Mexican families, boys are less likely to be identified with overweight compared to girls.26,32
It is important to consider parental perceptions regarding their children's weight, as they can help understand a family's readiness to modify the children's environment and lifestyle to prevent obesity.4,14,33,34 Studies demonstrate that parental recognition of their children's overweight or obese status and knowledge about health consequences related to overweight are associated with parental readiness and motivation to make changes to curb their children's weight gain.20,28,35 Changing inaccurate perceptions, such as underestimation of weight, can be an important strategy for research interventions aiming to improve children's weight status among Mexican-heritage families. 25
The best method to measure parental perceptions of their children's weight is not yet established. Current methods include verbal descriptions (selecting a weight category),28,33,34,36–38 selecting from a range of figures/silhouette (visual) scales,26,34,39–41 as well as self-report of body mass index (BMI). 13 Measurement scales often include categorical options and require parents to label their children as “underweight,” “normal weight,” “overweight,” “obese,” or other similar categories. This method does not distinguish the body image, type, or shape that the respondents associate with the selected weight category.18,36
Evidence suggests that parents may avoid labeling their children as overweight or obese, especially at a younger age. 41 Age- and sex-specific visual sketches have been found to be potentially more accurate. One study among parents of children 2–17 years old (35% Hispanic) found that even when parents do not select the correct weight category for their children, they may select a correct silhouette to describe their child's body structure. 33 These findings show promise and should be explored among Mexican-heritage parents to inform future prevention efforts. Therefore, the present study aimed to: (1) evaluate two different methods of measuring mothers' perceptions of their children's weight to assess which method is most accurate compared to the child's measured BMI percentile and (2) identify mother and child characteristics associated with mothers' inaccuracy of their child's weight status.
Methods
Study Population
This study was a cross-sectional analysis of baseline data obtained from the Luces de Cambio study, a clinic-based randomized controlled trial. 42 Study participants were primarily first and second generation Mexican-heritage pediatric patients and their parents (or caregivers). Children were between the ages of 5 and 10 years and identified as at-risk for overweight (≥75th percentile), overweight (≥85th percentile), or obese (≥95th percentile). Other eligibility criteria included having had at least one visit to the clinic within the previous 24 months; self-identifying as Hispanic/Latino; and having the ability to read Spanish or English.
Written adult consent and child assent were obtained from participants before enrollment. After enrollment, participants completed baseline assessments, which involved an interviewer-led parent survey completed in the parent's preferred language and parent and child anthropometric measures (i.e., “height” and “weight”) using National Health and Nutrition Examination Survey (NHANES) III Anthropometric Procedures. 43 Trained and bilingual staff collected survey and anthropometric measures. The Luces de Cambio study methods have been published elsewhere. 42 All study procedures were reviewed and approved by the Institutional Review Board at San Diego State University.
Measures
Parental perceptions of child's weight
Perceptions of weight were assessed using two methods: (1) selection of a weight category and (2) selection of one silhouette from a range of 11 figures. Data for the first method, selection of a weight category, were obtained using one survey item asking parents to identify their child's current weight status (“Describe your child's current weight”). Parents were provided with five response options in English (1) markedly underweight, (2) underweight, (3) normal weight, (4) overweight, and (5) markedly overweight or Spanish (1) notablemente bajo de peso (2) bajo de peso (3) peso normal (4) pasado/a de peso and (5) notablemente pasado/a de peso.
For analyses, response options one (1) and two (2) were combined as “underweight.” Data collected with this categorical item were also used to compute one new variable by comparing the parent's selected category to their child's study measured BMI percentile weight category. The variable included three options as follows: (1) accurate, (2) inaccurate underestimated, and (3) inaccurate overestimated.
The second method involved parents selecting one silhouette from a visual scale. The scale was created using computer graphics based on pictures of human models of corresponding BMIs. The graphic artist followed methodological recommendations on contour drawing composition from Gardner's et al. 44 to develop two sets of cards, one set for adults (test–retest r = 0.84, p < 0.01) and one set for children (test–retest r = 0.61, p < 0.01). 45 The children's set includes 22 silhouettes (11 for each gender) presented in separate cards (dimensions 12.5 × 6.5 cm) ranging from underweight to obese models.
Parents were presented with the 11 cards corresponding to their child's gender, asked to look at the silhouettes, and to point at the silhouette that they felt most accurately represented their child's current body type (recorded as perceived silhouette-based weight). The card number selected was recorded, as well as corresponding BMI for that specific silhouette. The silhouettes were designed to fit within a BMI range listed on the back of each card. The BMIs recorded were entered to the Centers for Disease Control and Prevention's (CDC) online BMI calculator to determine the child's BMI percentile for comparison with child's study measured BMI percentile. Based on accuracy, a new variable was created; the variable included three options as follows: (1) accurate, (2) inaccurate underestimated, and (3) inaccurate overestimated.
Body mass index
Child and parent BMI (kg/m2) were calculated using height and weight measurements and then classified using the 2000 CDC Growth Charts for children: normal weight (5th to <85th), overweight (85th to <95th), and obese (≥95th), and adult age- and sex-specific categories: underweight (<18.5), normal weight (18.5–24.9), overweight (25.0–29.9), and obese (30.0 and above). 46
Demographic characteristics
The interviewer-administered surveys included questions concerning the characteristics of parents and children. Children's demographic characteristics included: age, gender, and country of birth. Parent's demographic characteristics included: age, sex, country of birth, language preference, and highest educational level.
Statistical Analyses
Descriptive statistics was used to summarize child and parent demographic characteristics, as well as weight status. Chi-square and Fisher's exact tests were used to compare children's measured BMI percentile categories (i.e., “normal,” “overweight,” “obese”) with parents' selected weight category (i.e., “underweight,” “normal weight,” “overweight,” “markedly overweight”). Chi-square and Fisher's exact tests were also used to compare silhouette-derived weight categories (i.e., “underweight,” “normal,” “overweight,” “obese”) with study measured BMI percentile categories. After comparison with actual BMI percentile categories, Chi-square Fisher's exact test was used to evaluate accuracy between the mothers' selected child weight categories and silhouette-based weight categories.
Bivariate logistic regression analyses were used to examine the association of child (age, gender, BMI percentile) and mother (educational level, BMI) characteristics to mothers' inaccurate (underestimation) perceptions of their children's weight. For model 1, the dependent variable was accuracy of perception based on weight categories. The original variable included three levels: (0) inaccurate-underestimated, (1) accurate, and (2) inaccurate-overestimated, given that only three percent of mothers overestimated (10 of 287); the analytic sample was restricted to only include (0) inaccurate-underestimated and (1) accurate. The outcome of interest was inaccurate-underestimated, and the reference category was accurate.
For models 2 and 3, bivariate logistic regression was used to examine the association of the child and mother characteristics with (1) inaccurate-underestimated child's weight and (2) inaccurate-overestimated child's weight based on the silhouette scale, with accurate being the reference category. Child BMI category was not included as predictor in the models due to small cell sizes, which yielded unreliable parameter estimates. Instead, child BMI was entered as a continuous predictor variable in the models. Statistical analyses were performed using SPSS (version 25).
Results
Baseline Characteristics
A total of 297 children and their parents participated in the Luces study. Recruitment and retention details are reported elsewhere. 42 Nine male parents were excluded from the present analyses due to being few in number, leaving an analytic sample size of 287 children and their mothers (total participants 574 included for analysis). Sociodemographic characteristics of the study sample are shown in Table 1. The majority of mothers were Spanish speakers (93.4%) and born in Mexico (68.3%). The mean BMI for mothers was 32.0 (standard deviation [SD] = 6.8), and the majority were classified as overweight (30.9%) or obese (57.5%). As for children, the mean age was 8.1 (SD = 1.5), and half of the sample was male (50.5%). Children's weight categories were as follows: normal weight (16.7%), overweight (39.0%), or obese (44.3%).
Sociodemographic Characteristics of Mother–Child Dyads Enrolled in the Luces de Cambio Study (n = 287)
Centers for Disease Control and Prevention (CDC)-based weight categories for child age and sex.
BMI, body mass index; SD, standard deviation.
Mothers' Perception of Their Child's Weight
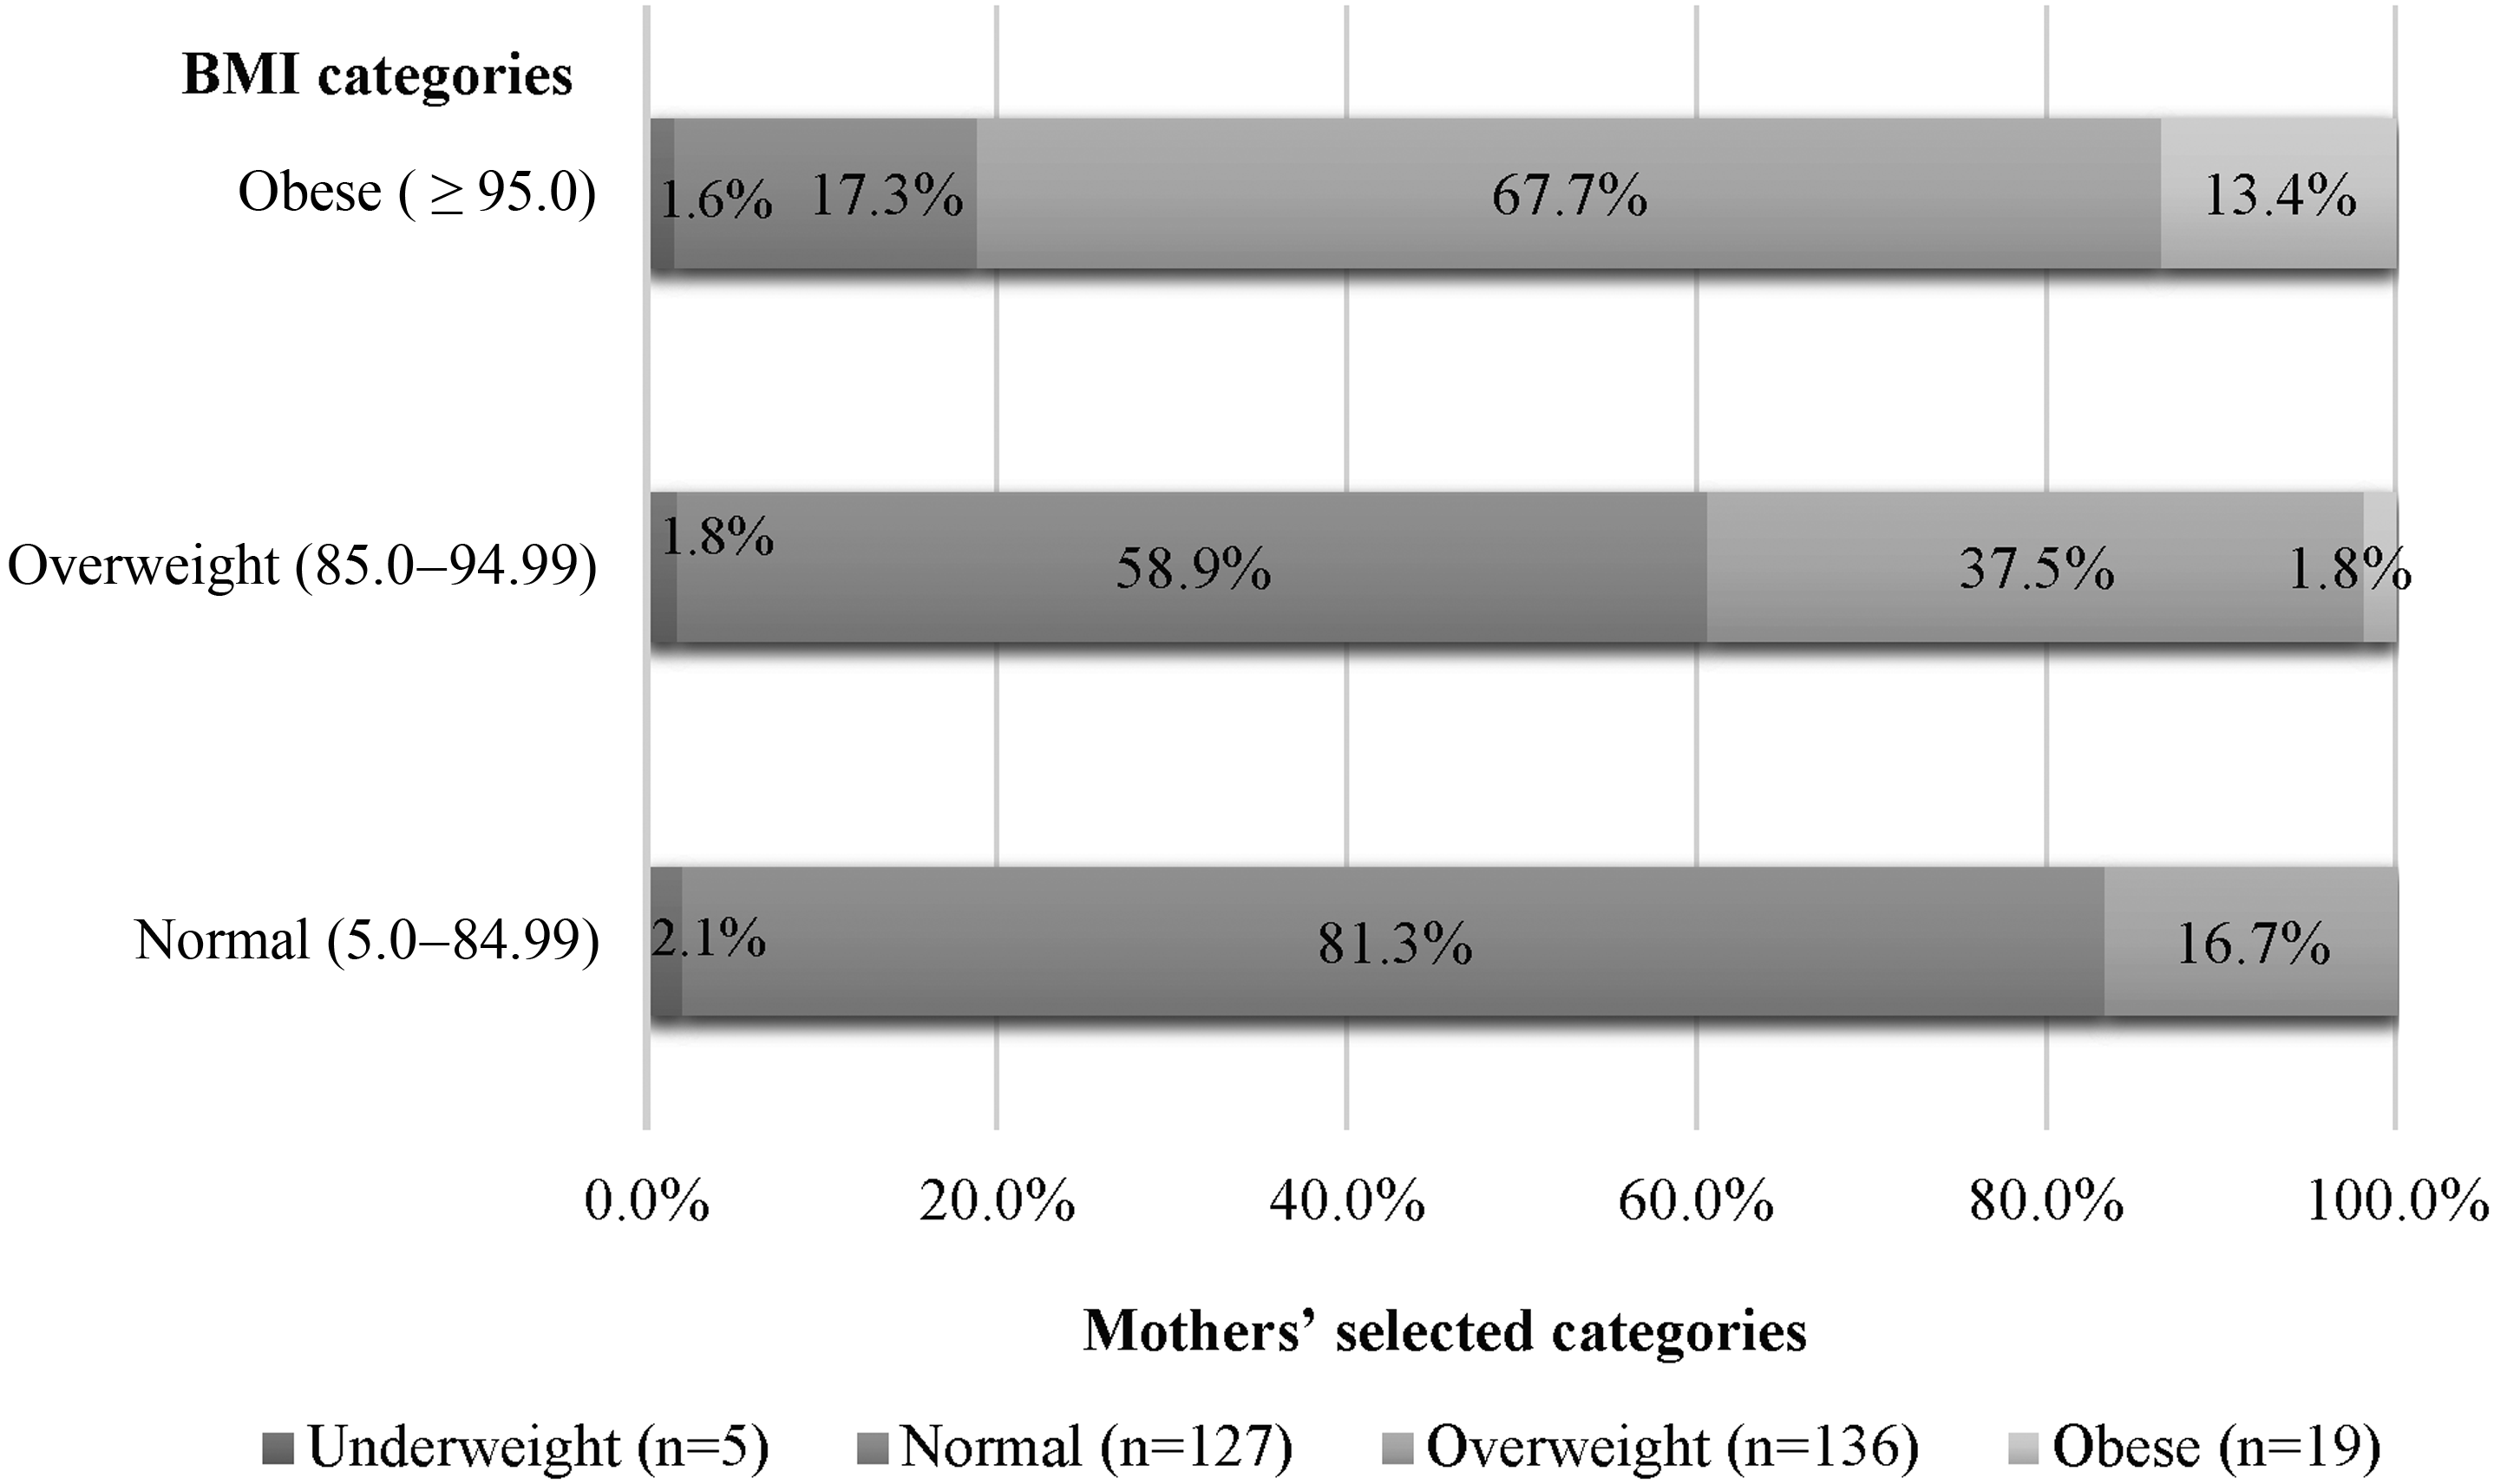
Figure 1 shows the comparison between the child's measured BMI percentile-based weight categories and mother's selected weight categories. Only 13.4% of mothers accurately identified their child as obese, and 37.5% of mothers of children with overweight accurately identified their child as overweight. Figure 2 shows the comparison between the child's study measured BMI percentile-based weight categories and mother's selected silhouette-based weight categories. Using the silhouette method, 78% of mothers of children with obesity accurately identified their child as obese. A comparison of accuracy between the two methods is shown in Figure 3. Among the mothers who underestimated by selecting weight categories, 60.3% accurately identified their child's weight using the silhouettes.


Results of logistic regression of predictors of inaccuracy for the two methods are shown in Table 2. In model 1, using the categorical method, in adjusted bivariate logistic regression, mothers were more likely to underestimate their children's weight if their child was female (adjusted odds ratio [AOR] = 1.99), younger between the ages of 5–6 years old (AOR = 10.39), and ages 7–8 years old (AOR = 3.87) compared to older children ages 9–10 years old. Furthermore, mothers of children with higher BMI percentile (AOR = 1.32) or who were overweight (AOR = 2.38) or obese (AOR = 2.74) had greater odds of underestimating their child's weight compared to underweight/normal weight mothers. In model 3, using the silhouette scale, mothers of children with a greater BMI percentile had lower odds of overestimating their child's body weight (AOR = 0.89). There were no other significant demographic predictors of parents' inaccuracy (under or overestimation) using the silhouette-based method.
Bivariate Logistic Regression to Examine Sociodemographic Factors Influencing Accuracy of Mothers' Perception of Their Child's Weight Based on Categorical and Silhouette Based Weight Categories
Model 1: dependent variable is perception of weight based on categorical variable (reference category = accurate); includes child's age, gender, BMI percentile, parent's educational level, and BMI. The child's BMI percentile was included instead of BMI categories due to small sample size.
Models 2 and 3: dependent variable is perception of weight based on figure scale (ref = accurate); includes child's age, gender, BMI percentile, parent's educational level, and BMI. The child's BMI percentile was included instead of BMI categories due to small sample size.
p < 0.05; **p < 0.01.
CI, confidence interval; OR, odds ratio.
Discussion
Recognizing children's overweight/obesity status and the health risks associated with excess weight may motivate parents to modify their children's lifestyle. The first aim of the study was to examine two different methods of measuring parent's accuracy of children's weight among a sample of primarily Mexican-heritage mothers. Our findings show that accuracy differed by the method used. Specifically, mothers were more likely to underestimate their child's actual weight when they selected a weight category (i.e., “underweight,” “normal,” “overweight,” and “obese”) compared to when they selected a silhouette to depict their child's body type. These results are consistent with previous studies that show that parents underestimate their child's weight when selecting a category, especially among children with obesity. 41 Based on previous research among Hispanic parents, a possible explanation for greater underestimation using weight categories may be due to the mother's resistance to label her child as “obese” or “overweight” as these labels are often associated with negative stereotypes among this population and may lead to the parent feeling guilty or at fault for their child's weight. 47 Furthermore, research suggests that mother's may perceive their children with overweight or obesity as “normal” weight as they may not look considerably different from other children in the family or in their age group. 48
In this study, mothers were more likely to accurately select a body type that depicted their child's current weight even if the silhouette was depicting an “overweight” or “obese” weight status when presented with a range of silhouettes that corresponded to varying BMI. This finding is consistent with another study that found child sketches are a more sensitive way of assessing a child's weight than using weight categories. 33 The silhouette method may result in greater accuracy given that the image is not coupled with a negative weight-based label, which may deter the parent from selecting a silhouette that may be labeled as obese. It seems that the silhouettes offer a more nuanced range of weight categories (11 figures) that can allow the parent to be more precise with how they perceive their child's body type without associating the body type with a “label.” However, without proper counseling or health education about recommended weight, parents may go without recognizing their children's overweight status.
The second aim of the study was to identify mother and child characteristics associated with mothers' inaccurate perceptions of their children's weight. In this study, using the categorical weight perception method, the child's age (younger) predicted inaccuracy using the categorical weight scale when controlling for maternal education level and BMI. These findings are in agreement with previous studies noting that parents are more accurate with their child's weight when their child is older,30,32 as parents are more likely to express concerns about weight as children age.
In contrast to previous research, mothers were more likely to underestimate their female child's weight in this study. In other studies among Hispanic/Latino parents, researchers found that parents were more likely to monitor their daughters' weight and other activities (i.e., “afterschool activities”) and were less likely to monitor the weight of their sons due to cultural norms related to gender.49,50 Interestingly, only BMI percentile was associated with parent accuracy derived from the silhouette method. It is possible that the sample size may have limited the ability to detect statistically significant associations in this analysis. Alternatively, the findings show that mothers are able to describe their child's body type when not associating the body type with a weight label, and therefore, predictors such as age, education, and mother's BMI would not influence accuracy.
Limitations
There were several limitations that affect the generalizability of the study findings. The cross-sectional design of this study limits conclusions regarding causality. Furthermore, the study findings cannot be generalized to all Hispanic/Latino heritage groups. Participants in this study were primarily of Mexican heritage residing in the U.S./Mexico border region. In addition, the weight perception accuracy reported in this study is that of Mexican-heritage mothers and may not reflect perceptions of fathers or male caretakers. Another limitation is the differences in the two methods used to examine accuracy as they are unable to be directly compared. One method uses weight categories with wording that is often received negatively, while the other uses body silhouettes with no wording to describe the silhouettes. Despite the limitations, this study contributes to the gaps in research related to perceptions of weight among mothers of Mexican heritage. Furthermore, this study adds to the current literature regarding limitations of using weight categories among Mexican-heritage mothers and the potential utility of using silhouettes as a starting point to conversations regarding recommended child weight. Furthermore, the study allowed for comparison of two survey methods with measured BMI percentile categories.
Implications
The results of this study showed that, among Mexican-heritage mothers, the majority underestimated their child's weight using a categorical method or “labeling”; however, the majority of mothers accurately selected their child's body type after using the silhouette method. Further research is needed to understand parent's opinions of weight labels, whether they perceive the labels as negative, and the possible reluctance of parents to assign a label to their child's weight, especially when it is the label of overweight or obese.51,52 Given that Mexican-heritage mothers were more likely to select their child's accurate body type with the silhouettes, future intervention studies, as well as clinicians, should consider using silhouettes to discuss recommended weight for children to motivate parents to make positive lifestyle changes.
Footnotes
Acknowledgments
The authors thank the Luces de Cambio project staff at the Institute for Behavioral and Community Health at San Diego State University, the clinic staff at the federally qualified health center, and the participants for their valuable contributions to this study.
Funding Information
The Luces de Cambio study was supported by grant no. R01 DK084331 from the National Institute of Diabetes and Digestive and Kidney Diseases (NIDDK).
Author Disclosure Statement
No competing financial interests exist.
The views expressed in this article are the author's own and do not reflect the views of the National Institute of Diabetes and Digestive and Kidney Diseases (NIDDK) or affiliated institutions.