
Abstract
Abstract
Background:
Differences in weight status by socioeconomic position occur during adolescence and is known as weight social gradient (WSG). The PRALIMAP (Promotion de l'ALIMentation et de l'Activité Physique) trial highlighted that a universal intervention was effective in reducing overweight and obesity prevalence among adolescents. However, its ability to reduce the WSG is unclear. This study aimed to evaluate the impact of the PRALIMAP intervention on the WSG among adolescents.
Methods:
Data were obtained from 3504 adolescents who participated in the school-based PRALIMAP trial between 2006 and 2009. The PRALIMAP study consisted of three interventional strategies: educational, environmental, screening and care. Weight status was assessed by body mass index (BMI) z-score and overweight and obesity prevalence. The “indice de position sociale des élèves” was used to measure adolescents' socioeconomic status. Linear regression and hierarchical models were used to assess the WSG and its evolution, respectively.
Results:
Among all adolescents (14–18 years old), significant WSG was identified at baseline: BMI z-score (β = −0.06; p < 0.0001), overweight and obesity prevalence (β = −2.86; p < 0.0001). Overall, the intervention conferred no significant reduction in the WSG: BMI z-score (β = −0.01 [−0.02 to 0.01], p = 0.48), overweight and obesity prevalence (β = −0.01 [−0.07 to 0.05], p = 0.73). Similar results were observed for adolescents whatever the interventional strategy they benefited from in the PRALIMAP trial.
Conclusions:
This study provided no evidence that the PRALIMAP universal intervention was effective in reducing the socioeconomic inequalities in weight status among adolescents. Different interventions that account for social differences should be considered to tackle these inequalities.
Background
Overweight and obesity among adolescents have become major global public health concerns. The worldwide prevalence of overweight and obesity has substantially increased during the past three decades. 1 In France, the overweight and obesity prevalence among children and adolescents is estimated at ∼17%. 2 Adolescents who are overweight or obese are more likely to continue to have obesity into adulthood and are at risk of several diseases such as diabetes, cardiovascular diseases, and certain forms of cancer.3–5
In high-income countries, low socioeconomic status (SES) has been identified as strongly related to overweight and obesity prevalence.6,7 The highest rates are observed among the lowest socioeconomic groups, which increases their risk of morbidity and mortality. This observation reflects socioeconomic inequalities in weight status, which concern all socioeconomic groups, not just a particularly disadvantaged socioeconomic group, and follow a weight social gradient (WSG). 8 That is, overweight and obesity prevalence linearly decreases with increasing SES.8,9
Recent studies suggested that the rapid increase in overweight and obesity prevalence among adolescents has plateaued, but socioeconomic inequalities in weight status are persistent or still increasing during this phase of life.10–12 For example, a French study highlighted no significant evolution of overweight and obesity prevalence among adolescents from 2006 to 2015. 2 However, trends in overweight and obesity prevalence differ according to adolescents' SES and thus may widen the WSG. 10 Indeed, in the 2002–2014 health behavior in school-aged children study, the authors showed that WSG among adolescents remained unchanged or have become wider since 2002 in European countries. 11
There is evidence of the effectiveness of universal interventions (i.e., interventions delivered equally to the whole population) to prevent overweight and obesity among adolescents. 13 In a systematic review, the authors identified six universal interventions aimed at preventing obesity among adolescents; four were effective. 13 Nevertheless, given that universal interventions do not account for social differences, it is necessary to evaluate their impact on the WSG. For instance, a universal intervention may be inequitable in its impact because of inequities in uptake. 14 With that in mind, Whitehead called for an evaluation of all interventions aimed at promoting health for their impact on WSG. 15 Despite these recommendations, little is known about the impact of universal interventions on the WSG among adolescents.14,16 In a systematic review, the authors 16 reported all existing interventions that might reduce WSG, and none were specific to adolescents.
The PRALIMAP (Promotion de l'ALIMentation et de l’ Activité Physique) study was a 2-year universal school-based intervention aimed at preventing and reducing overweight and obesity among adolescents. 17 Bonsergent et al. 18 have highlighted the effectiveness of the PRALIMAP trial but the question remains about its ability to reduce the WSG. Therefore, the objective of this study was to evaluate the impact of the PRALIMAP universal intervention on the WSG among adolescents.
Methods
The PRALIMAP Trial
In this study, we used data from the PRALIMAP trial. It was a 2 × 2 × 2 factorial cluster randomized controlled trial implemented in 24 state high schools in northeastern France between 2006 and 2009 (two academic years). This trial aimed to assess the effectiveness of three interventional strategies: “environmental,” “educational,” and “screening and care”—in preventing and reducing overweight and obesity among adolescents. The “environmental” strategy consisted of improving dietary and physical activity offerings in high schools; the “educational” strategy consisted of nutritional lessons and working groups; and the “screening and care” strategy consisted of detecting overweight or obesity and eating disorders among adolescents and proposing, if necessary, an adapted care management program of seven educational sessions.
The major finding of the PRALIMAP study was that of the three strategies implemented in the trial, the “screening and care” strategy may be an effective way to prevent and reduce overweight and obesity among adolescents. 18 Each high school was assigned to receive or not the three strategies (“educational,” “screening and care,” and “environmental”) according to a 2 × 2 × 2 factorial cluster randomization. Data were collected at grades 10 (T0 = baseline), 11 (T1), and 12 (T2) entry. Every academic year, an information letter was given to parents by high schools. If parents did not want data about their children to be collected, they had to inform high schools through the school nurse by writing and signing a letter in which they indicated their refusal. Adolescents were also given written and oral information and had the right not to participate. The study protocol was previously published and fully described in detail elsewhere. 17 The PRALIMAP trial was approved by the French National Commission for Computing and Liberties [CNIL] (no. 906312) and was registered at ClinicalTrials.gov (no. NCT00814554).
Among the 5354 adolescents included in the PRALIMAP trial, 3504 (65.4%) completed the 2-year intervention and made up our study sample.
Measurements
Anthropometric data
Weight and height were measured twice in a single session by high school nurses. The body mass index (BMI) was calculated as weight/height 2 from the mean of two measurements. Because BMI differs between boys and girls and is expected to increase with age during adolescence, we used an indicator that does not depend on age and sex; the BMI z-score. BMI z-score represents an age- and sex-specific BMI, according to the World Health Organization reference and allows direct comparison of BMI changes between boys and girls of different ages. 19 BMI z-score was calculated by measuring the distance (in standard deviations) between the measured BMI and the mean BMI of a World Health Organization reference population 19 and was considered as continuous variable in the statistical analysis. Age- and sex-specific cutoff values of the International Obesity Taskforce were used to define overweight and obesity. 20 The BMI z-score was the primary outcome and overweight and obesity prevalence was the secondary outcome.
Sociodemographic data
Sociodemographic data were collected once at T0. Data on age, sex, administrative area of high school (Meurthe-et-Moselle, Moselle, Meuse and Vosges), school boarding status (nonboarder, half-boarder, or full boarder), family composition (two- or single-parent), school type (general and technological or professional), social and professional class of the family head according to the definition of the national institute of statistical and economic studies in France (executives; intermediate jobs; farmers, shopkeepers, craftsmen and managers; employees and workers; inactive [retired or unemployed]), 21 and schooling placement (classical or advanced [≤15 years] or late [>15 years]) were obtained from the Board of Education database. Perceived family income level (low, moderate, or high) and type of residence (rural or urban) were additional sociodemographic data collected by self-administered questionnaires completed by adolescents at T0.
From these data, the “indice de position sociale des élèves” (IPSE) was derived to measure adolescents' SES. Because of its multidimensional nature, SES involves the use of several sociodemographic characteristics to measure it. Moreover, adolescents' SES depends on sociodemographic characteristics of both parents. 22 It is therefore necessary to use an indicator that summarizes these characteristics to measure adolescents' SES, such as the IPSE. The IPSE is a quantitative index developed by the statistical entity of the French Ministry of Education. 23 The methodology used to develop IPSE is similar to that used by Ganzeboom to build the standard international socioeconomic index of occupational status. 24 It consists in summarizing sociodemographic characteristics that define both parents' occupations (according to the definition of the national institute of statistical and economic studies in France 21 ) into a reference value. To compute reference values, authors analyzed parents' sociodemographic characteristics (educational level, material conditions, cultural capital, and cultural practices) of 29,544 French children in grade 6 through multiple component analyses. We applied these reference values to parents' occupations available in our database for defining adolescents' SES.
Reference values range from 40 (lowest SES) to 179 (highest SES) and was rescaled from 1 (lowest SES) to 10 (highest SES) for this study. To have a sufficient number of adolescents in each SES group, the IPSE was categorized into five classes to investigate the WSG: [1–2] highly less advantaged; [3–4] less advantaged; [5–6] intermediate; [7–8] advantaged; and [9–10] highly advantaged.
Statistical Analysis
Descriptive statistics were used to report baseline IPSE classes, sociodemographic and anthropometric characteristics of included adolescents. Continuous variables are described as mean ± standard deviation and categorical variables as number (%).
First, we examined baseline WSG as a linear association between SES (IPSE classes) and weight status outcomes (BMI z-score and overweight and obesity prevalence) using unadjusted linear regression models. In these analyses, IPSE was considered as a discrete variable to obtain the p-value and the slope (beta) of linear trend test. The significance of the linear trend test evidenced the presence of a WSG and the slope (beta) indicated its magnitude. WSG was the slope (beta) of IPSE plotted against weight status.
Second, we analyzed the impact of the PRALIMAP universal intervention on WSG among adolescents. Changes in weight status outcomes (T2–T0) were calculated for each IPSE class by using paired Student's t-test for BMI z-score, and McNemar's test for overweight and obesity prevalence. Then we compared WSG changes between IPSE classes by hierarchical models that included within-adolescents and within-high-school variance. IPSE was declared as a discrete variable and models were adjusted for age and sex.
Third, we carried out the same analyses as previously among adolescents who received or not “screening and care,” “environmental,” and “educational” strategies (available in Supplementary Tables S1 and S2). Given the 2 × 2 × 2 factorial design of the PRALIMAP trial (adolescents could benefit from several strategies), the effect of each strategy was adjusted for the other strategies in addition to age and sex. 25
To complement the results and to contribute to their understanding, we computed Supplementary analyses for BMI (available in Supplementary Tables S3 and S4).
A value of p < 0.05 was considered statistically significant. Statistical analyses involved use of SAS v9.4 (SAS Institute, Inc., Cary, NC).
Results
Sociodemographic and Weight Status Characteristics of Adolescents
Table 1 describes the sociodemographic and weight status characteristics of the 3504 adolescents. The mean (±standard deviation) age was 15.2 (±0.6 years) and 2022 (57.7%) of the adolescents were girls. Overall, 85.1% of adolescents attended general and technological high schools, 73.2% were in classical or advanced placement at school, and 69.4% were half-boarders. Approximately half (48.2%) lived in urban areas, 84.7% were in two-parent families, 58.6% perceived a high family income level and the family heads were predominantly employees or workers (39.4%). IPSE classes consisted of highly less advantaged (n = 520, 14.8% of adolescents), less advantaged (n = 956, 27.3%), intermediate (n = 1027, 29.3%), advantaged (n = 683, 19.5%), and highly advantaged (n = 318, 9.1%). The BMI z-score was 0.23 ± 1.0 and 18.2% of adolescents were overweight or obese.
Baseline Sociodemographic and Weight Status Characteristics of Adolescents (n = 3504)
Data are given as n (%) unless otherwise indicated.
BMI, body mass index; IPSE, indice de position sociale des élèves; SD, standard deviation.
Baseline WSG
Baseline unadjusted linear associations between SES (IPSE classes) and weight status outcomes (BMI z-score and overweight and obesity prevalence) are given in Table 2. For the entire sample, we evidenced significant baseline WSG. BMI z-score linearly decreased with increasing SES (β = −0.06, p < 0.0001). Overall, significant linear associations were also identified between SES and overweight and obesity prevalence (β = −2.86, p < 0.0001). Similar results were found whatever the interventional strategy adolescents benefited from (Supplementary Tables S1 and S2).
Baseline Association between Socioeconomic Status and Body Mass Index z-Score and Overweight/Obesity Prevalence for the Whole Sample (n = 3504)
SES defined according to IPSE score ([1–2] highly less advantaged, [3–4] less advantaged, [5–6] intermediate, [7–8] advantaged, and [9–10] highly advantaged). Bold indicates statistical significance.
IPSE used as discrete variable. The significance (p) of the linear trend test evidenced the presence of a WSG and the slope (β) indicated its magnitude.
SES, socioeconomic status; WSG, weight social gradient.
Impact of Universal Intervention on WSG
The graphical representation of age- and sex-adjusted WSG for BMI z-score and overweight and obesity prevalence at T0 and T2 is given in Figure 1.
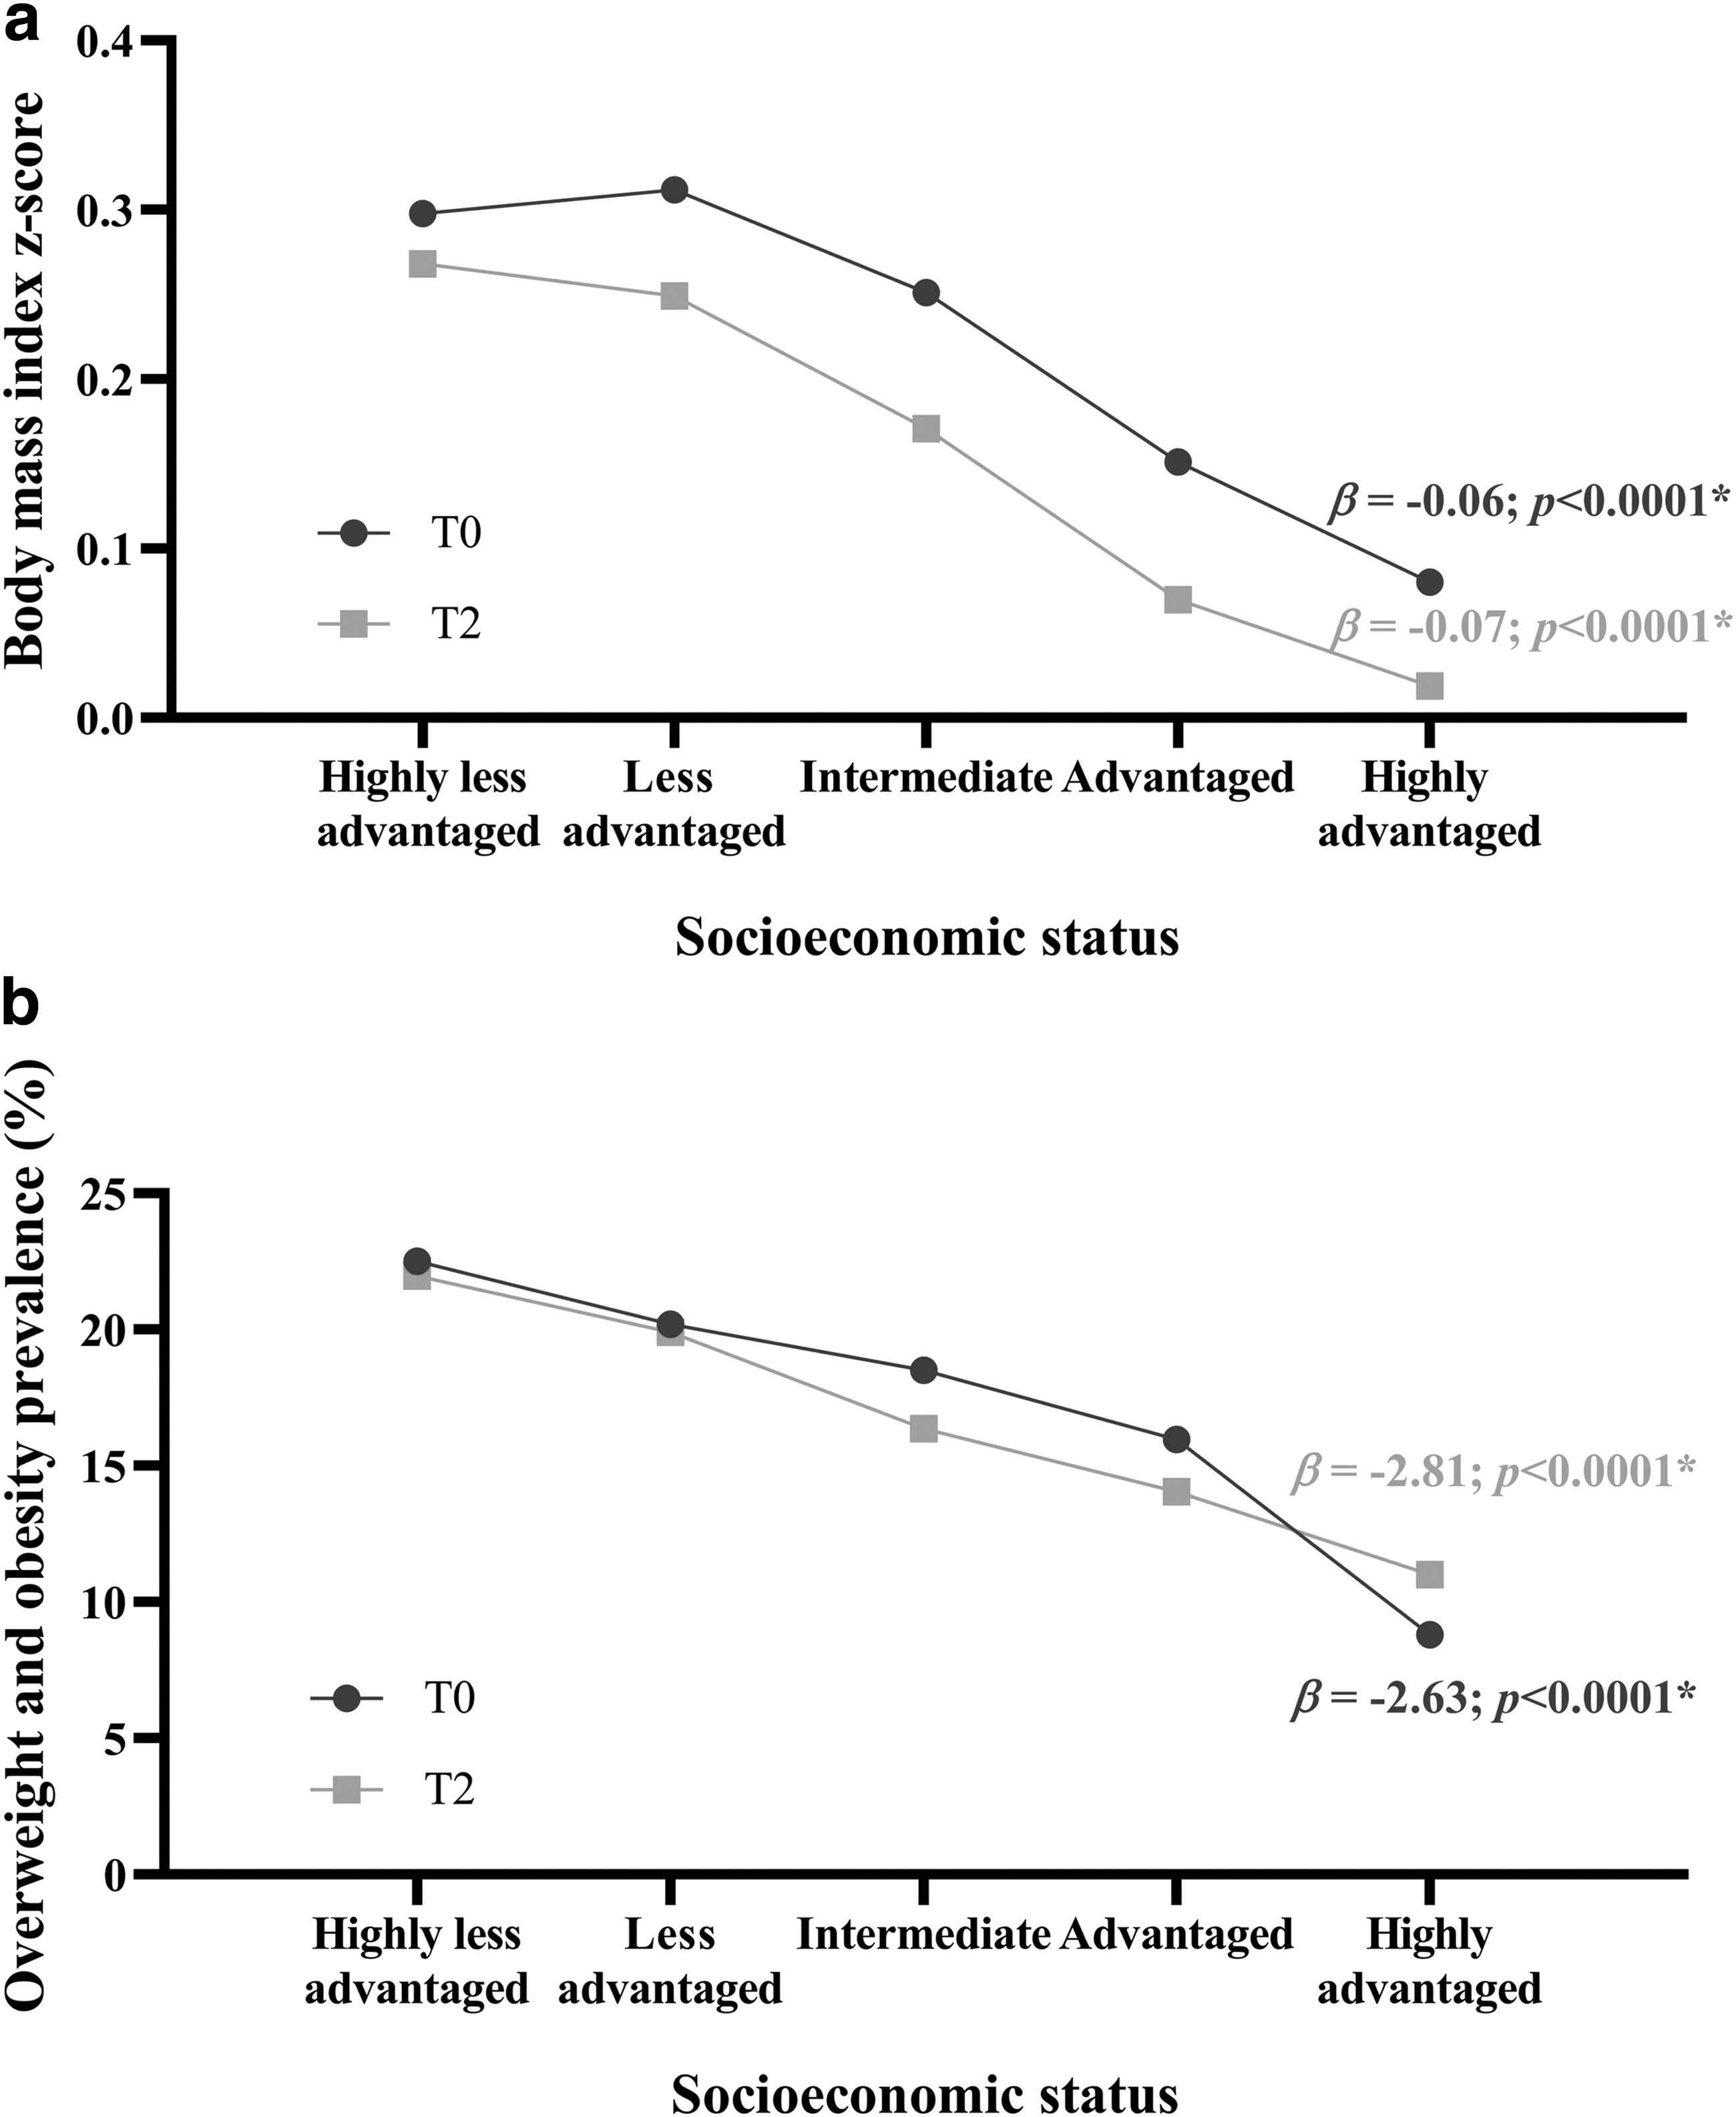
Table 3 shows the evolution of WSG for BMI z-score from T0 to T2. For all adolescents, between T0 and T2, the BMI z-score significantly decreased (range, −0.07 to −0.03) in each IPSE class. The WSG did not significantly change during the intervention (β = −0.01; 95% confidence interval [−0.02 to 0.01], p = 0.48). Compared with adolescents from highly advantaged class, those from other IPSE classes showed no significant change in BMI z-score. On subgroup analysis, similar results were observed, whether adolescents benefited from the “screening and care,” “environmental,” and “educational” strategies or not (Supplementary Table S1). We found a significant change in BMI z-score for each IPSE class between T0 and T2 without a significant reduction in WSG.
Two-Year Change of the Association between Socioeconomic Status and Body Mass Index z-Score for the Whole Sample (n = 3504)
SES defined according to IPSE score ([1–2] highly less advantaged, [3–4] less advantaged, [5–6] intermediate, [7–8] advantaged, and [9–10] highly advantaged); T0, inclusion; T2, end of intervention. Bold indicates statistical significance.
IPSE used as discrete variable in each model. The significance (p) of the linear trend test evidenced the presence of a WSG and the slope (β) indicated its magnitude.
p < 0.0001.
p < 0.05.
IPSE used as categorical variable. β regression coefficient and associated p-value of the mixed model indicated the BMI change of adolescents from highly less advantaged, less advantaged, intermediate, and advantaged IPSE classes compared with those from highly advantaged IPSE class.
95% CI, 95% confidence interval.
The evolution of WSG for overweight and obesity prevalence from T0 to T2 is given in Table 4. Except for adolescents from intermediate class, the prevalence of overweight and obesity did not significantly decrease from T0 to T2. After the intervention, there was no significant change in the WSG (β = −0.01 [−0.07 to 0.05], p = 0.73). Whatever the interventional strategy adolescents received, analogous results were found (Supplementary Table S2). We found no significant decrease in overweight and obesity prevalence for each IPSE class and no significant reduction in WSG from T0 to T2.
Two-Year Change of the Association between Socioeconomic Status and Overweight/Obesity Prevalence for the Whole Sample (n = 3504)
SES defined according to IPSE score ([1–2] highly less advantaged, [3–4] less advantaged, [5–6] intermediate, [7–8] advantaged, and [9–10] highly advantaged); T0, inclusion; T2, end of intervention. Bold indicates statistical signficance.
IPSE used as discrete variable in each model. The significance (p) of the linear trend test evidenced the presence of a WSG and the slope (β) indicated its magnitude.
p < 0.001.
p < 0.05.
IPSE used as categorical variable. β regression coefficient and associated p-value of the mixed model indicated the BMI change of adolescents from highly less advantaged, less advantaged, intermediate, and advantaged IPSE classes compared with those from highly advantaged IPSE class.
Supplementary Figure S1 and Supplementary Tables S3 and S4 present results for BMI.
Discussion
This study highlights that the effectiveness of the PRALIMAP universal intervention to reduce overweight and obesity among adolescents in a high school setting over a 2-year period did not differ by SES. It showed a WSG among adolescents at T0 and T2: the lower the SES, the higher the BMI z-score and overweight and obesity prevalence. Adolescents from higher socioeconomic groups were more likely to have lower BMI z-score and overweight and obesity prevalence than adolescents from lower socioeconomic groups. However, the PRALIMAP universal intervention did not significantly reduce the WSG among adolescents.
This study identified a baseline WSG among adolescents. Ours results are consistent with the literature.26,27 Goodman et al. 26 highlighted a highly significant linear increase in relative risk of adolescent obesity with SES. In a systematic review from 1990 to 2013, the authors reported evidence of associations between SES and adolescent weight status. 27 They observed an inverse relation between weight status and SES for children or adolescents in 60.4% of the 158 included studies. In addition, this proportion increased to 66% for studies that used International Obesity Taskforce cutoff values.
Unlike for BMI z-score, we did not find a significant decrease in prevalence of overweight and obesity in each socioeconomic group during the intervention. This observation may be because of a lack of statistical power. Indeed, we found a significant decrease in prevalence of overweight and obesity only among adolescents from intermediate socioeconomic group, the most represented in our study. In addition, results of the PRALIMAP trial showed a significant decrease of 1.38% in overweight and obesity prevalence among all adolescents. 18 However, the PRALIMAP study was not originally powered to show a decrease in overweight and obesity prevalence from T0 to T2 in each socioeconomic group. 17
During the intervention, no significant changes occurred in the WSG. This finding is consistent with results from a systematic review by Moore et al. 14 The authors stressed that, in most universal school-based interventions, socioeconomic inequalities are rarely considered part of the problem to address. Thus, the assessment of the impact of these interventions on socioeconomic inequalities in health often does not reach significance, which may be the case in our study because the PRALIMAP trial was not originally powered to detect a differential impact of the intervention between socioeconomic groups. Indeed, from a sample size of 3504 adolescents, an alpha risk of 5% and a power of 80%, we would have evidenced a reduction of 0.023 in WSG from T0 to T2 for BMI z-score. Our findings are also congruent with Bambra et al. 16 who found no significant WSG changes in a meta-analysis of 11 universal interventions that might reduce existing inequalities in the prevalence of obesity among young people. Another explanation of our result could be that the PRALIMAP universal intervention was equally uptaken by adolescents, whatever their SES. As a result, there was neither a reduction nor an increase in the WSG. In their systematic review, Hillier-Brown et al. 28 concluded that universal interventions have the potential to slow the widening of the WSG. The authors identified a 4-year school-based multicomponent education and exercise universal intervention conducted in France and aimed at preventing overweight among adolescents. 29 At 4 years, adolescents who received the intervention exhibited a lower increase in BMI (p = 0.01) and age- and sex-adjusted BMI (p < 0.02) than adolescents in the control group, with no differential effects by SES.
On subgroup analyses, we did not evidence the effectiveness of the “screening and care,” “educational,” and “environmental” strategy to reduce the WSG (Supplementary Tables S1, S2, S4). Thus, the lack of evidence of effectiveness of such strategies to reduce the WSG may not be related to their design but rather to the universal principle of the PRALIMAP intervention itself. These different points led us to suggest that social differences should be accounted for in interventions aimed at addressing socioeconomic inequalities in weight status. Specifically and according to Marmot, 30 interventions should be universal and proportionate (i.e., with a scale and intensity that is proportionate of the level of disadvantage). For example, Legrand et al. 31 conducted a universal and proportionate intervention to reduce WSG among adolescents. Specifically, a standard-care management was proposed for all adolescents, whereas a strengthened-care management was proposed for only adolescents from low socioeconomic group. The standard-care management included five 2-hour group sessions on physical activity and diet, and the strengthened-care management consisted of adapted activities for overcoming barriers that are supposed to contribute to WSG.
Study Limitations and Strengths
This study has some limitations. First, the PRALIMAP trial was not originally powered to analyze the impact of the intervention on WSG. However, this study followed Whitehead's recommendations 15 for evaluating all interventions aimed at promoting health for their differential impact on socioeconomic groups, and our results could contribute to the development of new overweight/obesity prevention policies. Second, adolescents' SES was measured with the IPSE, an index that is not widely used but allows for taking several dimensions (social, economic, and cultural) of the SES into account. Moreover, there is no perfect indicator to measure SES. Indeed, the latter is frequently measured with three noninterchangeable objective indicators (education, occupation, and income) in research. However, education, occupation, and income capture distinct dimensions of SES 22 that are differentially associated with outcomes, and their use to study the same phenomena may yield different conclusions. 32 For example, an inverse relation was observed between SES and weight status in 37.5% of studies that used family income, in 65.8% studies that used the father's and/or mother's education, and in 41.7% that used the father's and/or mother's occupation. 27 Furthermore, parental education, occupation, and income are not considered the most relevant indicators to measure adolescents' SES. 33 In addition, the methodology used to create the IPSE is similar to the construction of the standard international socioeconomic index of occupational status, which is a widely used index. 24 Finally, because the classification of the IPSE scores into five relevant classes was not performed before our study, there was no existing literature to justify how social classes should be created from IPSE. However, the method used was based on previously published works on the subject of social inequalities in health that used an a priori classification of SSE indicators close to IPSE (e.g.: the Family Affluence Scale).22,31 Despite these limitations, our study has several strengths. First, our results are derived from data of a trial with a long follow-up and a large sample size. Second, analyses were conducted for the whole sample and by strategies.
Conclusions
This 2-year follow-up study could not provide evidence that a universal school-based intervention was an effective way to reduce socioeconomic inequalities in weight status among adolescents. These results suggest that interventions with a different approach to this study should be considered to tackle these inequalities. Specifically, interventions should have a universal and proportionate approach that accounts for social differences.
Footnotes
Acknowledgments
In the name of the PRALIMAP trial group, the authors thank all those who, through their various roles, led to the implementation of this project. The PRALIMAP Trial Group: N. Agrinier, N. Angel, R. Ancellin, E. Aptel, F. Bailly, L. Barthelemy, D. Bezaz, E. Bonsergent, S. Briançon, J. F. Collin, R. De Lavenne, E. Dietz, P. Enrietto, E. Favre, M. Gentieu, E. Gouault, M. Helfenstein, S. Hercberg, F. Kurtz, J. Langlois, P. Laure, E. Lecomte, K. Legrand, E. Lecomte, J. Lighezzolo, P. Marx, A. Y. Omorou, A. Osbery, M. O. Piquee, P. Renaudin, G. Robert, A. Schichtel, S. Tessier, A. Vuillemin, E. Villemin, and M. Wuillaume.
Funding Information
This research did not receive any specific funding from agencies/institutions in the public, commercial, or not-for-profit sectors.
Author Disclosure Statement
No competing financial interests exist.
References
Supplementary Material
Please find the following supplemental material available below.
For Open Access articles published under a Creative Commons License, all supplemental material carries the same license as the article it is associated with.
For non-Open Access articles published, all supplemental material carries a non-exclusive license, and permission requests for re-use of supplemental material or any part of supplemental material shall be sent directly to the copyright owner as specified in the copyright notice associated with the article.