
Abstract
Background:
Childhood overweight and obesity are recognized as predictors of the risk of obesity in adulthood. The aim of this systematic literature review was to determine the association between dietary pattern and obesity risk among children.
Methods:
Articles were selected from databases (Cochrane Library, Lilacs, Eric, Livivo, and PubMed/Medline), without limitations regarding language or date. Database-specific search terms included the key words “obesity,” “diet,” “dietary pattern,” “childhood,” “children,” “adolescents,” and relevant synonyms. The review included studies that reported the assessment of the dietary pattern in childhood and that correlated eating patterns with the obesity risk through cluster analysis (CA) and/or factor analysis and/or principal component analysis and presented odds ratios (ORs). The methodology of the selected studies was evaluated using the JBI Critical Appraisal Checklist for Analytical Cross-Sectional Studies. Owing to the heterogeneity among the assessments of the association of dietary patterns and obesity, the results are described narratively.
Results:
Using a selection process in two phases, 16 articles were included. Fifteen studies used a cross-sectional design, and one case–control study. The included studies showed variation in sample size (range = 232 to 10,187 children/adolescents) and age (range = 1–19 years old). The studies reported between two and five dietary patterns each. The OR for the relationship between the dietary pattern and the risk of childhood obesity ranged from OR = 1.02; confidence interval (95% CI) (0.91–1.15) to OR = 3.55; 95% CI (1.80–7.03). In this study, the dietary patterns identified by the studies were given different names. The food intake patterns identified could, in most factor or CA studies, be categorized as (1) potentially obesogenic foods that increased risk of becoming overweight (including fatty cheeses, sugary drinks, processed foods, fast food, candies, snacks, cakes, animal products, whole milk, and refined grains) or (2) food classified as healthy with the weakest association with the risk of becoming overweight or obese (including low levels of sugar and fat and high levels of fruits, vegetables, whole grains, fish, nuts, legumes, and yogurt).
Conclusion:
Overall, the results indicated from most studies that a diet with a lower percentage of obesogenic foods should be effective in reducing the risk of developing obesity.
Introduction
Among the most serious public health problems of the 21st century, both in developed and developing countries, being overweight in childhood and childhood obesity are recognized as predictors of the risk of obesity in adulthood.1,2 Between 1980 and 2013, these problems underwent a large increase in developing countries from 8.1% to 12.9% for boys and 8.4% to 13.4% for girls 3 ; in 2016, the WHO reported 41 million overweight children aged <5 years worldwide. 4
Childhood obesity has increased over time and has different prevalence rates among different countries. In the United States, for example, the prevalence of childhood obesity increased from 12.4% in 20105 to 30% in 2014, 8 whereas in South Korea, 6 it increased from 14.3% in 2010 to 15.3% in 2013. In 2011, in China, the prevalence of obese children was 10.1% 7 and the prevalence was 7% in Portugal. 9 Between 2012 and 2016, the increase in the prevalence of obese children was 30%–35% in Mexico, 10 12% in Indonesia, 11% in Thailand, 11 and 5%–15% in Latin American countries, 12 with lower prevalence rates in Asian countries, such as 5% in the Philippines, 3% in Myanmar, 2% in Laos, and 2% in Cambodia. 11
As a complex condition, childhood obesity is a risk factor for several noncommunicable diseases, such as hypertension, dyslipidemia, liver disease, diabetes, polycystic ovary syndrome, and obstructive sleep apnea, as well as psychosocial problems, including discrimination, social isolation, and low self-esteem, which can affect health, education, and quality of life.5,9
It is estimated that 40% to 60% of obese children will become obese adults, with consequences for their health and the world economy,1,9,13 thus it is necessary to develop effective approaches to prevent childhood obesity as a public health priority. 14 As the lifestyle patterns adopted in childhood are likely to continue in adulthood, 8 analysis of diet or dietary patterns is among the approaches that can be performed. 15
Because dietary intake, as a rule, follows a pattern of consumption and diet itself is a modifiable risk factor, understanding dietary patterns can provide useful information about the associations between diet quality and its influence on health, especially in relation to obesity.16,17 The analysis of dietary patterns has been identified as a more realistic representation of dietary habits, 18 since it takes into account the complex interactions between nutrients and other components of a diet, thus making interventions to change eating habits possible.16,17
However, Shi et al. 19 suggested that the ideal is to interpret an eating pattern as a predictor of the risk of being overweight in childhood or childhood obesity, beyond associating eating patterns with nutrient intake. Thus, this study aimed to address this gap, with the purpose of this article being to review the literature to determine the association between dietary pattern and the risk of obesity among children and adolescents.
Methods
Protocol and Registration
This systematic review followed the guidelines of the Preferred Reporting Items for Systematic Reviews and Meta-analysis checklist (PRISMA). 20 The protocol underpinning this review is available through the PROSPERO database (see registration number CRD42019132217).
Eligibility Criteria
Inclusion criteria
Cohort studies, surveys, and cross-sectional and longitudinal studies that reported the dietary pattern assessment in childhood and that correlated eating patterns with obesity risk were included. Studies that were published in any language or date were considered.
Population: studies with samples of children aged <11 years, and/or adolescents aged 12–18 years (or a mean within these ranges) as subjects of study at baseline were included. Dietary information was reported by the children/adolescents aged >12 years or their parents, mother–child pairs, participating families, or parents or caregivers of children younger than 12 years.
This systematic review only included studies that reported risk estimates [hazards ratios, odds ratios (ORs), and relative risks] of obesity and measures of variability [effective sizes (ESs) or confidence interval (95% CIs) from which these could be derived] and studies that used validated instruments to measure food and/or dietary patterns (rather than nutrients) through cluster analysis (CA) and/or factor analysis (FA) and/or principal component analysis (PCA).
The studies reported that individuals were given factor scores for each of the patterns. Factor scores were divided into percentiles, tertiles, or quartiles on the basis of their contribution to each pattern. The studies were included when they reported dietary patterns for each food group, first categorized into percentile, tertiles, or quartiles of energy consumption and then classified into three categories: low consumption (first percentile, tertile, or quartile), moderate consumption (second percentile, tertile, or second and third quartile), and high consumption (third percentile, tertile, or fourth quartile).
Studies that determined the correlation between eating patterns and obesity risk, and used a variety of obesity measures were included: weight status was determined using age- and gender-specific BMI percentiles, BMI z-scores, BMI standard deviation scores (SDSs), BMI cutoff points, or waist circumference (WC). BMI was calculated as weight in kilograms divided by the square of height in meters [BMI = weight (kg)/(height (m2))]. Abdominal obesity was considered as waist-to-height ratio (WHR) >0.5. The WC was measured midway between the lowest rib and the superior border of the iliac crest with a measuring tape at the end of normal expiration to the nearest 0.1 cm.
The primary criteria used to define overweight and obesity include overweight: BMI or WC ≥85th percentile to 95th percentile, BMI = 1 standard deviation above the average; obesity: BMI or WC = 95th percentile, WHR >0.5, BMI = 2 standard deviations above the average, and overweight if their BMI z-score was between the 85th and 95th percentile and obese if their BMI z-score was >95th percentile.
Exclusion criteria
The following exclusion criteria were applied: 1—studies that did not correlate eating patterns with obesity through reported risk estimates [hazards ratios, ORs, and relative risks]; 2—studies that did not consider dietary patterns through CA and/or FA and/or PCA; 3—participants who were not children and adolescents; 4—studies that analyzed only one isolated macronutrient or nutrient and not the entire diet; 5—studies with well-defined/characterized samples of nonhealthy subjects (e.g., people with type 2 diabetes, hypertension patients, and eating disorders). Supplementary Appendix Table A1 contains the articles excluded and the reasons for exclusion.
Information Sources and Search Strategy
Detailed individual search strategies were performed in each of the following electronic databases: Cochrane Library, Lilacs, Eric, Livivo, and PubMed/Medline. A gray literature search was performed in Google Scholar. In addition to the electronic search, a hand search was made and the reference lists of the selected articles were screened). Search terms and Boolean operators of the medical subject headings, keywords, and/or other controlled vocabulary terms were used in searches of the PubMed and the others electronic databases. All electronic searches were conducted from their earliest records up to March 29, 2018 and updated to October 10, 2018. Database-specific search terms included the key words “obesity,” “diet,” “dietary pattern,” “childhood,” “children,” “adolescents,” and relevant synonyms. Supplementary Appendix Table A2 contains the complete strategy search terms and databases.
Study Selection
The articles were selected in two phases. In phase 1, two authors (R.L. and E.K.) independently reviewed the titles and abstracts of all the references. During this phase, any articles that did not meet the eligibility criteria already described in the inclusion and exclusion criteria session were excluded. In phase 2, they applied the same selection criteria to the full text of the articles to determine which articles to include. The same two authors independently reviewed the full texts of all the articles.
Data Collection Process and Data Items
One author (R.L.) extracted the data from the selected studies, including study characteristics (author, year of publication, study design, and location), population and sample characteristics, diet assessment method, dietary patterns identified, dietary patterns and their key components, findings [factors adjusted for in the analyses (multivariable), OR, prevalence ratios, and 95% CI], and main conclusion. A second author (E.K.) cross-checked all the information retrieved.
Risk of Bias in Individual Studies
Risk of bias in the individual studies included was conducted using the JBI-MAStARI (JBI Meta Analysis of Statistics Assessment and Review Instrument). The questionnaire consists of eight questions that were answered with yes, no, unclear, or not applicable.54,55 In the JBI-MAStARI, two criteria listed in the instrument were deemed irrelevant to the nature of the studies. The studies were classified as follows: high methodological quality (>5 “yes” responses), moderate methodological quality (3–4 “yes” responses), or low methodological quality (0–2 “yes” responses). 56 Supplementary Appendix Table A3 contains the risk of bias of the selected studies by JBI-MAStARI.
Summary Measures
The dietary patterns identified by CA and/or FA and/or PCA and the association with obesity were considered as the outcome. Risk estimates [hazards ratios, ORs, and relative risks] of obesity and measures of variability (SEs or 95% CIs from which these could be derived) for the outcome measurement were considered in this review. The original studies reported the results of dietary patterns in terms of quartiles or tertiles of dietary factor scores and obesity risk.
Data Synthesis and Analysis
We created tables of evidence containing information from the included studies. Owing to the heterogeneity among the assessments of the association of dietary patterns and BMI or obesity, it was not possible to perform a meta-analysis; therefore, the results are described narratively. It was not possible to assess publication bias through funnel plots as no statistical data synthesis could be performed.
Results
Study Selection
From the 1570 references initially identified, a comprehensive evaluation of the abstracts was performed after removal of duplicates; 1411 articles were excluded, resulting in finally 159 articles. After title and abstract reading, 52 potentially useful studies were acquired. Of these 36 articles were excluded for various reasons (Supplementary Appendix Table A1). Thus, 16 studies were retained for the final selection. A flowchart of the process of study identification and selection is presented in Figure 1.
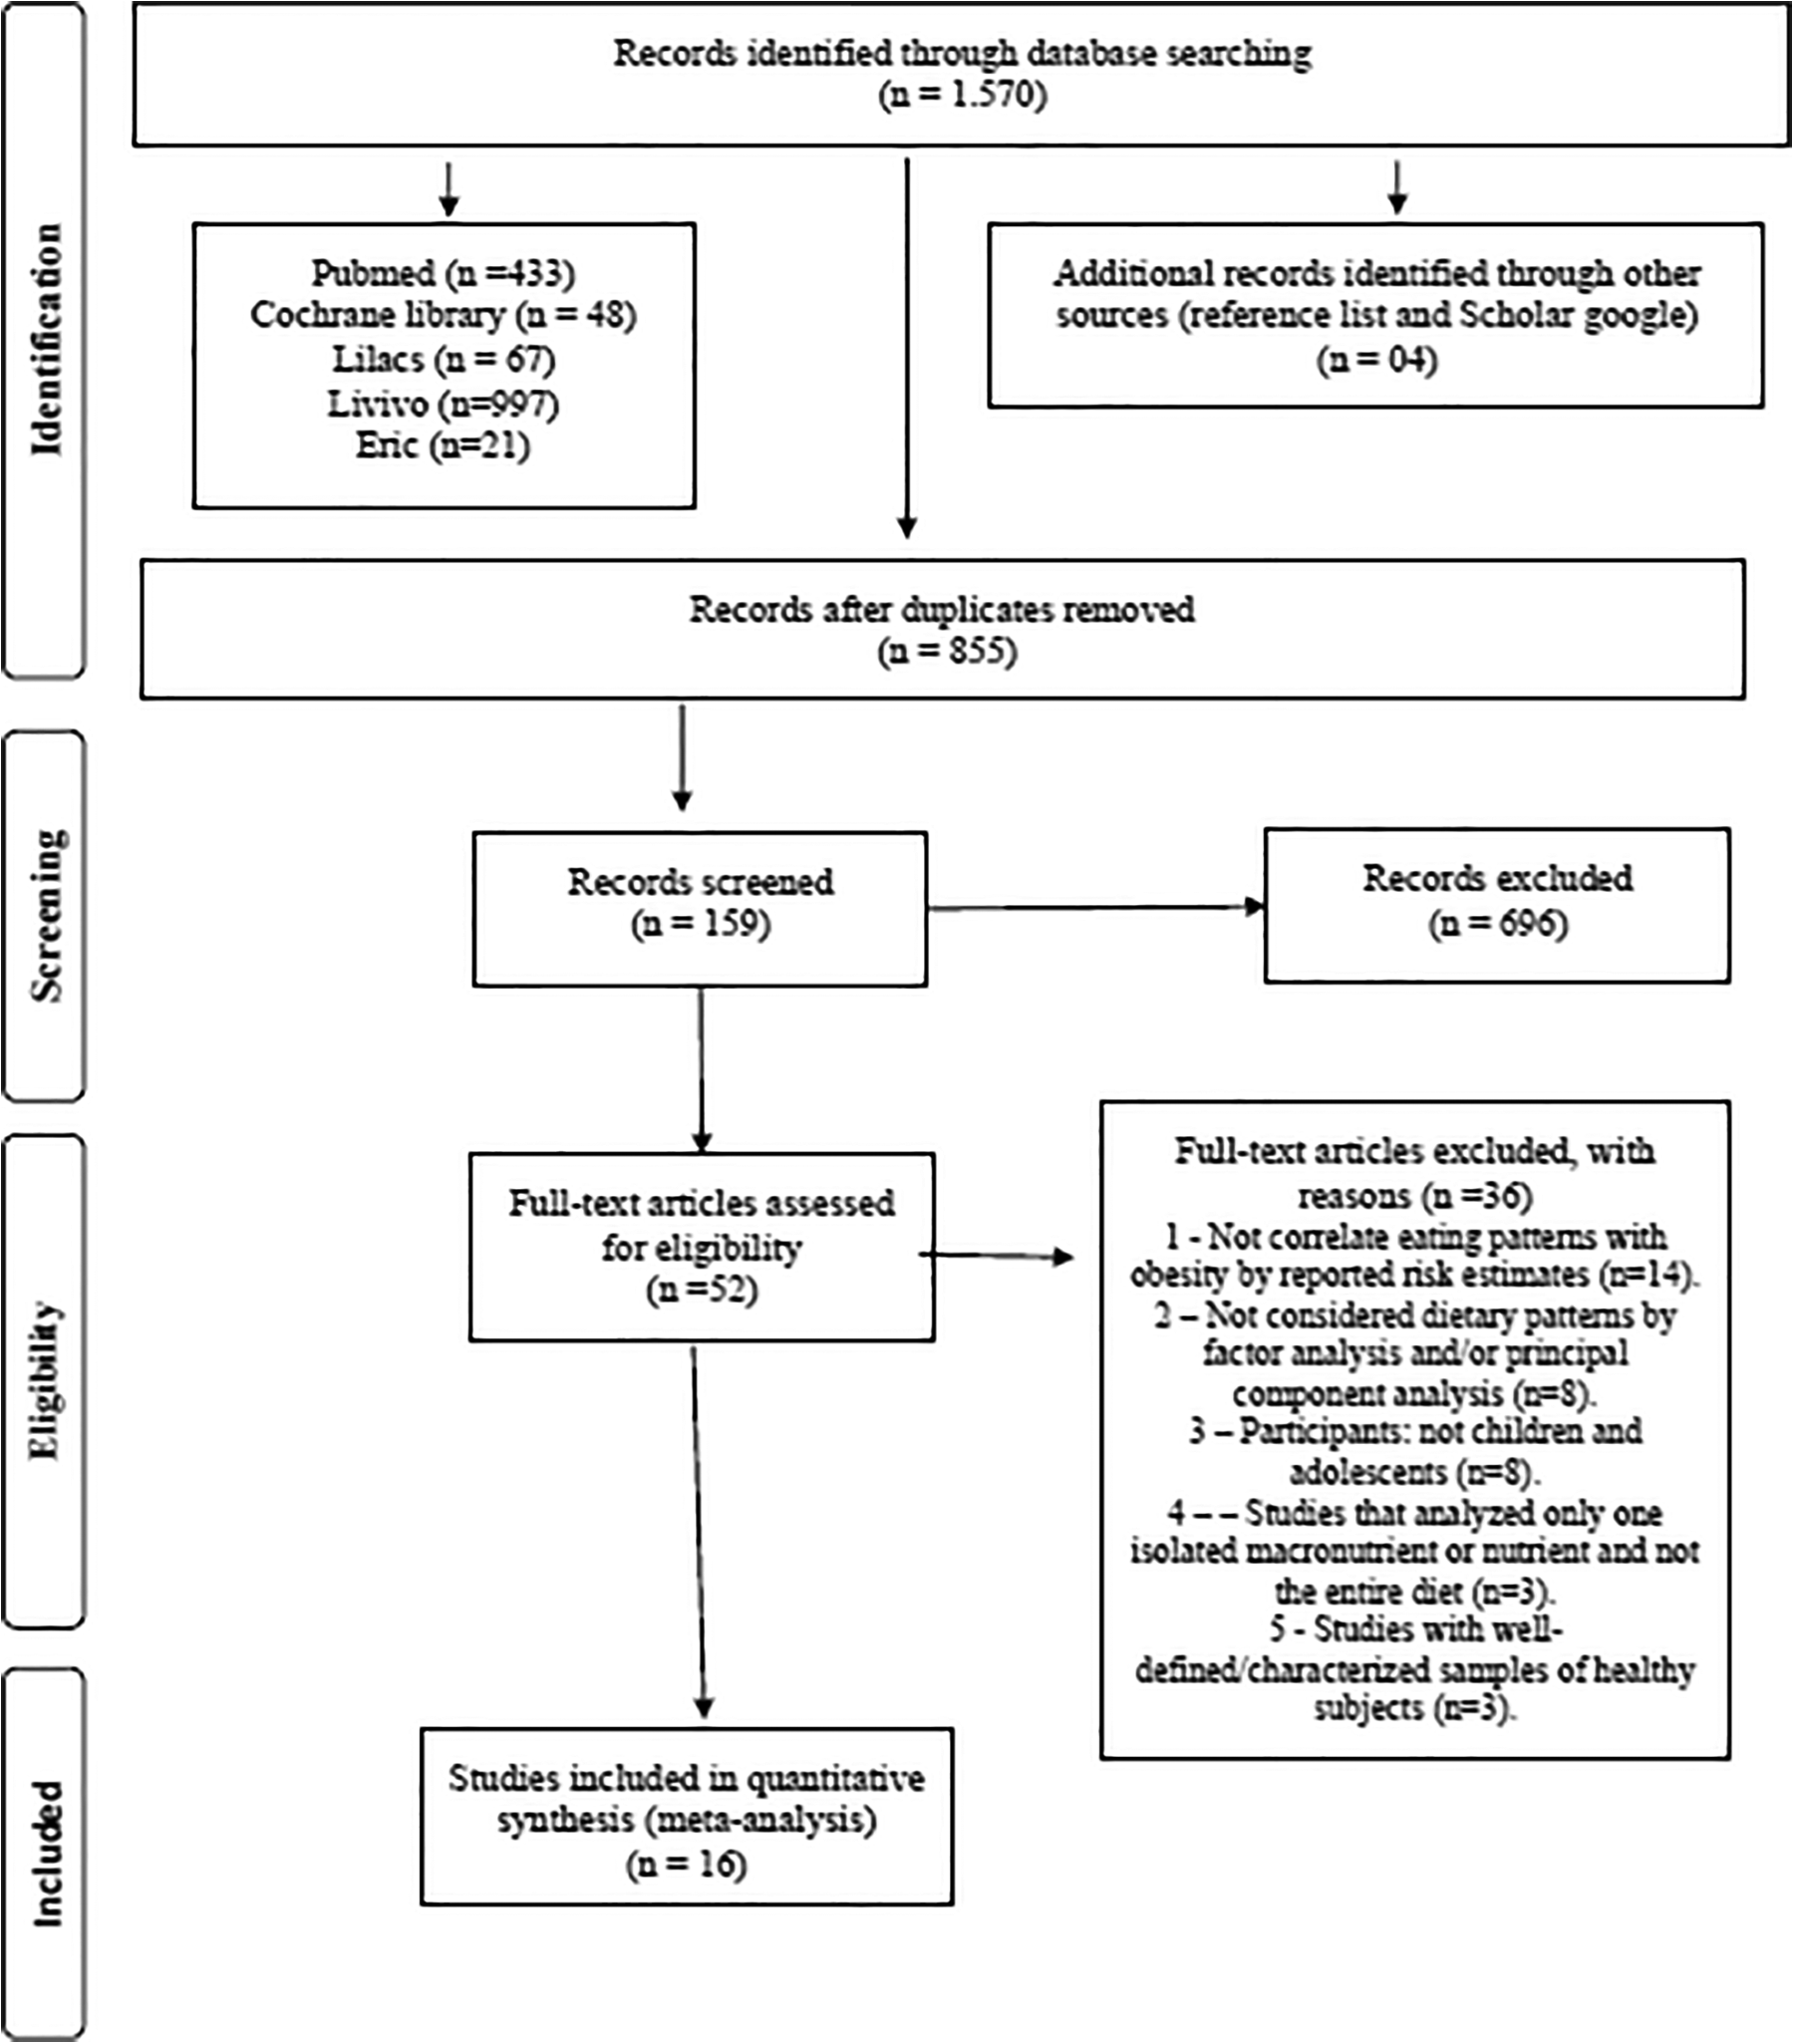
Flow diagram of search.
Study Characteristics
The 16 studies were published between 2010 and 2018. The studies were all cross-sectional studies, with the exception of one case–control study. 70 The studies were conducted in nine different countries and the majority of studies were from Asian countries (Iran, 70 China,61,65,66,69,71 and Lebanon64,67), with four from American countries (Mexico, 58 Brazil,60,63 and Colombia 62 ), two from European countries (Norway57,59), one from Australia, 19 and one from Polynesia (Samoan island of Upolu 68 ).
Most of the articles were published in English,19,57–59,61,64–71 two articles were published in Portuguese,60,63 and one article was published in Spanish. 62
Sample sizes ranged from 232 to 10,187 children and adolescents. Mean age among the study participants ranged from 1 to 19 years. Six studies were with children aged between 1 and 6 years,58,61,62,65,69,70 five studies with children aged between 5 and 18 years,19,60,67,68,71 two studies with children aged between 9 and 13 years,57,59 and three studies with adolescents in the age group between 11 and 19 years.63,64,66
Seven studies included >1000 participants.58,61,62,65,66,70,71 The total sample from the 16 selected studies included 44,793 children and adolescents. The total sample from Asian countries was n = 22,263,61,64–67,69–71 the American countries was n = 19,145,58,60,62,63 the European countries was n = 1351,57,59 Australia was n = 288, 19 and was n = 305 from the Samoan island of Upolu. 68
The most popular used methods for deriving dietary patterns are PCA, FA, and CA. Of the 16 selected studies, 1 used CA, 58 7 used FA,19,61,64–67,71 and 8 used PCA.57,59,60,62,63,68,69,70
Using PCA or FA or CA to identify dietary patterns, the majority of the studies included in this review extracted two,64,67–69,71 three,19,60,63,65,66,70 or four patterns.57,59,61 The cumulative proportion of the total variance in dietary intake explained by the patterns of these studies ranged from 16.36% 69 to 38.18%, 70 accounting for only a limited portion of the between-person variance in diet. Of note, the identification of three factors in the analysis by Yang et al. 66 that accounted for 65.6% of the cumulative proportion of the total variance is out of the range of what was reported in the aforementioned studies.
Because age, gender, socioeconomic status, demographic and environmental factors, and physical activity level are associated with both the dietary patterns and the risk of overweight and/or obesity in children and adolescents, these confounders must be included in the adjusted models. In addition, the risk of Ow/Ob in children might be linked to parental weight status and child's behavioral factors such as sedentary activity and duration of sleep.
Regardless of the difference in confounding variables and their characterization among the included studies, statistical adjustments in the multivariate analysis varied across the studies. This systematic review only included studies that reported risk estimates (ORs). For the estimative risk analysis and strategies to deal with confounding factors stated (calculate unadjusted and adjusted ORs), the studies used the following statistics: multiple logistic regression,19,57,58–60,63,65–69,71 logistic regression random effects model, 61 binomial regression model, 62 multiple linear regression, 64 conditional logistic model. 70
Possible confounding factors were controlled in the patterns of regression and ORs were calculated by adjusting for potential risk factors of obesity. The studies show many confounders, however, the majority of studies considered the age,19,58,61–65,67–71 gender,19,58,61–65,67–71 parental characteristics (family education, family income, parental obesity, and unhealthy behavior),19,57,59,61,63,64,67,69,71 and physical activity level,57,59,61,64–66,70 as important confounders.
The most important confounders associated with the obesity risk are age,19,58,61,62,64,65,68–71 gender,19,59,61,62,64,65,68–71 physical activity level,57,64,65,67,70 parental characteristics (parental BMI,57,58,64,67 education,19,57,59,64,67 family income,59,65 and family history of chronic diseases 70 ), BMI,64,67,70 living area,65,68,70 screen time,64,67,70 smoking status,64,67 and frequency of eating out per week.64,67 A summary of the descriptive characteristics of the included studies is provided in Table 1.
Summary of the Characteristics of the Included Studies
Abdominal obesity was considered as WHR >0.5. WHR waist-to-height ratio.
BMI was calculated as weight in kilograms divided by the square of height in meters [BMI = weight (kg)/(height (m2))]. We included studies that determine the correlated eating patterns with obesity risk, and used variety of obesity measures: body weight status was determined using age- and gender-specific BMI percentiles, BMI z-scores, BMI SDSs, BMI cutoff points or WC. BMI was calculated as weight in kilograms divided by the square of height in meters [BMI = weight (kg)/(height (m2))]. Abdominal obesity was considered as WHR >0.5. WHR waist-to-height ratio. And WC measured midway between the lowest rib and the superior border of the iliac crest with an inelastic measuring tape at the end of normal expiration to the nearest 0.1 cm. The primary criteria used to define overweight and obesity include overweight: BMI or WC ≥85th percentile to 95th percentile, BMI = 1 standard deviation above the average; obesity: BMI or WC = 95th percentile, BMI = 2 standard deviations above the average. Children were classified as overweight if their BMI z-score was between the 85th and 95th percentile and obese if their BMI z-score was above the 95th percentile.
24 hour recall, 24 hour dietary recall method; DP, dietary patterns; FFQ, food frequency questionnaire; FFQA, Food Frequency Questionnaire for Adolescents; ns, not significant; SDSs, standard deviation scores; WC, waist circumference; WHR, waist-to-height ratio.
Dietary Pattern
Table 1 presents the 16 studies that examined the relationship between the dietary pattern derived from CA and/or FA and/or PCA and the risk of childhood obesity. Information on dietary exposures was collected by various methods.
The food frequency questionnaire (FFQ) was one of the most commonly used methods to assess individual long-term dietary intakes of foods and nutrients in the studies, and is appropriate for investigating dietary patterns on the basis of frequencies. The development of food lists (ranging from 5 to 350 items) is crucial for the success of an FFQ, with the median number being 79. The Food Frequency Questionnaire for Adolescents (FFQA) adapted from the FFQ was used to investigate dietary patterns on the basis of frequencies from a list of foods and portion sizes according to age (adolescents) and coherent with dietary patterns and eating habits of this population group. Dietary intake data were most commonly collected using an FFQ,57,59,62,64,66–68,71 followed by multiple 24-hour recalls,61,64–66,69 with two studies using FFQA,60,63 only one study used an eating habits questionnaire, 70 and one study using a 3-day weighed food diary. 19
In all the studies, children and adolescents were classified as overweight or obese according to the BMI cutoff points,57–59,68,69 BMI z-score,19,60–64,67 or BMI percentiles,65,71 with only one study using WC (95th percentile) 66 and one study using WHR (>0.5). 70
The studies reported between two and five dietary patterns each. The food items with high and low loadings in each pattern are presented in Table 1.
In Norway, Oellingrath et al.57,59 reported four dietary patterns: “snacking,” “junk/convenience,” “varied Norwegian,” and “dieting.”
Rodríguez-Ramírez et al. 58 reported five dietary patterns in the Mexican study: “rural,” “sweet cereal and corn dishes,” “diverse,” “Western,” and “whole milk and sweet,” and Ocampo et al. 62 reported three dietary patterns in the Colombian study: “Proteico/fibras,” “Bocadillo/snack,” and “traditional/almidon.” In Brazil, Nobre et al. 60 and Pinho et al. 63 reported three dietary patterns each: “mixed diet;” “snack” and “unhealthy;” 60 and “junk food,” “healthy,” and “traditional.” 63
In Australia, 19 three dietary patterns were reported: “traditional,” “processed,” and “health conscious.” In Lebanon, two studies64,67 reported two dietary patterns: “traditional Lebanese” and “Western.”64,67 Choy et al. 68 reported two dietary patterns from the Samoan island of Upolu: “modern” and “neotraditional.”
Kelishadi et al. 70 reported three patterns from Iran: “healthy,” “Western,” and “sweet.” In China, three studies61,65,66 reported three dietary patterns: “healthy,” “transitive,” and “Western” 61 ; “modern,” “traditional north,” and “traditional south” 65 ; “Chinese wester,” “Westernization,” and “meat diet” 66 ; and two studies69,71 reported two dietary patterns: “traditional Chinese” and “modern.”69,71
Dietary Patterns Associated with Childhood Obesity Risk
The studies that reported the association between dietary patterns and a significantly higher likelihood of being overweight or obese are given in Table 1. The OR for the relationship between dietary pattern and childhood obesity risk ranged from OR = 1.02; 95% CI (0.91–1.15) to OR = 3.55; 95% CI (1.80–7.03).
From the European countries, in Norway, Oellingrath et al.57,59 reported higher rates of obesity risk with a “dieting” diet, OR = 2.2; 95% CI (1.4–3.4) in children aged 9–10 years 57 and OR = 2.2; 95% CI (1.3–3.8) in children aged 12–13 years. 59
From the American countries, Mexican children adhering to a “Western” 58 eating pattern had a significantly higher likelihood of being overweight, OR = 1.53; 95% CI (1.4–2.7). In Brazil, children adhering to a “snack” diet, 60 OR = 1.29; 95% CI (0.5–2.8) and/or “junk food” diet, 64 OR = 1.05; 95% CI (0.6–1.6) had a significantly higher likelihood of being overweight. And in Colombia, Ocampo et al. 62 reported higher rates of obesity risk with a “Proteico/fibra” diet, OR = 1.64; 95% CI (1.3–2.0).
From the countries of Oceania, in Australia, 19 children adhering to a “traditional” eating pattern had a significantly higher likelihood of being overweight, OR = 3.12; 95% CI (1.1–1.7). On the Samoan island of Upolu, 68 those that followed the “neo-traditional” eating pattern presented a significantly higher likelihood of being overweight, OR = 3.43; 95% CI (1.03–11.4).
From the Asian countries, in Iran children adhering to a “sweet” 70 eating pattern had a significantly higher likelihood of being overweight, OR = 1.29; 95% CI (1.01–1.66). Lebanese children who presented a “Western”64,67 eating pattern had a significantly higher likelihood of being obese, OR = 2.31; 95% CI (1.12–4.73). In China, children adhering to a “Western” eating pattern had a significantly higher likelihood of being overweight, OR = 2.04; 95% CI (1.38–3.02), 61 as well as those who presented a “modern,” OR = 3.55; 95% CI (1.8–7.03), 65 and OR = 2.17; 95% CI (0.99–4.77), 69 “Westernization,” OR = 1.92; 95% CI (1.29–2.85), 66 and “traditional Chinese” eating pattern, OR = 1.02; 95% CI (0.9–1.1). 71
Mapping of High Positive Loadings Dietary Patterns and Their Key Components Associated with Childhood Obesity Risk
The studies that reported the association between dietary patterns and obesity risk are given in Table 1. A higher and lower likelihood of being overweight or obese and the relationship between the dietary patterns and their key components and the risk of childhood obesity were seen in the following dietary patterns.
Higher likelihood of being overweight or obese
From European countries: “dieting,” in Norway57,59 (cereals without sugar, juice between meals, artificially sweetened, carbonated, and noncarbonated soft drinks, and fat- and sugar-reduced yoghurt).
From the Asia countries: in China, “modern,” 69 “Western,” 61 “Westernization,” 66 and “traditional north” 65 (milk, sugar, coke, sprite, coffee, ice cream, fast foods, snacks, eggs, poultry, red meat, fatty meat, processed meats, pork, fish and shrimp, lamb, hamburgers and fried foods, wheat buns, processed products wheat, cakes, legume products, tubers, nuts, pickled and salted vegetables, starch tubers and light colored vegetables, fruit and fresh fruit, rice and rice products, refined grains, flour and flour products, and barbecued foods) and “traditional Chinese” 71 (wheat and other cereals, tubers, legumes, fruits, vegetables, fresh juices, eggs, low-fat dairy products, poultry, and fish). “Sweet” in Iran 70 (sweet snacks, cakes, cookies, pastries, biscuits, chocolate, soft drinks, packaged fruit juice, tea, cubed sugar, and granulated sugar); “Western” in Lebanon64,67 (poultry and eggs, red meat, mayonnaise, fast-food sandwiches, pizza, and pies).
From the America countries: in Brazil, “snack,” 60 “junk food” 64 (milk and dairy products, chocolate milk powder, sweet, savory biscuits, desserts, sugar, and filled biscuits, fruits, natural juices, breads, pasta, margarine, mayonnaise, whole dairy products, sweets, and fatty foods); “Proteico/fibra” in Colombia 62 (fruits, cheese, yogurt, cream cheese, vegetables, cooked vegetables, whole fruits, bread, whole foods, chicken, beef viscera, butter, tuna or sardines, fish, or seafood); “Western” in Mexico 58 (soft drinks, sugar, cakes, wheat, starch tubers, dishes with fat, salty snacks, fish and shrimp, beef, lamb and red meat, pork, poultry and eggs, mayonnaise, fast-food sandwiches, pizza and pies, rice, refined grains, and dark and light colored vegetables).
From the Oceania countries: “neotraditional,” on the Samoan island of Upolu 68 (vegetables, local starchy crops such as taro and breadfruit, coconut, fish, poultry and a low intake of desserts, pizza, and dairy products (milk, cheese, and ice cream) and infant food items (infant formula, breast milk, infant packaged food purées, and prepared meals)); and “traditional” in Australia 19 (grains, fruit, vegetables, and red meat).
Children aged from 1 to 6 years, adhering to a “snack,” 60 “Western,” 67 “neotraditional,” 68 “traditional,” 19 and “traditional Chinese” 71 diet; children aged from 5 to 18 years, adhering to a “Western,”58,61 “Proteico/Fibra,” 62 “modern,” or a “traditional north,” 65 “modern,” 69 and “sweet” 70 diet; children from 9 to 13 years, adhering to a “varied Norwegian” or a “dieting”57,59 diet and adolescents from 11 to 18 years, adhering to a “junk food,” 63 “Western,” 64 and “Westernization” 66 diet had a significantly higher likelihood of being overweight.
The studies show that, regardless of age, children aged 11 years, and/or adolescents aged 12–19 years, if the subjects had a diet based on obesogenic products (e.g., poultry and eggs, red meat, pasta, whole dairy products, margarine, breads, chocolate milk powder, sweets and desserts, sugar, filled biscuits, fatty foods, pizza and pies, fatty meat, hamburgers and fried foods, processed products, mayonnaise snacks, coke, sprite, coffee, ice cream, instant noodles, and barbecued food), they were at risk of developing obesity.
Lower likelihood of being overweight or obese
From European countries: in Norway “junk/convenience” 57 (high-fat, high-sugar processed, fast foods such as french fries, processed pizza, processed meat products, sweets, ice cream, and soft drinks) and “varied Norwegian” 59 (fish and meat, brown bread, regular white or brown cheese, lean meat, fish spread, fruit, and vegetables).
From the Asia countries: in China, “healthy” 61 (milk, yogurt, eggs, fruit, and vegetables), “traditional south,” 65 and “traditional Chinese” 69 [vegetables, rice, pork, and legumes rice, red meat, pork, poultry, vegetables (leafy), and fish], “Chinese and Western” 66 and modern 71 (rice, flour, whole grains, fresh vegetables, fresh fruit, poultry, eggs, freshwater fish and shrimps, sea fish, milk and dairy products, beans and bean products, nuts, snacks, sugar, and barbecued foods). “Western” in Iran 70 [salty snacks (cheese puffs, chips, and pretzels), beer, fast foods (sausages, burgers, and pizza), and coffee]; “traditional Lebanese” in Lebanon64,67 (vegetables, legumes, bread, rice, pasta and cereals, bulgur, fruits, fish, and vegetable oils).
From the America countries: “rural” in Mexico, 58 (corn tortilla, legumes, low intake of sweets and some cereals such as white bread, whole-wheat bread, rice, and noodles); in Brazil, “mixed diet” 60 (beef and pork, cooked beans, milk and dairy products, rice and tubers, farinaceous foods, sweet and savory cookies, cakes, leafy vegetables, fruits, and natural juices) and “healthy” 63 (skimmed dairy products, cereals, leafy vegetables, fruits, and natural juices); “traditional/Almidón” in Colombia 62 (sugar, honey, rice or pasta, fried foods dry grains, tubers or bananas, eggs, beef, veal, pork, rabbit, goat, coffee or tea, and chicken noodles).
From the Oceania countries: “modern” on the Samoan island of Upolu 68 (unprocessed red meats, whole grains, which are not traditional to Samoa, corn, french fries, butter, mayonnaise, nuts, and snack foods such as potato chips); “processed” in Australia 19 (snack foods, processed meats, beverages, and confectionary).
Risk of Bias in Individual Studies
The quality assessment of the included studies is presented in Supplementary Appendix Table A3. Of the 16 selected studies, 15 used a cross-sectional design, and 1 was a case–control study. 70 The selected studies were homogeneous, and all studies presented high quality according to the JBI-MAStARI.
Discussion
The results of this review indicate a positive association between certain eating patterns and the development of being overweight and obesity in children and adolescents in various parts of the world. These findings show that the analysis of dietary patterns and standards classifies foods into groups, taking into account the entire diet, describing eating behaviors 72 and the interactive effects of foods and nutrients consumed together, 27 thus monitoring these dietary patterns among children as a predictor of adult diseases. 73
It was decided to synthesize studies that analyzed dietary patterns through PCA, CA, or FA, since these allow the risk of developing diseases to be predicted, 74 groups of children with consistently healthy or unhealthy diets to be identified, and to provide a perception of the dietary impact on changes in body composition. 73
Different studies may give the same name to a dietary pattern, although this does not mean that the food items observed in these patterns are the same. They may vary due to the heterogeneity and specificity of the population (such as geographic, economic, and cultural characteristics), although several similarities can be observed. 57
For example, the specificity of the ins-and-outs of school dietary patterns analyzed was observed in the study by Vieira et al., 45 with 2979 Brazilian children, aged 1 to 6 years, in the southeast region. In this study, the “traditional” pattern within the school was associated with lower income and better nutritional quality (essentially composed of typical Brazilian foods such as rice, beans, high-fiber foods, vitamins, minerals, vegetables, cereals, processed meat, and sausages) and the “traditional” pattern outside the school (similar to the food patterns identified within the school), with a higher intake of saturated and trans fats, sodium, and fiber).
Morris and Northstone 82 also found differences in the analysis of dietary patterns of 11,868 children 10 years of age in the United Kingdom, where the traditional diet of children living in rural areas was healthier and had less “packed lunch/snack” consumption, whereas the traditional diet of children residing in urban areas presented high consumption of processed foods and “packed lunches/snacks.”
Also in the present review, the dietary patterns identified by the studies (Table 4) were given different names. Some, however, presented similarities in the food groups and, independent of geographical region, indicate that children adhering to eating patterns characterized by frequent ingestion of unhealthy potentially obesogenic foods (including fatty cheeses, sugary drinks, processed foods, fast food, candies, snacks, cakes, animal products, whole milk, and refined grains) are at increased risk of becoming overweight.19,57,59–62,64–66,68–70
Most studies in this systematic review presented results in keeping with the worldwide trend highlighted by the WHO, 81 which reported that currently the greatest frequency is in the consumption of foods that are rich in lipids, refined carbohydrates, bakery products, food of animal origin, and sugar-rich foods, with increasing obesity mainly due to the dependence on soft drinks and sweets, combined with the reduced consumption of fruits and vegetables in many countries. 75 A study by Kelly et al. 76 conducted in China, Indonesia, Malaysia, and South Korea attempted to determine the reach of television advertising and marketing of food for children. They found that the products most frequently advertised in all these countries were sugary drinks, with low rates of advertising of vegetables and fruits observed. 77
Some studies with children in different parts of the world also show this trend of consuming potentially obesogenic foods (baked goods, rich in sugar, such as breads, cakes, and cookies), such as that of Aranceta et al. 78 with 3534 children and adolescents in Spain, Ritchie et al. 79 in the United States with 2371 children aged 9 to 10 years, Fernández-Alvira 73 with 8341 European children (regions in Italy, Estonia, Cyprus, Belgium, Sweden, Hungary, Germany, and Spain), and Santos et al. 83 with 1247 children aged 6 to 12 years in Brazil. Romero-Polvo et al. 26 reported an association between the Western diet (high carbohydrates intake, soft drinks, snacks, and corn tortillas, and lower intake of fresh fruits and orange juice), with the risk of insulin resistance in 916 Mexican children and adolescents.
In this study, the dietary patterns that presented the weakest association with the risk of becoming overweight or obese were those in which children consumed more nonobesogenic foods (fruits, vegetables, whole grains, fish, nuts, legumes, and yogurt), that is, food classified as healthy with low levels of sugar and fat.59,61,63,64,66,67
Dietary patterns may also vary depending on the cultural and economic context, 52 as well as other factors, such as lifestyle and level of physical activity. Alshammari et al. 44 highlighted that, currently, living standards are on the rise, leading to complex changes in diet, lifestyle, and health.
In this review, some studies showed dietary patterns that are part of the local culture, with a low risk of obesity, such as the “mix-diet,” with foods from Brazilian culture 60 ; a rural diet; Mexican food 58 ; the diets of traditional Southeast Asia 65 and Chinese, 66 with traditional Chinese foods; and various Norwegian traditional foods. 59
Similar to the present review, several studies have associated dietary patterns with some other patterns. For example, in France, Lioret et al. 80 reported physical inactivity combined with the consumption of fried snacks as being a predictor of childhood obesity. Magriplis et al. 15 demonstrated that obese children in Greece are those who consume obesogenic foods, sleep less, and spend more hours per day studying. Hebestreit et al. 42 evaluated the availability of soft drinks during meals in Sweden, Germany, Hungary, Italy, Cyprus, Spain, Belgium, and Estonia and highlighted that parents are important predictors of sweet and fatty food intake in children. Conversely, some studies analyzed in Table 4 show that children who adhere to an obesogenic diet do not present a risk of developing obesity.19,57,58,60,62,70
One of the main strengths of this review was the analysis of studies that analyzed, through PCA, FA, and/or CA, the grouping of dietary patterns in children and adolescents and their associations with overweight and obesity, showing that these statistical methods provide an alternative for analysis of the effect of the diet as a whole instead of isolated nutrients.
Another strength of this review is that it allows the combinations of nutrients and/or foods to be demonstrated through these multivariate methods and the similarities and differences between countries to be highlighted, while simultaneously understanding that obesogenic behaviors are not unique. This premise provides support for future dietary interventions to be tailored to these specific groups, taking into account behavioral and cultural differences.
This review has several limitations. First, it is well known that the use of a cross-sectional design does not reach the confidence level of meta-analyses of randomized clinical trials. Another limitation in the included studies is that the dietary exposures were assessed using self-reports through food frequency questionnaires or 24-hour recall, both relying on memory and are, therefore, susceptible to inherent measurement errors and misclassifications. Finally, the studies included in this review were heterogeneous.
Conclusions
This systematic review suggests that children and adolescents who adhere to dietary patterns composed of obesogenic foods are more likely to develop obesity. Additional confounders, such as parental eating patterns and child physical activity, should be considered.
Footnotes
Acknowledgments
We are grateful to the Post-Doctoral National Program-CAPES (PNPD/CAPES) (Programa Nacional de Pós Doutorado, PNPD-CAPES) that granted Rafaela Liberali a postdoctoral scholarship.
Authors' Contributions
All authors were involved in analyzing the studies, reviewing and interpreting the results, and writing the article; no divergencies exist between any two authors.
Funding Information
This research did not receive any specific grant from funding agencies from the public, commercial, or not-for-profit sectors.
Author Disclosure Statement
No competing financial interests exist.
References
Supplementary Material
Please find the following supplemental material available below.
For Open Access articles published under a Creative Commons License, all supplemental material carries the same license as the article it is associated with.
For non-Open Access articles published, all supplemental material carries a non-exclusive license, and permission requests for re-use of supplemental material or any part of supplemental material shall be sent directly to the copyright owner as specified in the copyright notice associated with the article.