
Abstract
Background/Objectives:
Previous attempts to create national BMI curves for Iranian children and adolescents were limited to local databases. The objective of this study was to build national BMI growth charts for children and adolescents and to report the key percentiles and national cutoff points based on the data obtained from all provinces of Iran. We also aimed to compare our BMI curves to WHO and CDC curves.
Methods:
In each province, about 1000 children and adolescents (6–18 years) were randomly selected from the urban and rural areas by the multistage stratified cluster sampling method. Across the entire country, 240 trained researchers visited the participants' homes. After obtaining consent forms, these researchers gathered the demographic data, accurate anthropometrics, and BMI measurements. In the data screening and data cleaning levels, the outliers were removed. Then the data sets were smoothed using the log-transformation method. After this, they were converted to Z-scores based on normal distribution and then transformed back to the original scale. Finally, these data sets were used to determine each percentile.
Results:
A total of 22,718 final cleaned data were analyzed, including 10,921 (48.1%) boys and 11,797 (51.9%) girls. The normal BMI curves of Iranian children and adolescents and comparison to the WHO and CDC curves are presented here. This study introduces the new cutoff points for categorizing Iranian children and adolescents as underweight, normal, overweight, or obese, based on a large-scale national survey.
Conclusions:
The fifth BMI percentiles in Iranian boys and girls were significantly lower compared to WHO and CDC fifth percentile. Also, the 95th percentile curve in our study was significantly lower than the CDC 95th percentile curves in boys and girls.
Introduction
BMI is one of the most used general health indexes in clinical settings and research. 1 Childhood abnormalities in BMI are connected with increasing risk of several illnesses in later life.2–4 Due to the growth period of children and adolescents, the standard body weight, height, and hence BMI changes in every year of life are different in boys and girls. 5 Hence, standard percentiles and cutoffs are needed for children and adolescents, which are different from adults' cutoff points.
Standard BMI percentiles make it possible to assess whether a child has a fitting weight based on the gender, age, height, and weight. These percentiles can also be used to categorize children and adolescents as underweight, normal weight, at risk of becoming overweight, and obese. 6 Also, standard BMI percentiles depend on environmental and genetic (ethnicity) diversity.7,8 Hence, standardizing the BMI percentiles based on sex and age for each nationality is very important.
In Iran a few attempts have been done to normalize BMI in children and adolescents,9,10 but all of them had some limitations such as lack of representation of socioeconomic, geographic, and ethnic variability. Also, their sample sizes were relatively small.
This study aimed to investigate and normalize the BMI percentiles and elucidate the BMI growth charts in children and adolescents aged 6–18 years. We also intended to compare the BMI percentiles with those of WHO and CDC.
Materials and Methods
Study Design
This study was designed to be conducted along with the Iranian Children and Adolescents' Psychiatric Disorders Study (IRCAP), a national cross-sectional survey implemented in all provinces of Iran. 11
Sampling
Study samples were gathered consistently from all provinces in Iran. On average, 1000 samples were randomly selected from each province by the multistage stratified cluster sampling method. One hundred sixty-seven blocks in each province were randomly determined according to the postal code provided by the local post office. In each cluster head, six samples were selected using permuted-block design, including three girls and three boys in different age groups (6–9, 10–14, and 15–18 years old blocks). Samples were gathered from the urban as well as the rural areas of the provinces (proportional to population size). This way, children and adolescents in equal blocks of age and sex were randomly selected from the entire country.
Inclusion and Exclusion Criteria
We included the 6–18 years old children and adolescents with Iranian citizenship. We excluded those who did not consent to participate.
Procedure
This study has used the data set of IRCAP study with 30,532 participants. On average, 8 trained researchers in each province and in total 240 trained researchers visited the participants' homes. First, they introduced themselves and the study protocol, inviting the parents to involve their children in the study. The informed written consent form was obtained from parents when adolescents and children assented to participate.
The researchers collected the demographic data as well as the anthropometrics and other measurements. The BMI was then measured using the Quetelet index. 12 The researchers were trained to gather the latest and most accurate height and weight of the subjects based on the measurements taken over the past month by parents or health care professionals in public health centers (in both urban and rural areas of Iran, children and adolescents are regularly referred to local public health centers for measuring the anthropometric indices by health care professionals, vaccination, nutritional, and health education as a part of the public health care promotion program). The researchers were instructed to remove the measurements dated over 1 month and uncertain measurements (7802 uncertain measurements were not included).
Furthermore, to ensure the maximum validity of the data collections, the central project management team performed a large audit process. We randomly selected 171 clusters, which included 1023 children and adolescents. Then, we objectively measured the height to the nearest centimeter with a standard height gauge while the children were standing upright without shoes and their body was aligned against the wall. The accurate body weights were measured while the children were in a minimal dress and were standing directly on a calibrated digital scale. As a part of the quality assessment process, the central project management team compared the BMI distribution of 1023 objective measurements with 1603 subjectively collected BMIs. The insignificant difference by t-test confirms the similarity of the two distributions (t = 0.572, df = 2084, MD = 0.09, p = 0.568).
Data Screening and Data Cleaning
In total, 22,730 valid data were collected from all provinces (Fig. 1). First, the data file was split based on age and gender. During the data screening process, outliers that overshadowed the normality of curves were identified using the stem and leaf descriptive method and excluded from the analysis. This way, 12 outlier values were identified and removed from the data file. Deletion of outliers (that were very small in number; n = 12) across 26 age and sex groups of BMI (13 age groups in 2 genders) had no effect on determining the BMI percentiles and only would extend the two spectra of distribution. Finally, the BMI for 22,718 children and adolescents were entered into the data cleaning and statistical analyses processes.

Missing Data Analysis
The statistic experts (Allison and Meyers et al.) recommend that when a certain missing value has nothing to do with its hypothetical value and with the values of other variables (i.e., missing values are completely at random), and the number of missing values is high, it is best to use deletion instead of imputation, especially if the sample size is so high that the removal of these individuals does not result in a standard error increase.13,14 Furthermore, we tried to perform the missing value analysis to test the absence of bias in the results from the removal of missing data. According to Tabachnick and Fidel, to claim that the deleted items have not produced bias in the results, there should not be any significant difference between the deleted (missing) and the analyzed items for the key research variables. 15 In this study, the reported BMI is dependent on two key demographic variables, namely age and sex. The comparison between the two groups (missing and analyzed values) regarding these two variables shows that there is no statistically significant difference between the missing data group and the analyzed group regarding age and sex (for age: t = 1.97, p = 0.231, 95% CI = −0.152 to 0.037; for sex: chi-square with continuity correction = 2.514, p = 0.110). Therefore, the valid cases that have been analyzed in this study are unbiased representative of the research community.
Data Cleaning and Statistical Analyses
After the original data file was finalized, the normality of the data was analyzed using the Kolmogorov–Smirnov test. The results show that normalization is not established in all cases, and the distribution of data is skewed, since the allocation of people based on BMI percentiles is based on the norm-referenced tests; this calls for the transformation of data to eliminate skewing. Furthermore, this transformation leads to data smoothing, so the log-transformed method was used for this sake. In the first step using the linear regression method, and working from raw data, new data were simulated. In the second step, the transformed data were converted to Z-scores based on normal distribution and then transformed back to the original scale with the formula: (Z score*std) + μ. Then, these data were used to determine each percentile.
Ethics
The Ethics Committee Board of the National Institute for Medical Research Development (NIMAD) has approved the study protocol (the ethics code of IR.NIMAD.REC.1395.001). We described the study protocol to parents and children before the subjects' enrollment, and written informed consent forms were obtained from parents. Furthermore, participation into the study required the assent of children. Also, the privacy and confidentiality of the participants were preserved.
Results
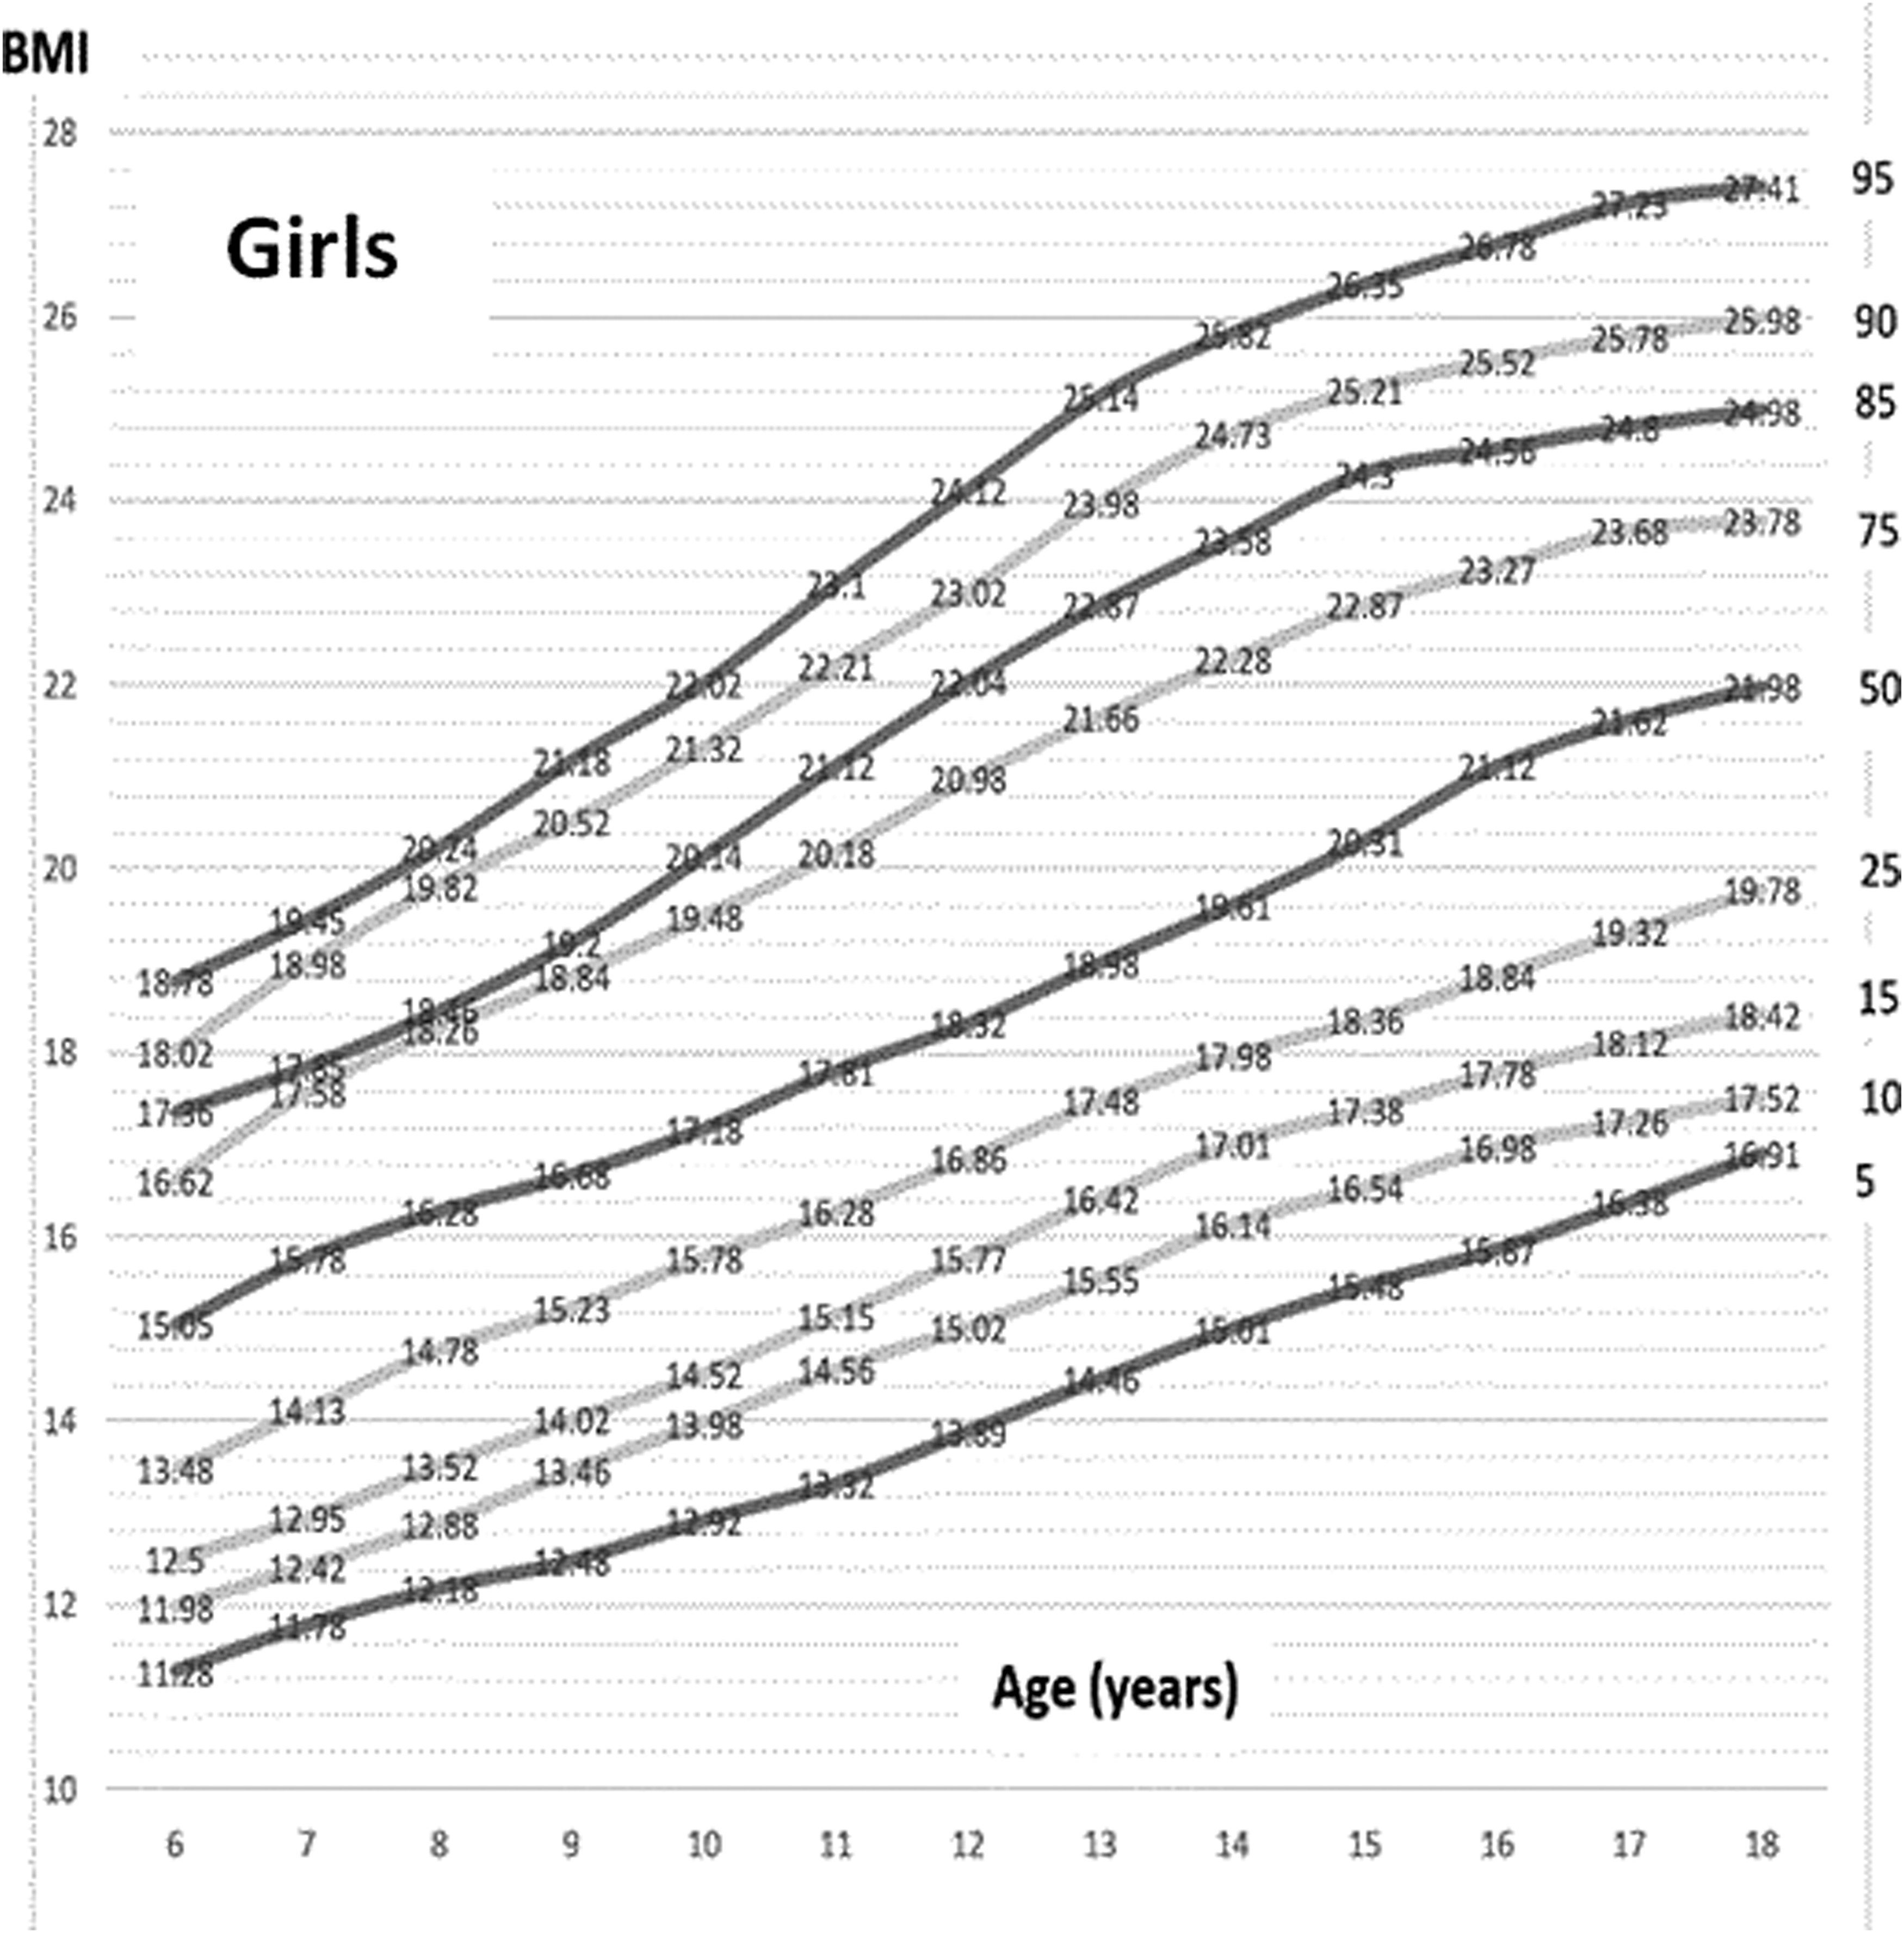
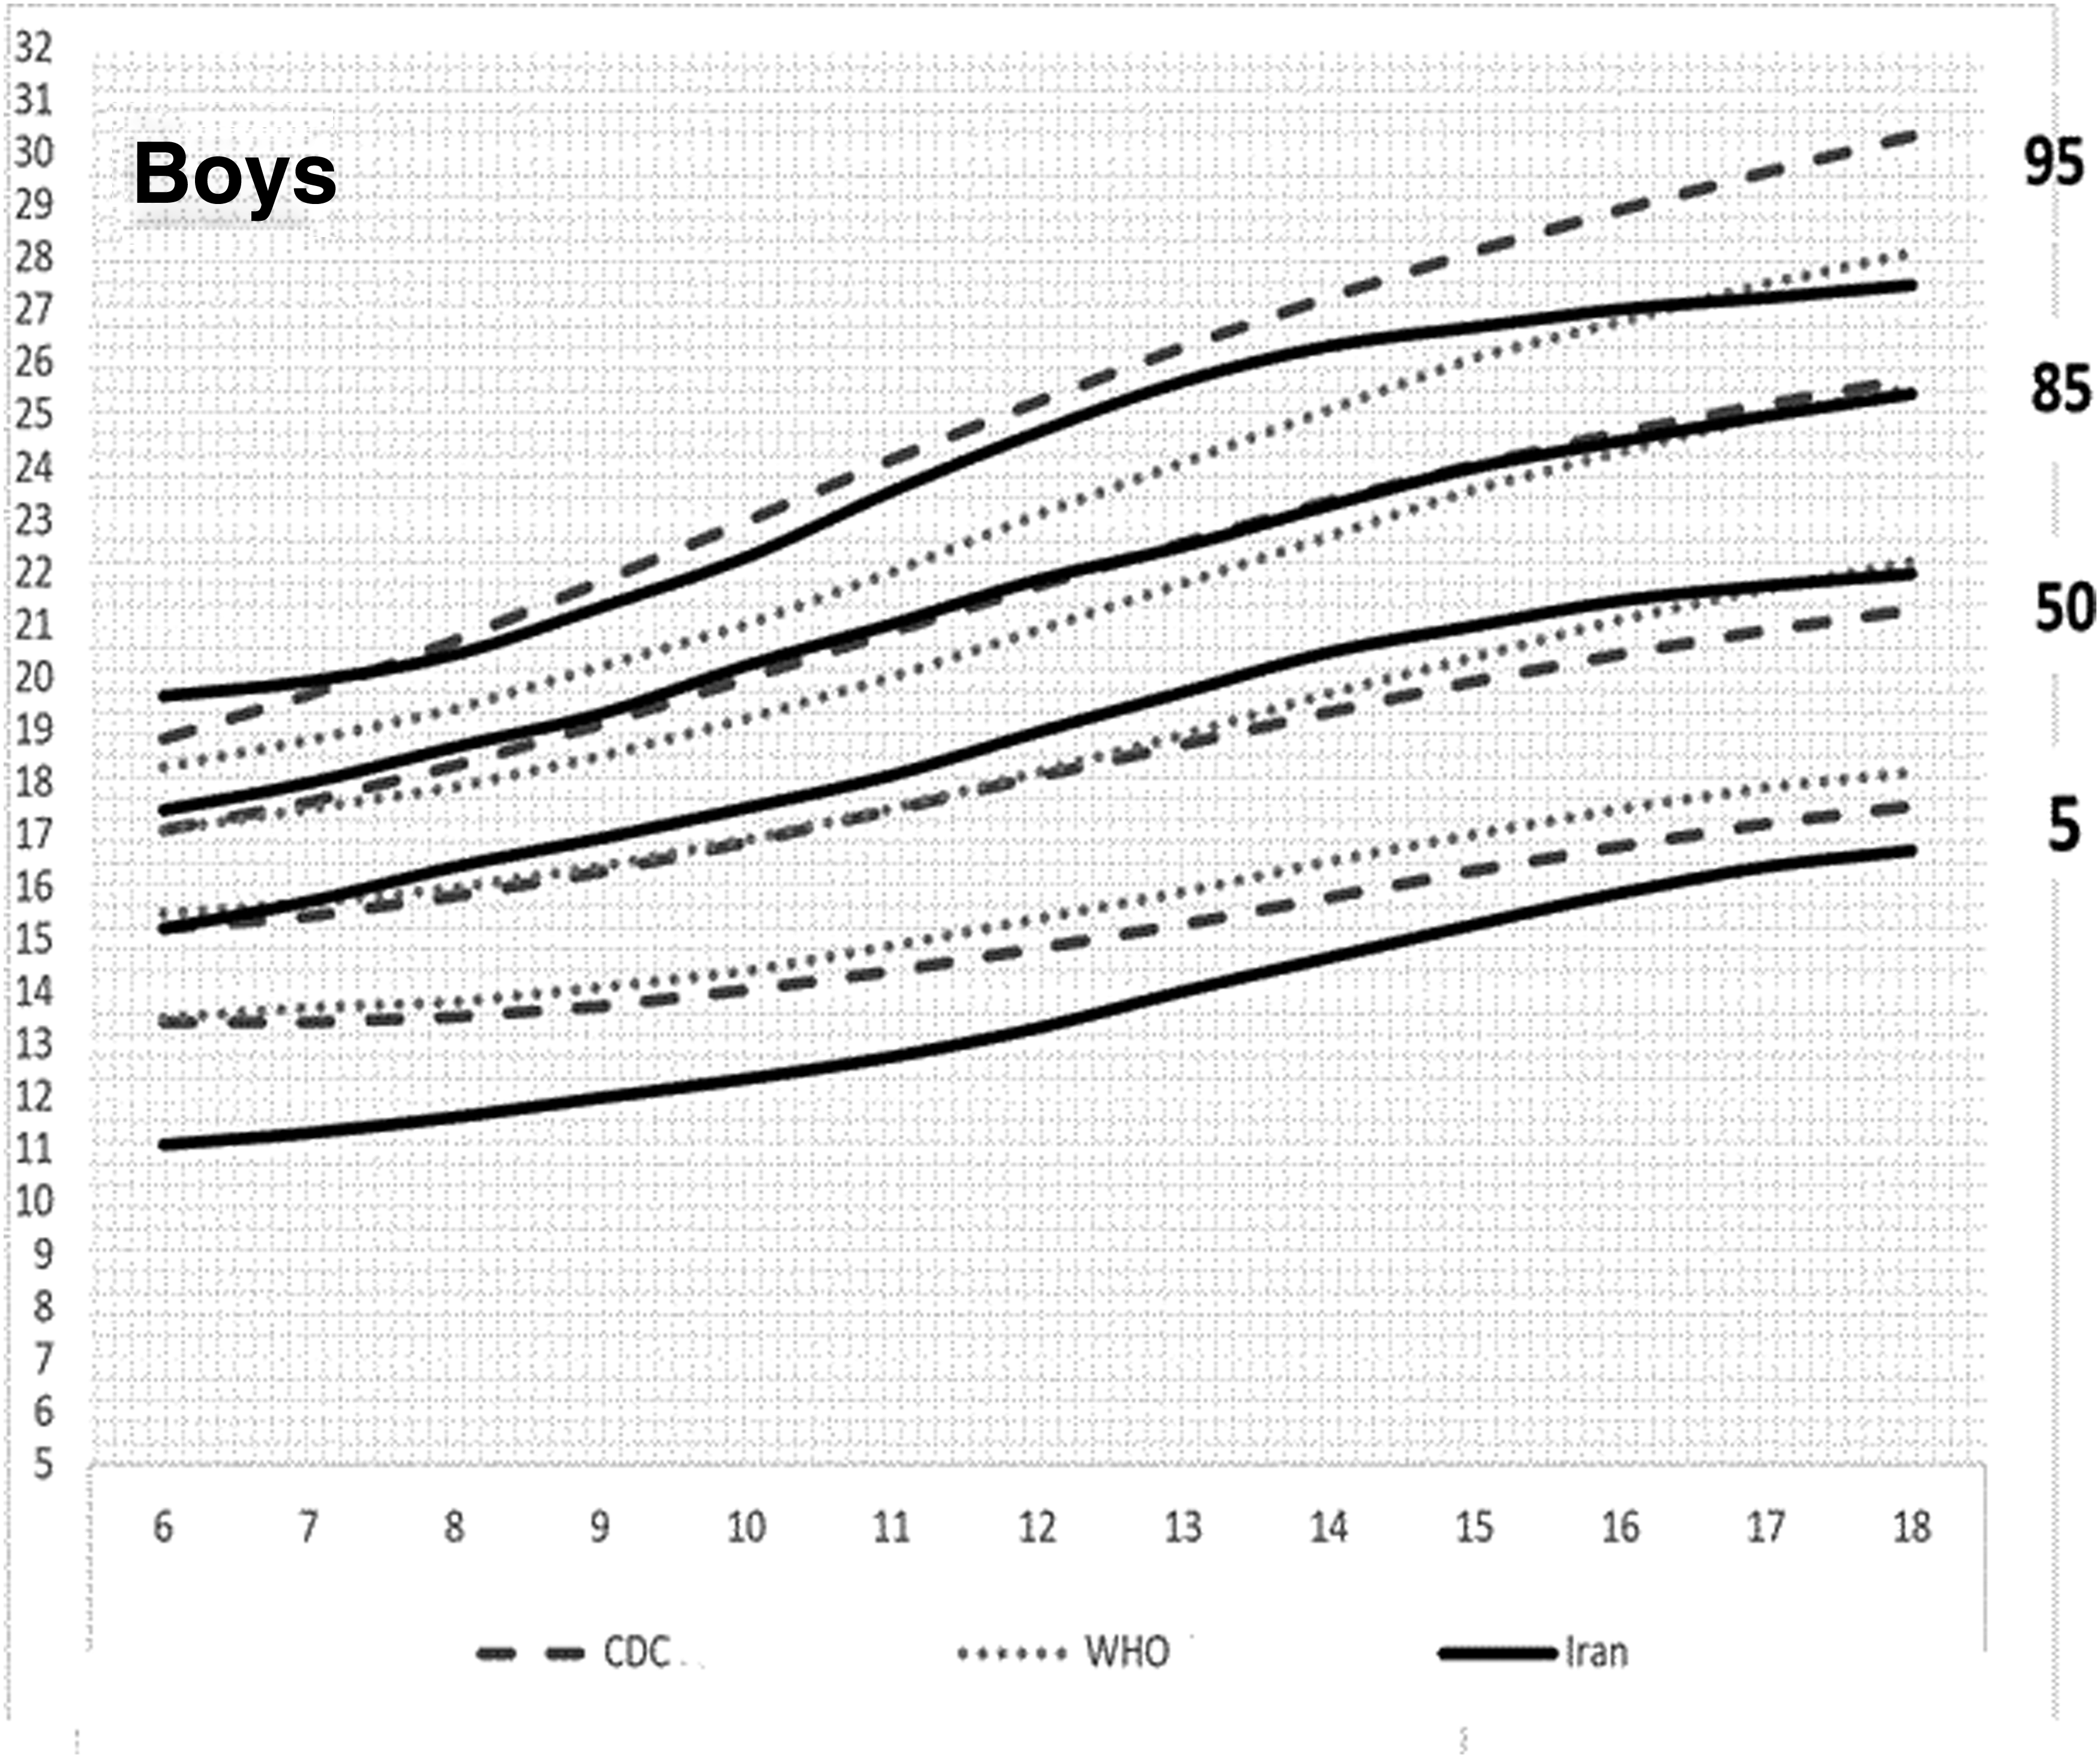
A total of 22,718 final data were analyzed, including 10,921 (48.1%) boys and 11,797 (51.9%) girls. The Kolmogorov–Smirnov test shows normality for the BMI of the back transformed distribution. Furthermore, there is no significant difference between this distribution and the normal distribution (Table 1). Also, the fitness of the transformed distribution with the main distribution shows no significant difference between the before and after the logarithmic transformation in the girls and boys groups (Table 2). The Table 3 shows the BMI of Iranian children and adolescents percentiles by age and sex. The values of the 5th, 85th, and 95th percentiles presented in this table introduce the new cutoff points for categorizing the Iranian children and adolescents to underweight, overweight, and obesity groups according to age and gender. Figures 2 and 3 show the BMI percentile curves for Iranian children and adolescent girls and boys. Figures 4 and 5 compare the BMI percentile curves for Iranian children and adolescent girls and boys with the CDC and WHO reference data. The objective comparison between the BMI of Iranian children and adolescents (6–18 years old) with CDC and WHO is presented in Table 4.


Normality of the BMI Z-Scores by Kolmogorov–Smirnov Test
Comparison of BMI Distribution before and after Transformation
Percentile Values of BMI (kg/m2) by Age and Sex for Iranian Children and Adolescents
The values of the 5th, 85th, and 95th percentiles presented in this table, introduce the new cutoff points for categorizing the Iranian children and adolescents to underweight, overweight, or obesity groups according to age and gender.
Comparison between BMI of Iranian Children and Adolescents (6–18 Years Old) with CDC and WHO
CI, confidence interval; MD, mean differences.
Discussion
Our results present the key standardized percentiles of BMI for children and adolescents (6–18 years old) in urban and rural areas of Iran. Up to now, this is the largest epidemiologic study gathering the children and adolescents' BMI from all provinces of Iran. The first attempt to standardize the BMI in Iran was performed in 1990 to 1992 by Hosseini et al. 10 They gathered the heights and weights of 3301 children aged 2–18 years in urban areas of Tehran. The overall pattern of BMI percentile curves in their study is very similar to our results.
Next attempt to reach the reference values of BMI in Iranian population performed on 2935 school-aged children in Tehran; 2003 to 2004 by Razzaghy Azar et al. 16 Their results in girls were similar to our results, but in boys, the curve line in 97th percentile in their study was higher than ours, and also in contrast to our study was higher than the US 97th percentile. The third percentile for BMI in Iranian boys and girls was lower compared to the US third percentile. This was the same in our study regarding the fifth percentile.
The other attempt was performed by Mansourian et al. 17 They gathered the height and weight of 5430 students between 10 and 19 years old. The data on their study are presented on age groups and are consistent with the WHO growth charts. Similarly in our study, the BMI curves were very near to the WHO BMI curves, except the fifth percentile which was lower in Iranian children. Mansourian et al. in a similar finding showed that smoothed BMI-for-age histograms for Iranian boys and girls were a bit skewed to the left, showing the fact that the BMI in children in Iran is normally lower than the WHO and CDC standard BMI. This is also in line with other findings which report the ethnic variances in body weight, height, and BMI between nations.18,19
The cutoff point percentiles for assessing the children and adolescents normal body weight are the 5th, 50th, 85th, and 95th percentiles for specific age and sex. 20 These cutoff points are better to be nationalized in every country due to environmental and genetic diversities.21,22 Figures 4 and 5 compare the Iranian children and adolescents' BMI curves with the CDC and WHO percentile curves. The fifth BMI percentile curves in all ages' boys and girls are lower than both WHO and CDC curves. The Table 4 shows that these differences are statistically significant. This shows that the Iranian children and adolescents are genetically lower in BMI compared to the American children and adolescents. Hence, previous epidemiologic studies which performed in Iran using the WHO or CDC cutoff points may have overestimated underweight amount among children and adolescents in Iran. The 50th percentile and 85th percentile curves in our study are very close to the curves of WHO and CDC. The 95th percentile curve in our study is very similar to the WHO 95th percentile curve, but is significantly lower than the CDC 95th percentile curves. It means that epidemiologic studies on Iranian children and adolescents that have used the CDC 95th percentile cutoff points may have underestimated the obesity rates among children and adolescents in Iran. These findings are similar to the results of Hosseini et al., 10 which had comparisons of the BMI percentile of the children and adolescents in Tehran with the US children and adolescents.
Some sociodemographic varieties, nutritional, and genetic factors may be responsible for lower 5th and 95th percentiles in Iran. Children and adolescents from different parts of the world may grow differently as results of environmental and genetic factors. 23 Low et al. in a literature review of optimal BMI cutoffs for Asian societies identified 13 studies in Asia that suggest lower BMI cutoff points for Asian populations compared with WHO international cutoffs. 24 Schwandt et al. showed that anthropometric indices and growth among Iranian children and adolescents have different patterns compared with other ethnicities. 25 So using the US curves and even the WHO norms for some countries may be misleading. The longitudinal studies are needed in countries with variant ethnicities such as Iran to find the long-term health consequences of children and adolescents with lower and upper range of BMI.
Conclusions
The BMI abnormality in children and adolescents is known as a risk factor for several diseases in later life. Hence, the cutoff points for abnormalities in BMI are important for health systems.
On the contrary, varieties in genetic, ethnic, environment, and sociodemographic factor in every nation necessitate localizing the BMI percentiles in every nation. For example, the fifth BMI percentile was lower in Iranian children and adolescents compared to WHO and CDCs fifth percentile. Hence, previous epidemiologic studies which was performed in Iran using the WHO or CDC cutoff points may have overestimated underweight amount among children and adolescents. Also, the 95th percentile curve in our study was lower than the CDCs 95th percentile curves. It means that previous epidemiologic studies on Iranian children and adolescents that have used the CDC 95th percentile cutoff points may have underestimated the obesity rates among children and adolescents.
The current study was the latest and the largest epidemiologic BMI survey performed in all provinces of Iran. The participants of this study are representative of all ethnicities who live in Iran, and hence, the results of current study could be generalized to all Iranian children and adolescents 6–18 years old. This study introduces the new cutoff points for categorizing the Iranian children and adolescents to underweight, overweight, or obesity each year between 6 and 18 years old and for both genders, based on a large-scale national survey in Iran.
Limitations
One of the limitations in our study may be the possible observer bias that we tried to decrease, first by training the researcher before the study, then by accurate monitoring and data screening processes, and lastly by statistical methods.
Footnotes
Acknowledgments
The authors are grateful to the “National Institute for Medical Research Development” (NIMAD). We also thank all the participants, families, and those who are involved in performing this survey.
Authors' Contributions
M.R.M., the main investigator, received the grant, involved in designing and performance of the survey, and preparing and drafting the article; S.A.M., involved in development of research idea, involved in designing and performance of the survey, and involved in writing and drafting the article; Z.H., involved in development of research idea, analyzed the results, and involved in preparing and drafting the article; A.K., N.A., K.K., A.A., and H.Z. involved in study design, managed the study performance, and involved in preparing and drafting the article.
Funding Information
The National Institute for Medical Research Development (NIMAD) has granted this national survey (Grant No. 940906).
Author Disclosure Statement
No competing financial interests exist.