




Abstract
Abstract
Background:
Obesity was often associated with low high-density lipoprotein (HDL) cholesterol concentration, which is an established cardiovascular risk factor.
Objectives:
To evaluate the association of HDL-cholesterol concentration with fat and muscle mass in children and adolescents.
Methods:
Data of the National Health and Nutrition Examination Survey (1999–2004) were used to estimate fat and muscle mass by dual-energy X-ray absorptiometry (DXA) of the participants who had also an examination of their lipid profiles. Fat mass was assessed by DXA-determined fat mass index (FMI). Muscle mass was operationalized by appendicular lean mass index (LMI). Low HDL-cholesterol concentration was defined as <40 mg/dL.
Results:
For the evaluation of the association of HDL-cholesterol concentration with FMI and LMI Z-scores, the data of 6288 children and adolescents (age 8–19 years) (2535 females) were eligible. In the study population, the prevalence of low HDL-cholesterol concentration increased with rising FMI and appendicular LMI Z-scores.
Conclusions:
The study results suggested that there is a counterintuitive, inverse association of muscle mass and HDL-cholesterol concentration.
Introduction
The World Health Organization defines obesity as abnormal or excessive fat accumulation that may impair health. 1 Obesity is no longer a public health concern just in adulthood. The prevalence of obesity (assessed by Z-scores for BMI) among children and adolescents in the United States increased in the last decades 2 and was 18.5% in 2015–2016. 3 Obesity among children and adolescents was associated with higher risk of adult obesity and was a major risk factor for several comorbidities such as hypertension and insulin resistance that could lead to cardiovascular diseases. 4 In addition, it was reported that children with obesity had significantly higher plasma triglyceride (TG) and significantly lower high-density lipoprotein (HDL) cholesterol concentration than nonobese children. 5
On the contrary, an inverse correlation of HDL-cholesterol concentrations and coronary heart disease event rates was reported. 6 This correlation was independent and stronger than for low-density lipoprotein (LDL) cholesterol.
Although increased BMI is an established risk factor influencing lipid and lipoprotein concentrations, 7 it could not distinguish between fat and muscle mass. 8 Thus, there is an increasing interest in the study of body composition as a risk factor for cardiometabolic disorders in children and adults.9,10
Previous studies mostly showed clinically relevant correlations between fat mass and elevated plasma TG and cholesterol concentrations.11–14 It is assumed that obesity in combination with low muscle mass (sarcopenic obesity) may be associated with exaggerated metabolic deregulation. 15 In accordance with this assumption, there is evidence that physical activity may improve lipid and lipoprotein concentration to reduce cardiometabolic risk factors.16,17 On the contrary, there are only a few studies evaluating the impact of muscle mass on cardiometabolic risk factors, especially on HDL cholesterol in children and adolescents. Recently, it was reported that low muscle mass is associated with lower HDL-cholesterol concentration in children and adolescents.18,19
Almost 20 years ago, Pietrobelli et al. 7 reported a counterintuitive inverse association of muscle mass and HDL cholesterol in adults. Comparable results were reported also by other authors in adolescents and in young and middle-age adulthood.20,21
Aim of our study was to evaluate the association of HDL-cholesterol concentration with fat and muscle mass in children and adolescents.
For the sake of clarity, we omitted the examination of the influence of fat and muscle mass on total cholesterol and LDL cholesterol.
Methods
Quantifying Fat and Muscle Mass
Different methods are available to quantify fat and muscle mass. One of the most accurate methods to distinguish fat, bone, and lean body mass is dual-energy X-ray absorptiometry (DXA).
22
Lean body mass presents the fat-free and bone mineral-free component of the body and correlates highly (Pearson's r = 0.82) with muscle mass.
23
Initially, it was supposed to use compartment-specific indexes normalized to height as superior parameter to monitor fat and muscle mass status [fat mass index (FMI) =
Study Design
In the years 1999–2004, whole-body DXA scans were performed on randomly selected, noninstitutionalized participants of the National Health and Nutrition Examination Survey (NHANES) study from the age of 8 years. 26 A complex, multistage, probability study design was used for the patient recruitment. 27 We included the DXA data of the three major ethnicities in the United States (non-Hispanic white, non-Hispanic black, and Mexican American). Exclusion criteria were a positive pregnancy test or the declaration of pregnancy upon recruitment, as well as weight and height surpassing the limit of the Hologic DXA system (weight >136 kg or height >196.6 cm). We further excluded individuals with missing values of height or weight, and all individuals were older than 19 years old.
For all included children and adolescents with DXA data, it was checked whether
Nonfasting HDL-cholesterol concentrations were eligible and whether
Fasting TG concentrations were eligible.
The study was reviewed and approved by the National Center for Health Statistics Institutional Review Board. Written consent was obtained from all participants aged ≥18 years, while parental consent and child assent were obtained among children and adolescents.
DXA Measurement, Data Acquisition and Reference Centiles
The whole-body DXA scans were conducted using a Hologic QDR-4500A fan-beam densitometer (Hologic, Inc., Marlborough, MA) in combination with the Hologic software v826:a3. The dataset was downloaded from the CDC server on the August 21, 2017 (https://wwwn.cdc.gov/Nchs/Nhanes/Dxa/Dxa.aspx).
The laboratory dataset was downloaded from the CDC server on November 11, 2019 [https://wwwn.cdc.gov/nchs/nhanes/search/DataPage.aspx?Component=Laboratory&CycleBeginYear=1999 (2001, 2003)].
While there are pediatric reference centiles for FMI (based on the NHANES data 1999–2004), these are not ethnicity-specific. 28 Since in a previous study, there were relevant difference in FMI between the three included ethnicities, 29 we generated ethnicity-specific reference percentiles with all available DXA data. Because there are no reference centiles for appendicular LMI in children, reference centiles for appendicular LMI were created.
The NHANES investigators replaced missing values using a multiple-imputation methodology and published five random, independent datasets without missing values to rule out for bias. We averaged these five datasets in one final dataset, since no methodology is known to average five independent percentiles.
Creation of Reference Centiles
We used Cole and Green's lambda-mu-sigma (LMS) method
30
to generate centile curves, applying a modified Box-Cox transformation to calculate ZLMS-scores (“a” corresponds to age):
We applied cubic spline interpolation to adjust the median value [M(a)], the coefficient of variation [S(a)], and the skewness [L(a)] of the curve to the data with the maximum likelihood estimate. The functions M(a), S(a), and L(a) are age-related, and so they can only jointly determine the Z-score of a given data pair of age a and FMI and LMI. We performed a Q-Test by Royston and Wright and Worm Plot by van Buuren and Fredriks to assess the goodness of fit of the model.31,32
We calculated the LMS model using R version 3.5.1 (R Foundation for Statistical Computing, Vienna, Austria) in combination with the packages GAMLSS (version 5.1.2). 33 We used the function gamlss with the distribution Box-Cox Cole and Green (BCCG). If the creation of reference centiles was not possible due to relevant kurtosis (because the function gamlss did not converged), the distribution Box-Cox power exponential (BCPE) was used instead. 34 Beside M(a), S(a), and L(a), the BCPE distribution had another parameter denoted by T(a) (τ). The BCPE distribution was reduced to the BCCG distribution when T = 2. Thus, the BCCG distribution was a special case of the BCPE distribution, also called LMSP method. 34
Definitions of Adverse HDL-Cholesterol and TG Concentrations
In 1992, the National Cholesterol Education Program recommended to define low HDL cholesterol as a concentration below 35 mg/dL for children and adolescents. 35 Recently, the American College of Cardiology and the American Heart Association recommended to increase the cutoff value to 40 mg/dL. 36 In this study, we used the cutoff of 40 mg/dL to define low HDL cholesterol.
Analysis of the Relationship of Body Composition and HDL-Cholesterol Concentrations
Linear and multivariate logistic regression was performed to evaluate the relationship between body composition (fat and muscle mass) and HDL-cholesterol concentration.
To evaluate the relationship of FMI and appendicular LMI, linear regression was performed. To assess the relationship of TG and HDL-cholesterol concentrations, locally estimated scatterplot smoothing (LOESS) regression was used to calculate because of the nonlinear relationship. The inferential statistics of the LOESS regression was performed with the method described by Jacoby. 37
The mediation analysis by Baron and Kenny 38 was used to evaluate how much of the association between HDL-cholesterol concentration and body composition was mediated by TG concentration. 38
Statistical Analyses
We explored the normality of distribution using Shapiro–Wilk test. We used t-test to compare means of subgroups of normally distributed variables and Mann–Whitney U-test for variables with nonnormal distribution. Analysis of variance or the Kruskal–Wallis' test was used to compare more than two groups. We used the Chi-square or Fisher exact test to study variables with binary distribution.
If not stated otherwise, results are given as mean (1 standard deviation). Statistical analyses were performed using R version 3.5.2 (R Foundation for Statistical Computing).
Results
Study Population for Generating of FMI and Appendicular LMI Reference Centiles
The demographics of the study population were given in the Supplementary Table S1. In total, the DXA results of 7006 children and adolescents (2855 females) were eligible.
Creation of Reference Centiles
Because of the distribution of the raw data, the BCPE distribution was used for the reference centiles for FMI and the BCCG distribution for the reference centiles for appendicular LMI. The tabulated reference centiles for FMI and appendicular LMI are presented in the Supplementary Tables S2, S3, S4, S5, S6, S7, S8, S9, S10, S11, S12, S13, S14, S15.
Usually, special software is needed to calculate the exact Z-scores of the BCPE distribution. 34 But we described recently a method to approximate (very accurately) the Z-scores of the BCPE distribution with the help of the Z-scores of the BCCG distribution by a hyperbolic sine function. 29 The coefficients of the exact hyperbolic sine function for each sex and ethnicity are given in Supplementary Table S8. A detailed description of the calculation method is given elsewhere. 29
The reference centiles for appendicular LMI based on the BCCG distribution. Therefore, the Z-scores can be calculated by the formulas (1) and (2) (see Methods section).
Study Population for Evaluating HDL Cholesterol and TG Concentrations
Children and adolescents who did not have HDL cholesterol and TG concentrations measured (n = 673) or were already treated with drugs that may have an effect of the HDL-cholesterol concentration such as statins, estrogens, androgens, β-blockers, and carbamazepine (n = 45) were excluded from statistical analyses. For the evaluation of the interaction of HDL cholesterol with FMI and LMI Z-scores, the data of 6288 children and adolescents (2535 females; Table 1) were eligible.
Study Population for High-Density Lipoprotein Cholesterol and Triglyceride Analysis by Ethnicity and Sex
Data are presented as mean (±standard deviation) and count.
Of the 6288 children and adolescents in the total sample, 2503 participants (989 females) reported that they had fasted for 8.5–23 hours before phlebotomy in the morning examination (Table 1).
Univariate Analysis of the Interaction of HDL-Cholesterol Concentrations with Body Composition
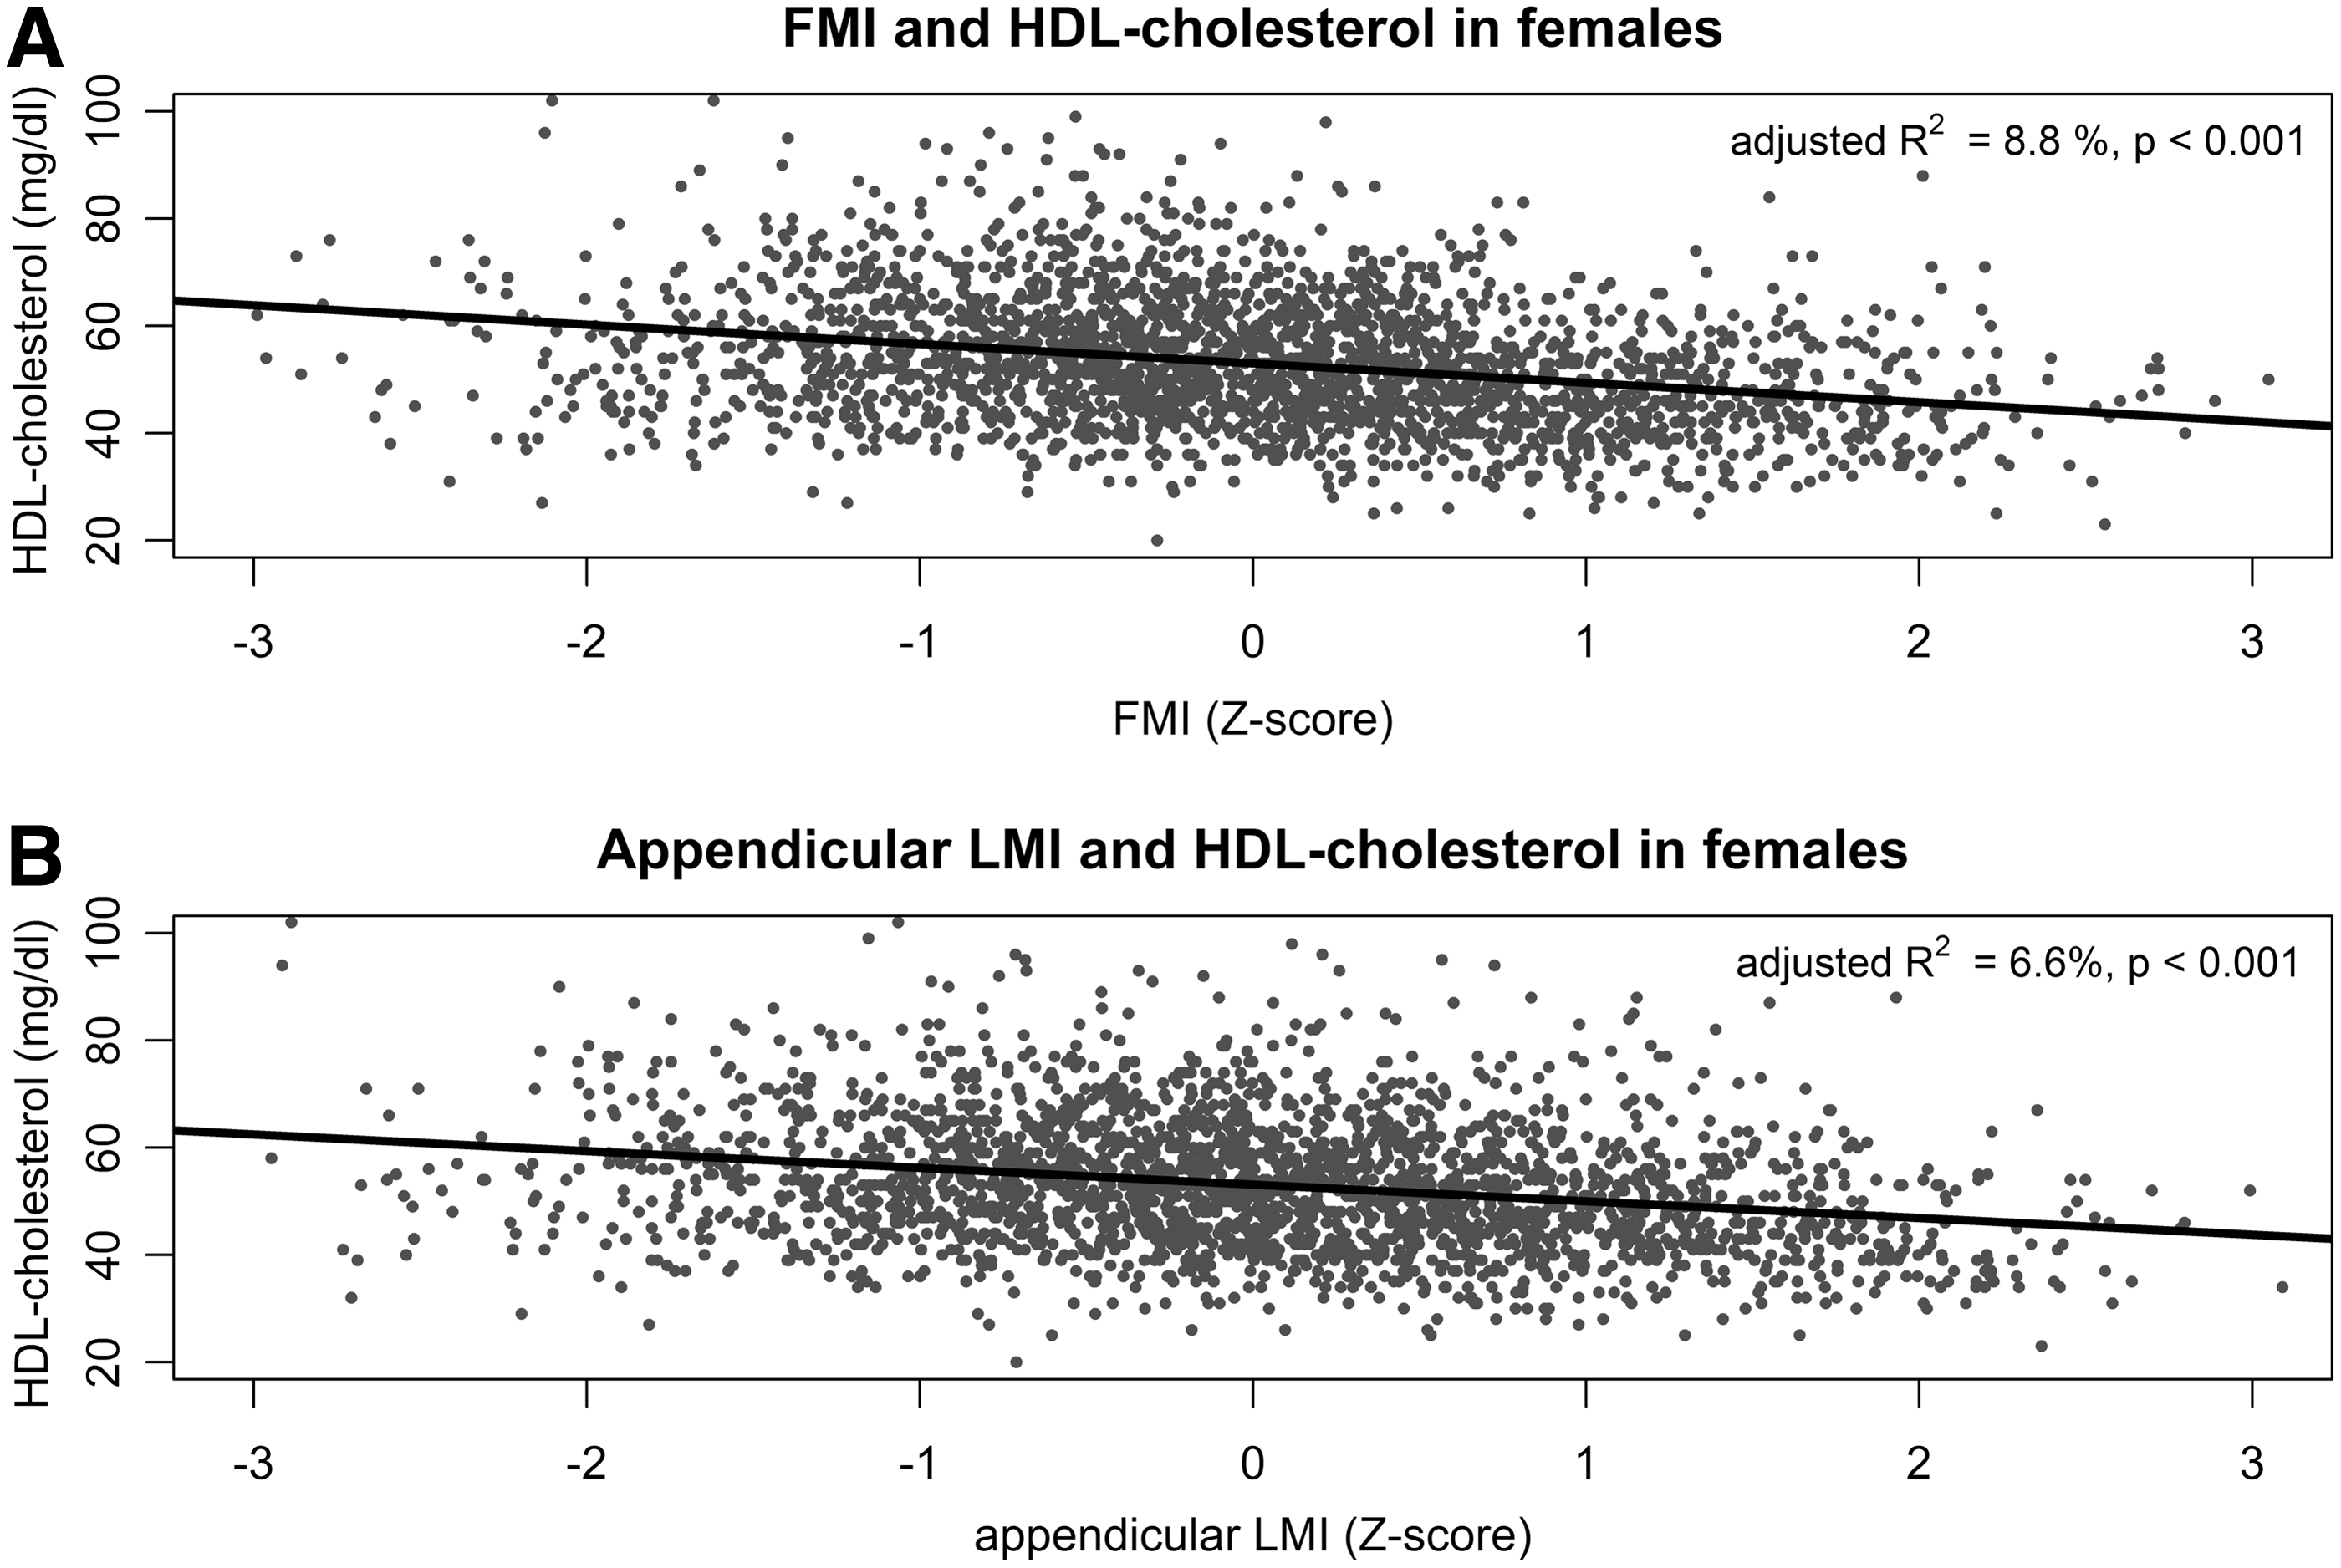
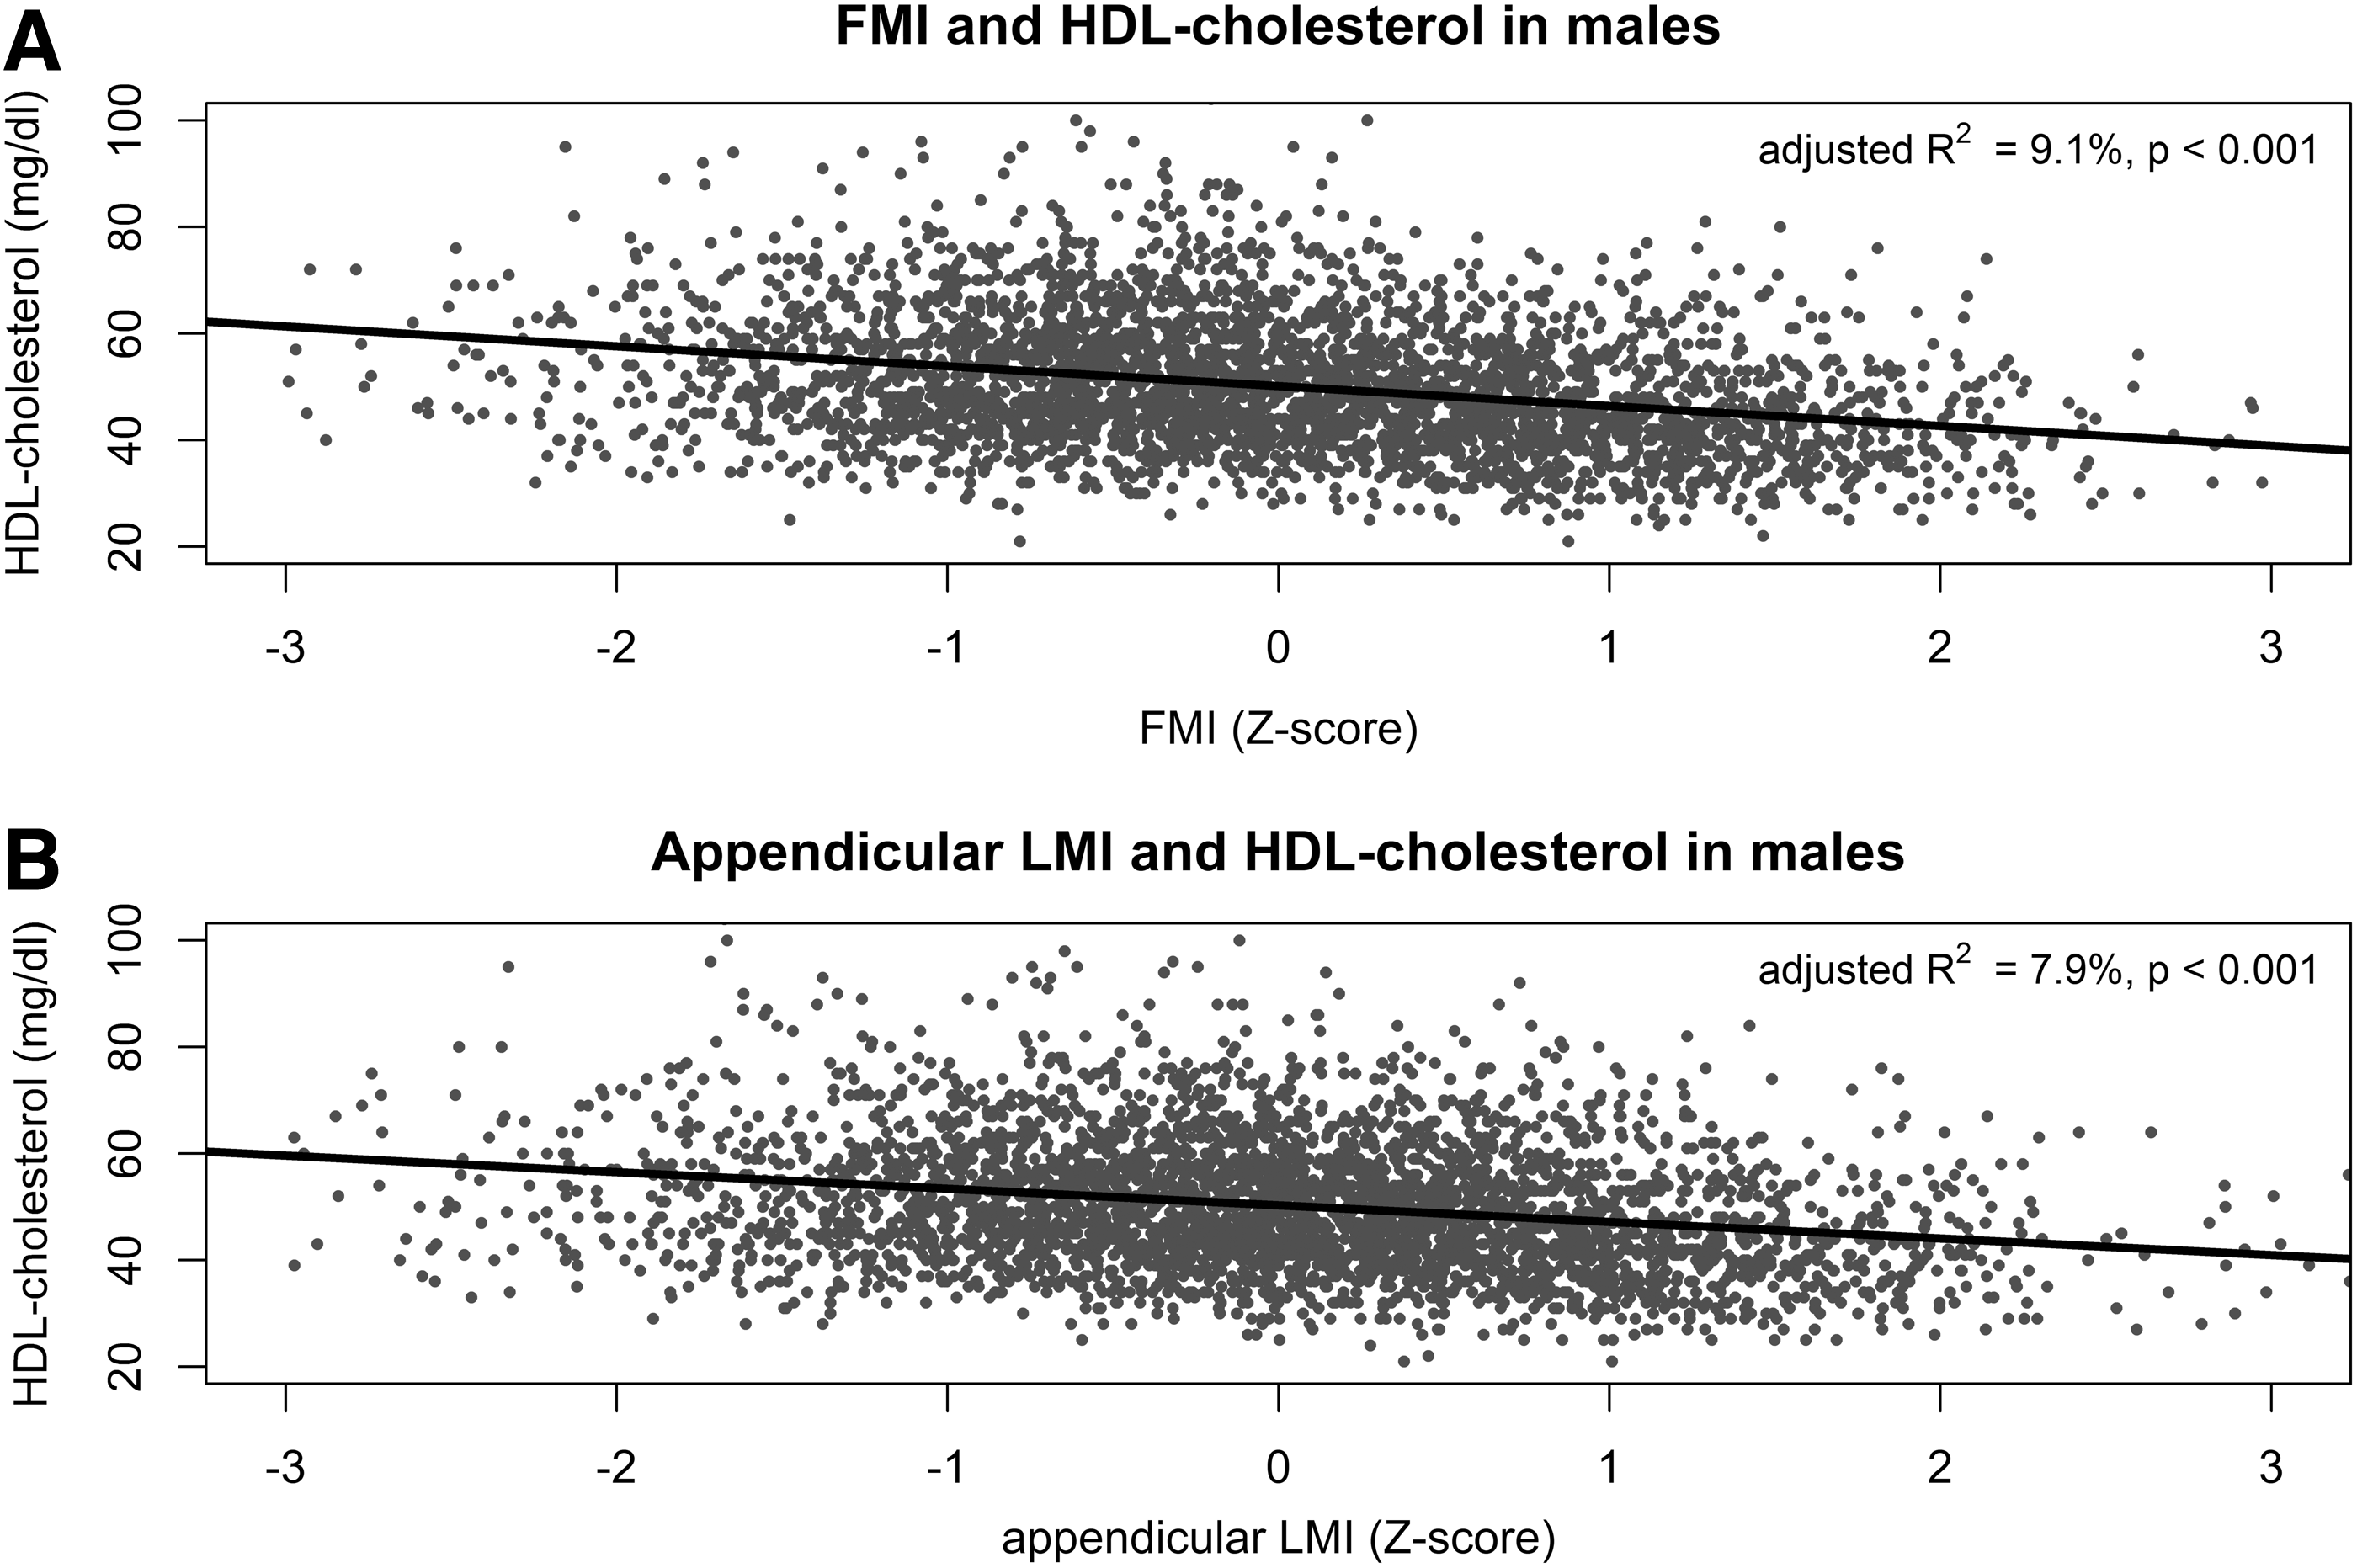
In females and males, there were significant inverse correlations between FMI and appendicular LMI Z-scores and HDL-cholesterol concentrations (Pearson's r = −0.30 and r = −0.25, p < 0.001; Figs. 1 and 2). In addition, there were a significant positive correlation of FMI Z-score and appendicular LMI Z-score (r = 0.67, p < 0.001; Supplementary Fig. S1).
Bivariate Analysis of the Interaction of HDL-Cholesterol Concentrations with Body Composition
Figures 3 and 4 depict the results of the bivariate logistic regression with FMI and appendicular LMI Z-scores as independent variable. The binary dependent variable was the presence of low HDL cholesterol, and also, FMI Z-scores as appendicular LMI Z-scores were significant predictors for the presence of low HDL cholesterol (Table 2).


Impact of Fat Mass Index and Appendicular Lean Mass Index on the Prevalence of Low High-Density Lipoprotein-Cholesterol Concentration
The results of the logistic regression are presented. The binary, dependent variable was the presence of low HDL-cholesterol concentration, defined as <40 mg/dL. The independent variables were the FMI and appendicular LMI Z-scores. For further details see Results section.
app., appendicular; CI, confidence interval; FMI, fat mass index; HDL, high-density lipoprotein; LMI, lean mass index; OR, odds ratio; SE, standard error.
Correlation of TG Concentration and HDL-Cholesterol Concentration
In Supplementary Figure S2, the LOESS regression of TG concentrations and HDL-cholesterol concentrations were given. There was a significant inverse association between TG concentrations and HDL-cholesterol concentrations (p < 0.001).
The mediation analysis showed that in female, 23.1% of the association between FMI Z-score and HDL-cholesterol concentrations was mediated by TG concentrations (Supplementary Table S15). The mediated proportion for appendicular LMI Z-score and HDL cholesterol was 25.2%.
In male, the mediated proportion by TG concentration was 36.0% for FMI and 38.8% for appendicular LMI Z-scores (Supplementary Table S15).
Discussion
The study results suggested that there is a counterintuitive, inverse association of muscle mass and HDL-cholesterol concentration (Figs. 1 and 2). As confirmed in previous studies, the association between fat mass and HDL cholesterol was also inverse.39,40 Therefore, in our study population, the prevalence of low HDL-cholesterol concentration increased with rising FMI and appendicular LMI Z-scores (Figs. 3 and 4).
Similar results were already reported almost 20 years ago by Pietrobelli et al. 7 They assessed the body composition by magnetic resonance imaging in adults (n = 129, 68 females, mean age 42.2 years) and found an inverse relationship between muscle mass and HDL-cholesterol concentration. The variation of muscle mass explained 7%–8% of the variance of the HDL-cholesterol concentration. These results were comparable to our results. The coefficient of determination (R 2 ) in the simple linear regression analysis in this study was 6.2%–6.6% (Figs. 1 and 2). As reported by Pietrobelli et al., 7 the inverse association of muscle mass and HDL-cholesterol concentration was slightly higher in females than in males (odds ratio in our study 1.32 vs. 1.2, R2 in the study of Pietrobelli et al. 7 8% vs. 7%).
On the contrary, two recently published studies reported a positive correlation of muscle mass and HDL-cholesterol concentration.18,19 In both studies, muscle mass was evaluated as the quotient of muscle mass and total mass in per cent (relative muscle mass). This muscle mass estimate was not compartment-specific. Thus, the same percent value could be reached by different couples of values for muscle mass and total mass, including fat mass. The authors of both publications divided the whole study population in the lowest quartile according the relative muscle mass and the other quartiles. Then they compared HDL-cholesterol concentrations of the two groups. In the first publication, 18 the authors used one cutoff value for relative muscle mass (≤64.2%), although it is known that the body composition is sex- and age-specific. 29 Therefore, the proportion of females in the first quartile was significantly higher than in the entire study population (68.6% vs. 42.1%). In the second publication, 19 the children in the first quartile had also significantly higher fat mass, beside the lower relative muscle mass, than the children in the other quartiles (35.5% vs. 18.8% for males and 44.9% vs. 32.3% for females). Therefore, this approach cannot clarify whether the high fat mass or the low muscle mass was associated with low HDL-cholesterol concentration.
In concordance to our results, Twisk et al. 21 also reported an inverse relationship of muscle mass and HDL-cholesterol concentration in adolescents and young adults (age 13–27 years). In contrast to our study, in this study, the muscle mass was assessed by skinfold thickness measurements and total body weight using regression equations. Comparable results were also reported by Schubert el al in middle-aged population (n = 269, age 40–60 years). 20 They assessed fat-free mass, as surrogate for muscle mass, by hydrodensitometry.
The reason why muscle mass was inversely associated to HDL cholesterol was not clear. It could be assumed that the positive correlation of muscle mass and fat mass (Supplementary Fig. S1) on the one side and the inverse correlation of fat mass and HDL-cholesterol concentration (Figs. 1 and 2) on the other side explained the inverse correlation of muscle mass and HDL-cholesterol concentration. The bivariate analysis showed an independent, inverse association of muscle mass and fat mass with the HDL-cholesterol concentration (Figs. 3 and 4). The adjusted odds ratios for appendicular LMI in females and males were slightly lower than the odds ratios for FMI, but still significant (Table 2).
An inverse correlation of TG and HDL-cholesterol concentration was already reported in previous studies 41 and could be confirmed in our study (Supplementary Fig. S2). Therefore, Pietrobelli et al. 7 had also analyzed weather the inverse association of muscle mass and HDL-cholesterol concentration was mediated by higher TG concentration. 7 They reported that the association was independent from TG concentration. In accordance with these results, it could be estimated, by results of our study, that approximately only 25.2% of the effect was mediated by TG concentration in females and only 36.0% in males (Supplementary Table S15).
One possible explanation for this inverse association of muscle mass could be an increase catabolism of HDL particles by the muscle-specific lipoprotein lipase (LPL). Levak-Frank et al. 42 reported that the muscle-specific LPL in a mice model could increase the HDL particle catabolism. It was assumed that the basic mechanism for this was a LPL-mediated transfer of cholesterol esters from HDL particles to triacylglycerol-rich lipoprotein remnants. 43 Despite the unknown mechanism underlying the inverse association of muscle mass and HDL-cholesterol concentration, this relationship might have some clinical relevance (see Clinical Implications section).
The prevalence of low HDL cholesterol in a comparable NHANES population (1999–2004, age 10–18 years) was already evaluated by Li et al., 44 who defined low HDL cholesterol as a concentration below 35 mg/dL and reported a prevalence of 6.67 [95% confidence interval (CI) 5.84–7.49]. Applying this definition, the prevalence in our study population is almost the same [6.11% (95% CI 5.22–7.14)].
As already mentioned in the Methods section, according the newest recommendation of the American College of Cardiology and the American Heart Association in this study, the cutoff value for low HDL cholesterol was set to 40 mg/dL. 36 Applying this higher cutoff value, the prevalence of low HDL cholesterol increased to 15.7% (95% CI 14.3–17.2).
Reference Centiles for FMI and Appendicular LMI
In this study, we also presented the first ethnicity-specific, pediatric reference centiles for FMI and for appendicular LMI applicable for Hologic QDR-4500A fan-beam densitometer (Hologic, Inc.; Supplementary Tables S2, S3, S4, S5, S6, S7, S8, S9, S10, S11, S12, S13, S14, S15).
Clinical Implications
Despite the low odds ratio for appendicular LMI Z-score in the bivariate analysis (Table 2), this significant association has some impact on the prevalence of low HDL-cholesterol concentration in children and adolescents. The following clinical example illustrated this impact. According to the contour diagram in Figure 3, the prevalence of low HDL-cholesterol concentration in girls with an FMI Z-score of 0.0 varied from 6% (when appendicular LMI Z-score was −2.0) to ∼16% (when appendicular LMI Z-score was +2.0). This increase in the prevalence of low HDL-cholesterol concentration by increasing the appendicular LMI Z-score by four could be estimated also using the odds ratio. For every unit Z-score increase in appendicular LMI (for example from 0.0 to +1.0), the prevalence of low HDL-cholesterol concentration increased 1.32 fold (Table 2). Therefore, an increase of appendicular LMI Z-score by four led to a 1.324 = 1.32 × 1.32 × 1.32 × 1.32 ≈ 3-fold increase in the prevalence of low HDL-cholesterol concentration. In males, increasing the appendicular LMI Z-score by four led to a rise of the prevalence of HDL cholesterol to the ∼2-fold (1.24 ≈ 2.0).
The knowledge of this relationship might have some impact on the exercise training recommended for children, especially for children with obesity who were prone to low HDL-cholesterol concentration. Our results suggested that anaerobic activities at high intensity designed to produce skeletal muscle hypertrophy might have negative effects on the HDL-cholesterol concentration. Therefore, aerobic exercise at moderate to high intensity, best in combination with a trend to reduce body mass should be recommended for children and adolescents to increase HDL-cholesterol concentration.
In fact, there were contradictory results reported about the effect of exercise training on the HDL-cholesterol concentration in children. Some authors reported an increase of HDL-cholesterol concentration, 45 others said no effect,46,47 and some others reported even a decrease. 48
Also in adults, it was reported that high-intensive, anaerobic training, in contrast to aerobic exercises, did not increase HDL-cholesterol concentration. 49 In addition, it has been recently reported that one fourth of the evaluated college athletes (n = 136, mean age = 20 years) had a low HDL-cholesterol concentration. 50
Furthermore, some authors assumed that for evaluating the effect of an exercise training program, analyzing the structure and components of HDL particles rather than the HDL-cholesterol concentration may be relevant. 51 Finally, despite the fact that more studies are needed to elucidate the optimal training improving lipid profiles in children and adolescents, fulfilling daily recommended physical activity was associated with more favorable HDL-cholesterol concentration and body fat percent than those who did not meet these recommendations. 52
Limitation
Our study is limited by the lack of dietary data documenting, which is known to affect lipid concentrations. In addition, the FMI treat all adipose tissue depots as metabolically similar, despite the evidence that the influence on lipid concentration of visceral fat depots differs from the one of the nonvisceral fat mass.
Conclusion
The study results suggested that there is a counterintuitive, inverse association of muscle mass and HDL-cholesterol concentration.
Footnotes
Acknowledgments
This research received no specific grant from any funding agency in the public, commercial, or not-for-profit sectors.
Author Disclosure Statement
I.D., K.M., L.S., M.J., M.R., and E.S. declare that they have no conflict of interest. I.D. had substantial contributions to the conception of the work, the data acquisition, analysis, and interpretation of data for the work; drafting the work critically for important intellectual content; final approval of the version to be published; and agree to be accountable for all aspects of the work. The first author (I.D.) accepts responsibility for the integrity of the data analysis and also is the corresponding author. K.M., M.R., L.S., M.J., and E.S. had substantial contributions to the design of the work and interpretation of data for the work; revising it critically for important intellectual content; final approval of the version to be published; and agree to be accountable for all aspects of the work.

References
Supplementary Material
Please find the following supplemental material available below.
For Open Access articles published under a Creative Commons License, all supplemental material carries the same license as the article it is associated with.
For non-Open Access articles published, all supplemental material carries a non-exclusive license, and permission requests for re-use of supplemental material or any part of supplemental material shall be sent directly to the copyright owner as specified in the copyright notice associated with the article.
