
Abstract
Background:
Using meta-regression, this article aims at establishing the minimum change in BMI-standard deviation score (SDS) needed to improve lipid profiles and blood pressure in children and adolescents with obesity, to aid future trials and guidelines.
Methods:
Studies with participants involved in lifestyle interventions, aged 4–19 years, with a diagnosis of obesity according to defined BMI thresholds, were considered for inclusion in a large systematic review. Interventions had to report pre- and post-intervention (or mean change in) BMI-SDS, plus either systolic blood pressure (SBP), high-density lipoprotein (HDL) cholesterol, low-density lipoprotein (LDL) cholesterol, and/or triglycerides (TGs). Random-effects meta-regression quantified the relationship between mean change in BMI-SDS and mean change in cardiovascular outcomes.
Results:
Seventy-one papers reported various cardiovascular measurements and mean change in BMI-SDS. Fifty-four, 59, 46, and 54 studies were analyzed, reporting a change in SBP, HDL, LDL, and TG, respectively. Reduction in mean BMI-SDS was significantly related to improvements in SBP, LDL, TG, and HDL (p < 0.05); BMI-SDS reductions of 1, 1.2, and 0.7 ensured a mean reduction of SBP, LDL, and TG, respectively, although an equivalent value for HDL improvement was indeterminate.
Conclusion:
Reductions in mean BMI-SDS of >1, >1.2, or >0.7 are likely to reduce SBP, LDL, and TG, respectively. Further studies are needed to clarify the optimal duration, intensity, and setting for interventions. Consistency is required regarding derived BMI values to facilitate future systematic reviews and meta-analyses.
Introduction
Childhood obesity has reached epidemic proportions, becoming one of the most serious global public health challenges. 1 In the United Kingdom, around 9.6% and 20% of children aged 4–5 years and 10–11 years are obese, respectively. 2 Many of these children have risk factors for hypertension, dyslipidemia, insulin resistance, and adult obesity.3,4
In children and adolescents, the relationship between cardiovascular disease (CVD) risk factors and early development of atherosclerosis is derived mainly from autopsy studies. 5 Four large cohort studies, Bogalusa,6–8 Muscatine,9,10 the Childhood Determinants of Adult Health (CDAH) study, 8 and the Young Finns Study (YFS),8,11 have cited high-density lipoprotein (HDL) cholesterol, low-density lipoprotein (LDL) cholesterol, triglycerides (TGs), and systolic blood pressure (SBP) as significant risk factors for adult CVD in children and adolescents with obesity.7,8,10,11
In adults, weight loss ≥5% in individuals aged 46 ± 13 years has been found to benefit many CVD risk factors 12 and there are long-established weight reduction guidelines regarding the improvement of adult cardio-metabolic health.13,14 There are currently no systematic reviews or meta-analyses assessing the relationship between improvements in BMI-standard deviation score (SDS) and benefits to cardio-metabolic health in children and adolescents; the reduction in BMI-SDS required to improve CVD risk factors such as blood pressure (BP) and lipid profile is unknown.
A 15-year prospective observational study of 1388 overweight children (mean age 11.4 ± 0.1 years; 43.8% male), conducted in a specialized outpatient obesity clinic in north-west Germany, concluded that a BMI-SDS reduction of ≥0.25 significantly improved hypertension, hyper-triglyceridemia, and LDL levels; whereas a BMI-SDS reduction ≥0.5 doubled this effect. 15 Importantly, this study lacked an untreated control group, and it therefore did not account for any regression to the mean. Ford et al. reported improvements in insulin sensitivity, lipids, and BP in adolescents with obesity with BMI-SDS reductions of ≥0.25, with greater benefits with reductions of ≥0.5. 16 Wunsch et al. reported an association between obesity, cardio-metabolic risk factors, and increased carotid intima-media thickness in children, which was reversible with marked weight loss (BMI-SDS decrease >0.5). 17
Measuring Change in BMI across Childhood and Adolescence
BMI, in addition to various other measurements during childhood, is influenced by growth and puberty. Thresholds routinely used in adults cannot be used in pediatrics. Using Cole's Box Cox transformations, measured values of BMI can be standardized into BMI-SDS, in respect to reference populations; these normalize the BMI skewed distribution in childhood. 18 This provides a normalized measurement for obesity in pediatrics, indicating the degree that an individual BMI lies around the median BMI value.19,20
Lifestyle Interventions Affecting Cardio-Metabolic Health in Childhood
Numerous lifestyle intervention programs are conducted worldwide, with statistically significant reductions in BMI-SDS. Previous systematic reviews and meta-analyses have assessed the impact of lifestyle interventions on reducing BMI-SDS but have not looked at the reduction in BMI-SDS required to improve metabolic and cardiovascular parameters.
A Cochrane review by Oude et al., which included 64 randomized controlled trials (RCTs) (n = 5230) and focused mainly on dietary, exercise, and behavioral lifestyle interventions, found significant changes in BMI-SDS at 6 months follow-up (−0.06, 95% confidence interval [CI] −0.12 to −0.01) in children younger than 12 years (3 RCTs); (−0.14, 95% CI −0.18 to −0.10) in children 12 years and older (3 RCTs). 21 A meta-analysis of 33 RCTs by Ho et al. illustrated a reduction of −0.10 (95% CI −0.18 to −0.02) in BMI-SDS, with lifestyle interventions versus a “usual care” control group. Interventions included the “traffic light diet” and supervised physical activity sessions. Ho et al. were unable to give definitive recommendations for weight management practice due to the heterogeneity of the included studies. 22 Another Cochrane review by Colquitt et al. found a mean reduction of −0.3 in BMI-SDS across 4 low-quality evidence RCTs, at 6–12 months follow-up (95% CI −0.4 to −0.2). These trials compared multi-component interventions with usual care. 23
The complexities and challenges facing obesity interventions are many: behavioral patterns, and the biochemical and physiological nature of the obesity itself may reflect multiple genetic, cultural, and environmental influencers. 24 Determining a systematic quantification of high-quality evidence, related to the reduction in BMI needed to achieve cardio-metabolic health improvements in the obese pediatric population, would help guide future trials, clinical guidelines, and lifestyle interventions.25–30
Study Objectives
This study aims at establishing the minimum change in BMI-SDS that is necessary to improve lipid profile and BP in children and adolescents with obesity. This article is the third of three papers reporting on the findings from studies identified in a large systematic review. The other two papers focus on changes in percentage body fat, 31 and inflammation, liver function, and insulin sensitivity measurements—including C-reactive protein, alanine aminotransferase, and the homeostatic model assessment of insulin resistance. 32
Methods
This review follows the Preferred Reporting Items for Systematic Reviews and Meta-Analyses (PRISMA) 2010 reporting guideline. 33 The studies included in this article were identified as a part of large-scale systematic review (n = 90 studies; searched up to May 2017), PROSPERO CRD42016025317. This can be accessed via https://www.crd.york.ac.uk/PROSPERO/. An open-access protocol paper has also been published. 34
The methodology conducted in this review has been reported in detail in a previous publication. 31 Completed, published RCTs and nonrandomized studies (cohort studies) of lifestyle interventions, involving participants with obesity aged 4–19 years (as per defined obesity thresholds), were considered for inclusion. This article focuses on lipid profile and BP, particularly SBP, HDL, LDL, and TG. Analyses for diastolic blood pressure (DBP) and total cholesterol (TC) were not included, as SBP, HDL, LDL, and TG were deemed to be more significant predictors of CVD in adulthood based on evidence from four large cohort studies.7,8,10,11 The TC to HDL cholesterol ratio (TC/HDL), LDL/HDL, very low-density lipoproteins (VLDLs), and non-HDL were not included in this article due to the paucity of studies reporting on them (n = 6 for TC/HDL, 2 for LDL/HDL, and 1 for VLDL and non-HDL) and the lack of evidence supporting these parameters as predictive of atherosclerotic disease, on transitioning from childhood to adulthood.7,8,10,11
Therefore, interventions had to report pre- and post-intervention (or mean change in) BMI-SDS (or “z-score”), plus some or all of SBP, HDL, LDL, and/or TG. The BMI-SDS presented in the studies was used, as opposed to calculating BMI-SDS from a single standard. Appendix A1 summarizes the review's eligibility criteria, data extraction process, and quality assessment.
Quality Assessment
This study focusses on the association between change in BMI-SDS and change in cardiovascular risk parameters, rather than the specific treatment interventions that effect those changes. Risk of bias tools, such as the Cochrane risk of bias tool, were therefore not used. 35 The included studies were assessed for methodological quality by two members of the review team during the data extraction process using the Quality Assessment tool utilized in the 2004 Health Technology Assessment (HTA) systematic review of the long-term effects and economic consequences of treatments for obesity and implications for health improvement. 36 This tool consists of 20 questions, which are combined to give a final score and percentage “quality” rating (Supplementary Data S1–S3 and Supplementary Table S1 for further details). Discrepancies in quality assessment scoring were resolved through discussion.
Analysis
Data analysis follows the same approach as used in the first paper in this series. 31 Random-effects meta-regression analyses, as implemented in Stata, 37 were utilized to quantify the relationships between mean change in BMI-SDS (independent, predictor variable) and mean change in (1) SBP, (2) LDL, (3) HDL, and (4) TG (target variables), where these target variables were reported.
In contrast to meta-analysis, meta-regression was developed to examine the impact of moderator variables on study effects via a regression-based technique. Here, it was used to study the co-relationships between the predictor variable and target variables across a diverse range of study subsets. The relative effects of the various interventions were not being evaluated, with predictor and target variables instead being considered as correlated “outcomes”; the methodology allows for residual heterogeneity in the target variable not explained by the predictor. 38 All available subsets documented within each study (i.e., intervention vs. control, boys vs. girls, good vs. poor responders) were included, provided there was no duplication of data.
Subsets were chosen in preference to the total group of participants in each study, if both were reported, to give a greater spread of outcomes. Standard deviations (SDs), as well as means, were required for the changes in the target variables and, if not given explicitly, were calculated from either the standard errors (SEs) or the 95% CIs of the mean changes. If studies reported only pre- (baseline) and post- (intervention or control) values, the SDs of the changes in target variables had to be estimated. The latter required an estimate of the correlation coefficient (r) between pre- and post-results; r was estimated for each subset that reported that all three SDs (pre-, post- and changes) and their median were used.
Where medians and interquartile range (IQR) were reported for baseline and post-intervention results, means and SDs were estimated from them.39,40 Where there were missing data, the original authors were contacted, and where missing data remained, attempts were made to estimate these missing values from other results reported in the studies or by imputing possible values using the mean of values from comparable studies. In situations where this was not possible, the study had to be excluded from analysis.
Further exploratory analyses were undertaken by using the percentage of women and the length of the study as additional predictors. Sensitivity analyses using variations of r were carried out in a previous paper in this review but failed to significantly impact the outcomes. 31
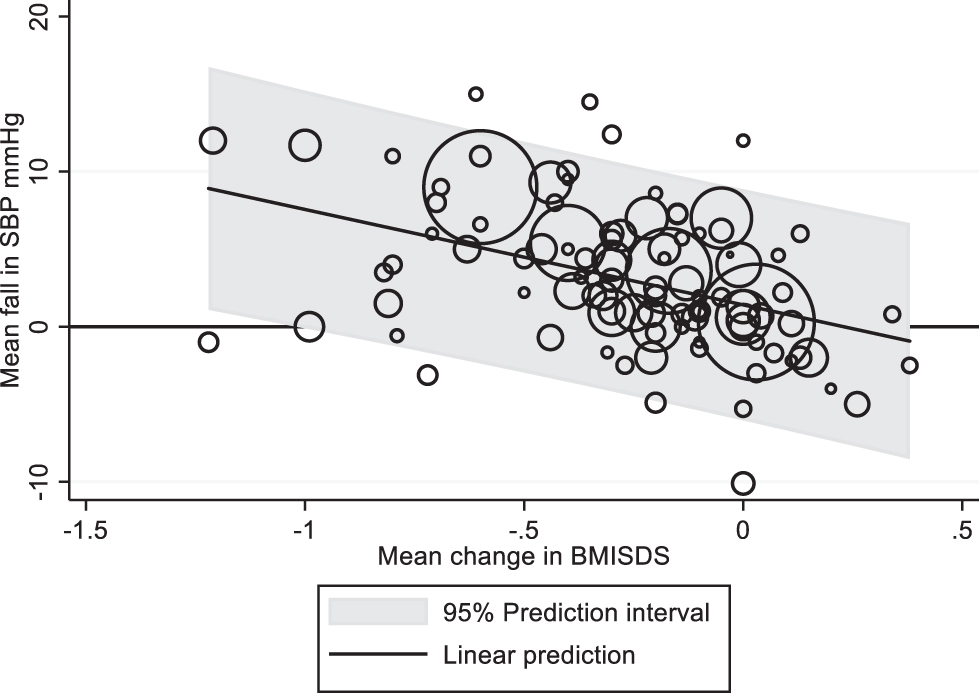
Fitted regression lines are shown together with their 95% prediction intervals (95% PI), with individual points representing individual study subgroup results (the mean change in the target variable and the mean change in BMI-SDS) and the size of the surrounding circles representing the precision of the mean change in the target variable (i.e., the reciprocal of the SE squared). For a given mean change in BMI-SDS, the upper and lower limits of the 95% PI indicate the range of mean changes in target values that would be expected in future studies. The smallest reduction of mean BMI-SDS associated with improvement in the mean target variable was taken to be the minimum value for which the 95% PI was wholly less than (or more than) 0.
Results
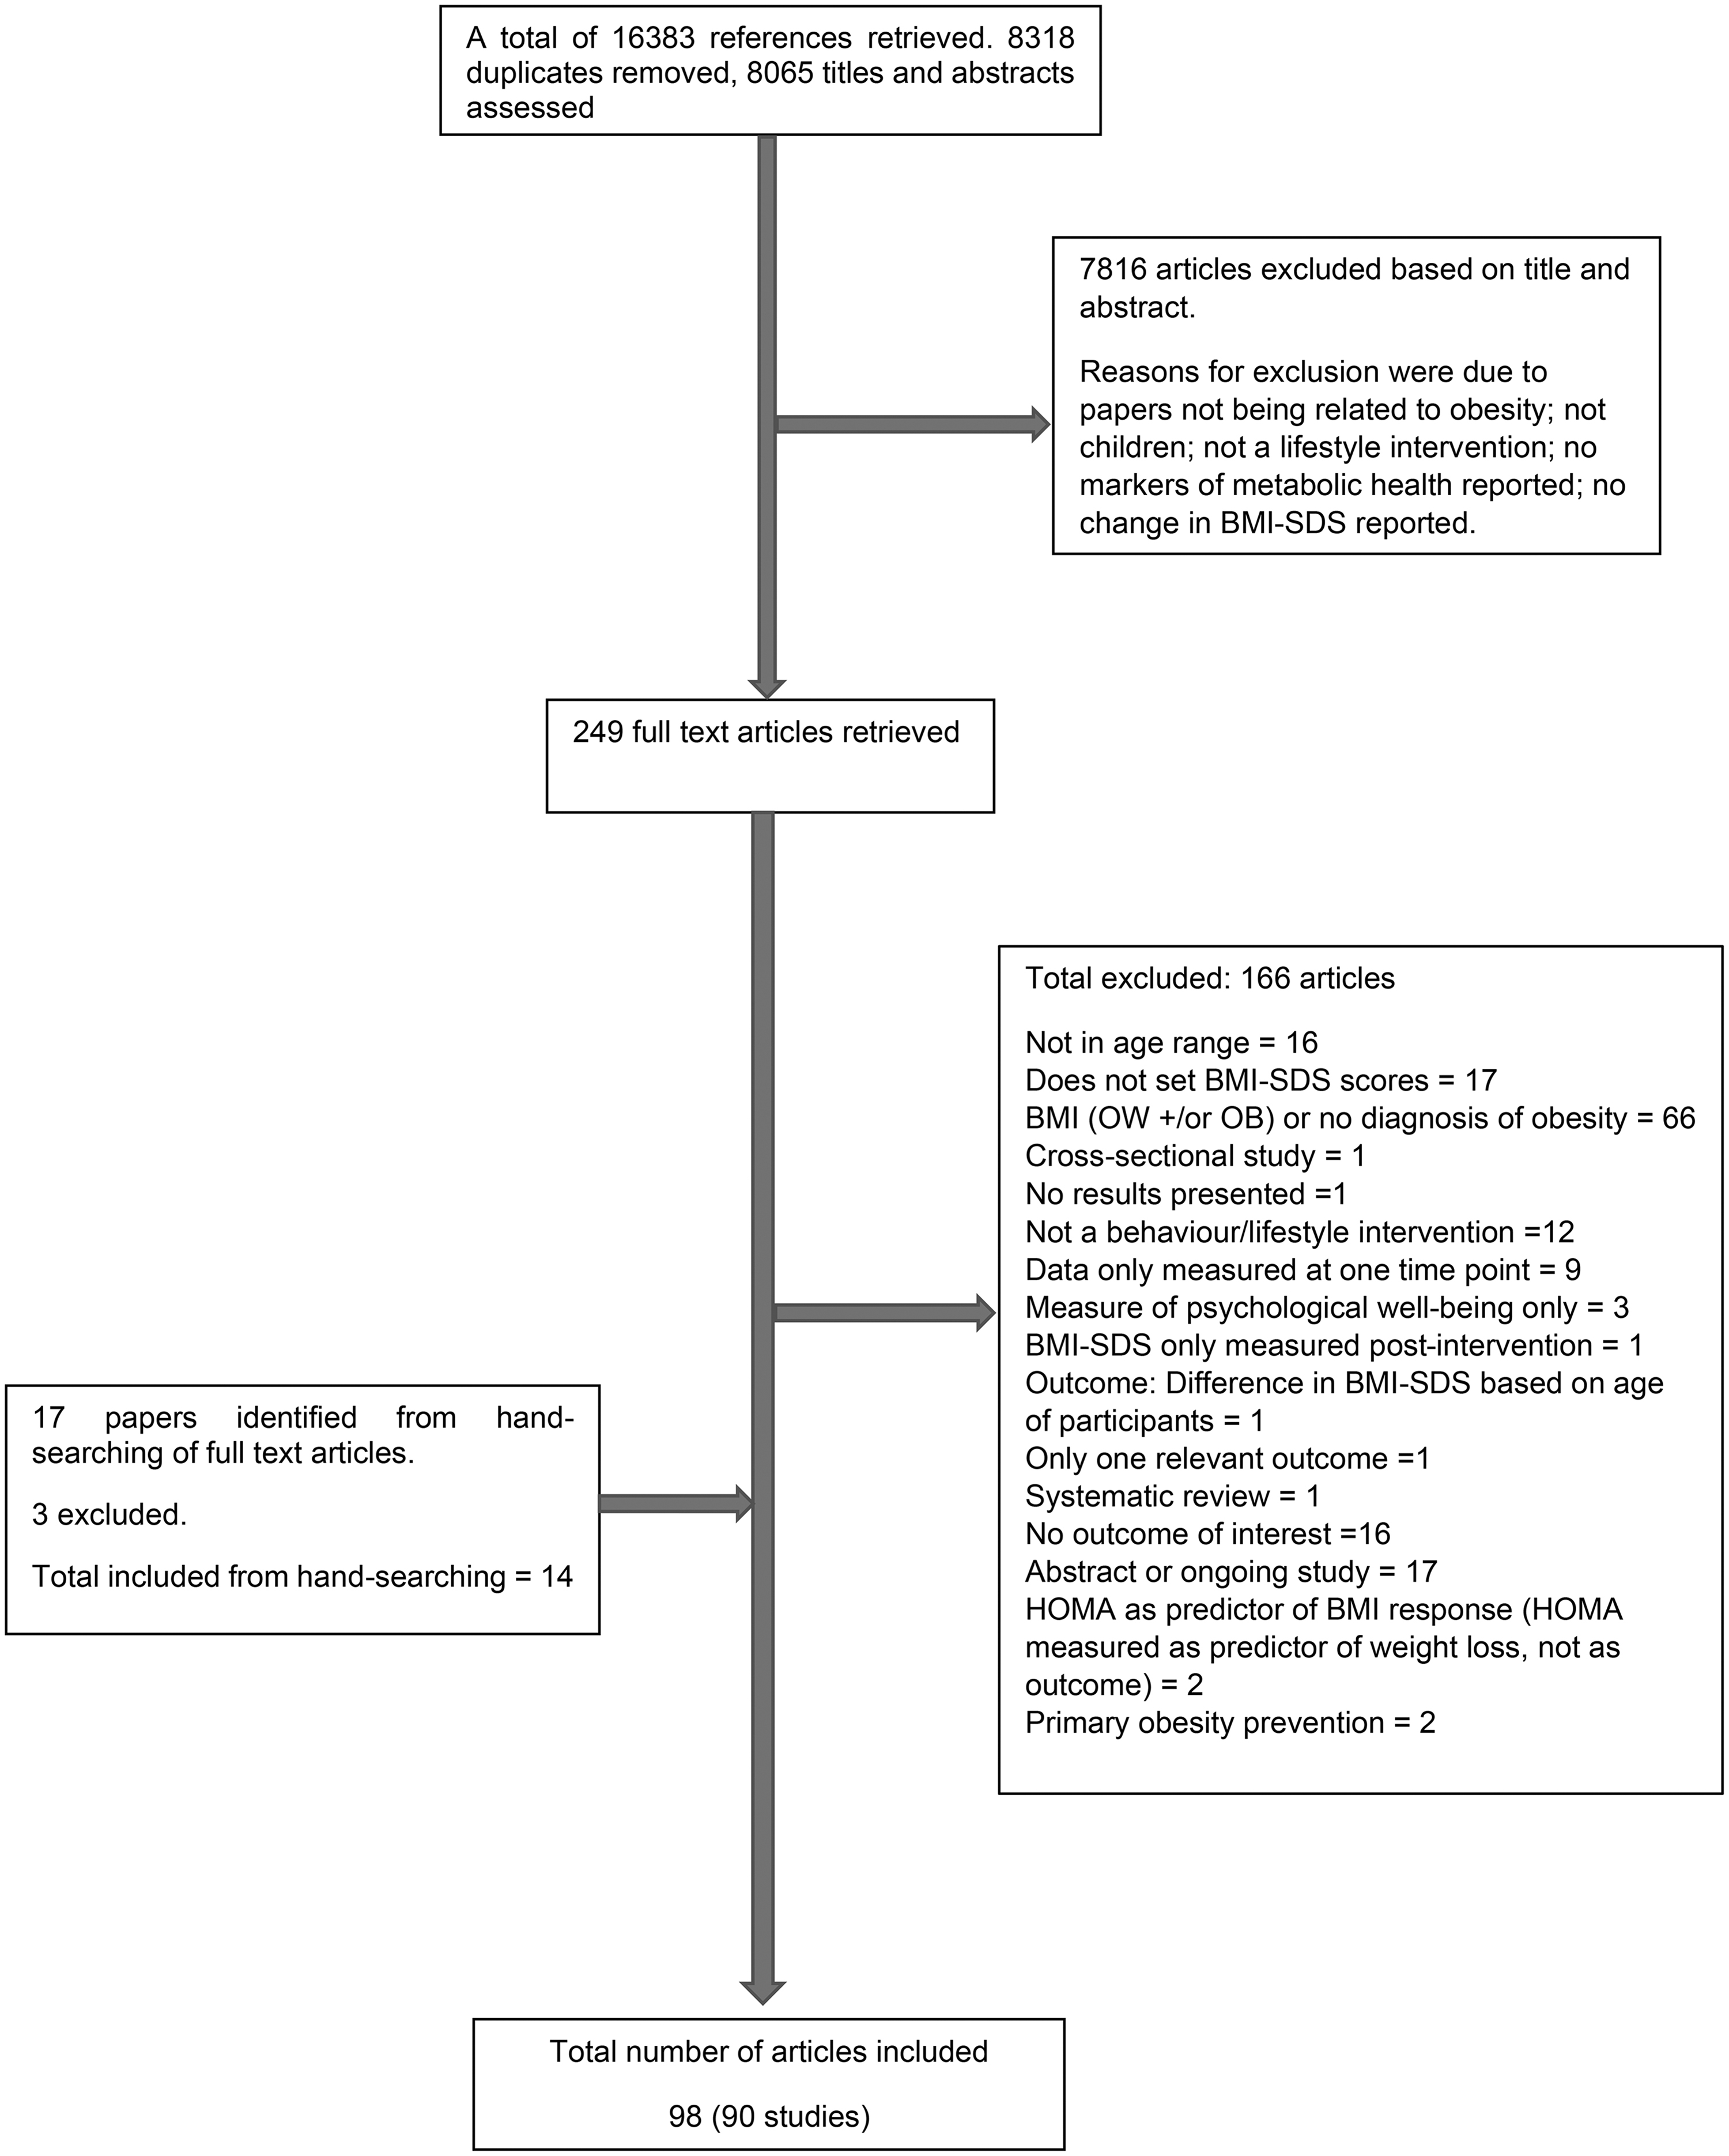
Ninety-eight published articles related to 90 different studies met the inclusion criteria for the systematic review. Figure 1is a flow diagram illustrating the number of papers excluded at each stage of the review. Further information regarding the search results can be found in Supplementary Data S1. The Venn diagram (Supplementary Data S2 and Supplementary Fig. S1) illustrates how many studies were identified for the various markers of metabolic health. Seventy-one studies assessed and reported cardiovascular outcomes.
Outcome Measures
The BP measures reported included SBP, DBP, 24-hour ambulatory SBP and DBP, and SBP and DBP SDS (SBP-SDS and DBP-SDS). Lipid profile measurements reported included HDL, LDL, TC, TG, TC to HDL ratio (TC/HDL), LDL to HDL ratio (LDL/HDL), VLDL, and non-HDL cholesterol. All lipid measurements reported (HDL, LDL, and TG) were fasting samples.
For this review, before exclusions (see the Methods section and the Quantitative Analysis section), the BP measures included are SBP (n = 56 studies). The lipid profile measures included are HDL (n = 60), LDL (n = 47), and TG (n = 56).
Narrative Description of Studies Included in This Article
Of the 71 studies (121 data subsets) reporting cardiovascular outcomes (Table 1): 15 were conducted in Germany; 8 in the United States; 6 in Italy; 4 each in the Netherlands and Spain; 3 in the United Kingdom; 2 each in Canada, Switzerland, Australia, Belgium, Denmark, France, Mexico, Poland, Tunisia, and Venezuela; and 1 each in Brazil, Chile, Finland, Guadeloupe, Iceland, Israel, Kuwait, Norway, Portugal, the Philippines, and Thailand. Most studies defined obesity as having a BMI-SDS >2 or a BMI percentile of at least the 95th percentile. Doughty et al. were included, as although a “BMI of at least the 89th percentile” (Table 1) is stated in their methods, 51 the paper reports on 12 adolescents with obesity, with BMIs above the 95th percentile completing the intervention; and BMI-SDS was 2.3 ± 0.3 at baseline—therefore an obese sample.19,20
Characteristics of Studies Reporting Cardiovascular Outcomes
%ile, percentile; AI, Academic Institution; AmO, outpatient ambulatory; BB, Bright Bodies; BL, baseline; BM, behavior modification; C, control; CDC, Centre for Disease Control; CG, control group; CHO, carbohydrate; D, diet; DBP, diastolic blood pressure; E, exercise; F, female; FU, follow up; HDL, high-density lipoprotein; HGI, high glycemic index; HIIT, high-intensity interval training; ht, height; I, intervention; Inpt., inpatient; IOTF, International Obesity Task Force; IQR, interquartile range; LDL, low-density lipoprotein; LGI, low glycemic index; LMS, least-mean-squares; LS, long stay; MAS, maximal aerobic speed; MIIT, medium-intensity interval training; MO, morbidly obese; n, number; NAFLD, nonalcoholic fatty liver disease; ND, not described; NR, not reported; Ob, obese; OC, obese control; Outpts, outpatients; OW, overweight; PA, physical activity; PE, physical education; RCT, randomized controlled trial; SBP, systolic blood pressure; SD, standard deviation; SDS, standard deviation score; SMC, structured modified carbohydrate diet; SS, short stay; TC, total cholesterol; TG, triglyceride; trad. act., traditional activity; WL, weight loss; wt, weight.
Most included studies were of cohort design (n = 49), and 18 were RCTs. There was also one case-control study, 48 a nonrandomized prospective study, 90 and a controlled clinical trial. 112 One study adopted a quasi-randomized design, whereby two cohorts were partially randomized to either an intervention group or a “usual care” group. 51
Most interventions were conducted in a hospital clinic setting (n = 50). Ten studies were undertaken in a community setting and eight in academic institutions. Three studies conducted their intervention between academic and clinical settings, 96 clinical and community settings, 106 or community and academic settings. 54
Fifty-nine studies conducted interventions that comprised both diet and exercise components. The remaining studies (n = 12) utilized either exercise or diet interventions only. The duration of the interventions ranged from 2 to 24 months, with one study having no specific intervention period. 116 Most studies (n = 65, 90%) did not report any follow-up after the lifestyle treatment post-intervention assessment. Follow-up ranged from 6 to 24 months, in studies where it was conducted and reported.
The sample sizes of the included studies ranged from 8 to 1017 participants. Ages of participants ranged from 4 to 19 years. Studies predominantly had a mix of men and women (n = 67, 94%), with only four studies specifically analyzing either girls81,82 or boys.74,99 Thirty-seven studies (53%) measured the pubertal development stage of participants, according to the Marshall and Tanner staging, with pubertal status categorized into three groups: pre-pubertal, pubertal, and late/post-pubertal. 114 One study reported that pubertal development was measured, although the method used was not defined, 79 and one study reported the percentage pre-pubertal, without defining how they measured puberty. 92 Some studies did not report any measures of pubertal development (n = 32, 45%).
Quantitative Analysis
Systolic blood pressure
Table 1 shows the number of subsets included from each study, and the number analyzed from each subset. Before SBP analysis, two studies (n = 4 subsets) were excluded as they reported SBP-SDS and were not directly comparable.49,90 As a result, 99 subsets were identified from the remaining 54 studies that documented both a mean change in BMI-SDS and an associated mean change in SBP (or gave pre- and post- “intervention” values from which these could be calculated), together with the number of cases analyzed. “Intervention” here could have been the “control” arm in some cases. Two studies (n = 5 subsets) only had medians and IQRs reported for the baseline and post-intervention results; the mean and SDs were estimated from them.39,40
Thirty data subsets had the mean change in SBP reported, together with a measure of variability (standard deviation [SD]) of the actual changes; an initial analysis of just these 30 subsets is shown in Appendix A2 and Appendix Figure A1(A). The remaining 69 subsets reported means and SDs (or SEs, or 95% CIs) at baseline and “end,” and the mean and SD of the changes were calculated from these. The latter required an estimate of the correlation between baseline and end SBP; we used the median correlation coefficient estimated from 15 datasets reporting SDs of both changes and baseline/post-intervention [0.66 (IQR 0.54–0.71)]. The final analysis for all 99 subsets and the fitted meta-regression line is shown in Figure 2, together with pointwise, 95% PIs for the change in SBP across the study datasets. The equation of the fitted line was: Mean change in SBP = −6.153 × mean change in BMI-SDS +1.408. The mean changes in SBP and BMI-SDS were significantly related as indicated by the regression slope (p < 0.001, with 95% CI: −8.787 to −3.520). However, from the 95% PI, a mean change of at least 1 in mean BMI-SDS would be required to ensure a reduction in SBP in any future study.
Appendix Figure A1(B) shows the half normal plot of the standardized predicted random effects, most of which are within ±2. The proportion of the between-study variance that was explained by the mean change in BMI-SDS was only 22%. There was significant variation due to heterogeneity (I 2 = 89%). Further exploratory analyses, using the percentage of women and the length of the study (baseline to end-of-intervention) as additional predictors, failed to show any significant effect on the mean change in SBP (p = 0.24 and p = 0.27, respectively).
HDL cholesterol
Before analysis, Kolsgaard et al. (n = 4) was excluded as the mean change in BMI-SDS was reported for the whole sample size (0.13) and not the specific subsets in the study 66 Therefore, 104 subsets from the remaining 59 studies reported both a mean change in BMI-SDS and an associated mean change in HDL or gave pre- and post- “intervention” values from which these could be calculated as well as the number of cases analyzed. Thirty-eight subsets reported HDL in mmol/L—the international system of units. The remaining (n = 66) required their reported values to be multiplied by 0.02586 to convert them from mg/dL to mmol/L. 115 Six studies (n = 11) reported medians and IQRs for the baseline and post-intervention results.39,40,54,75,76,105
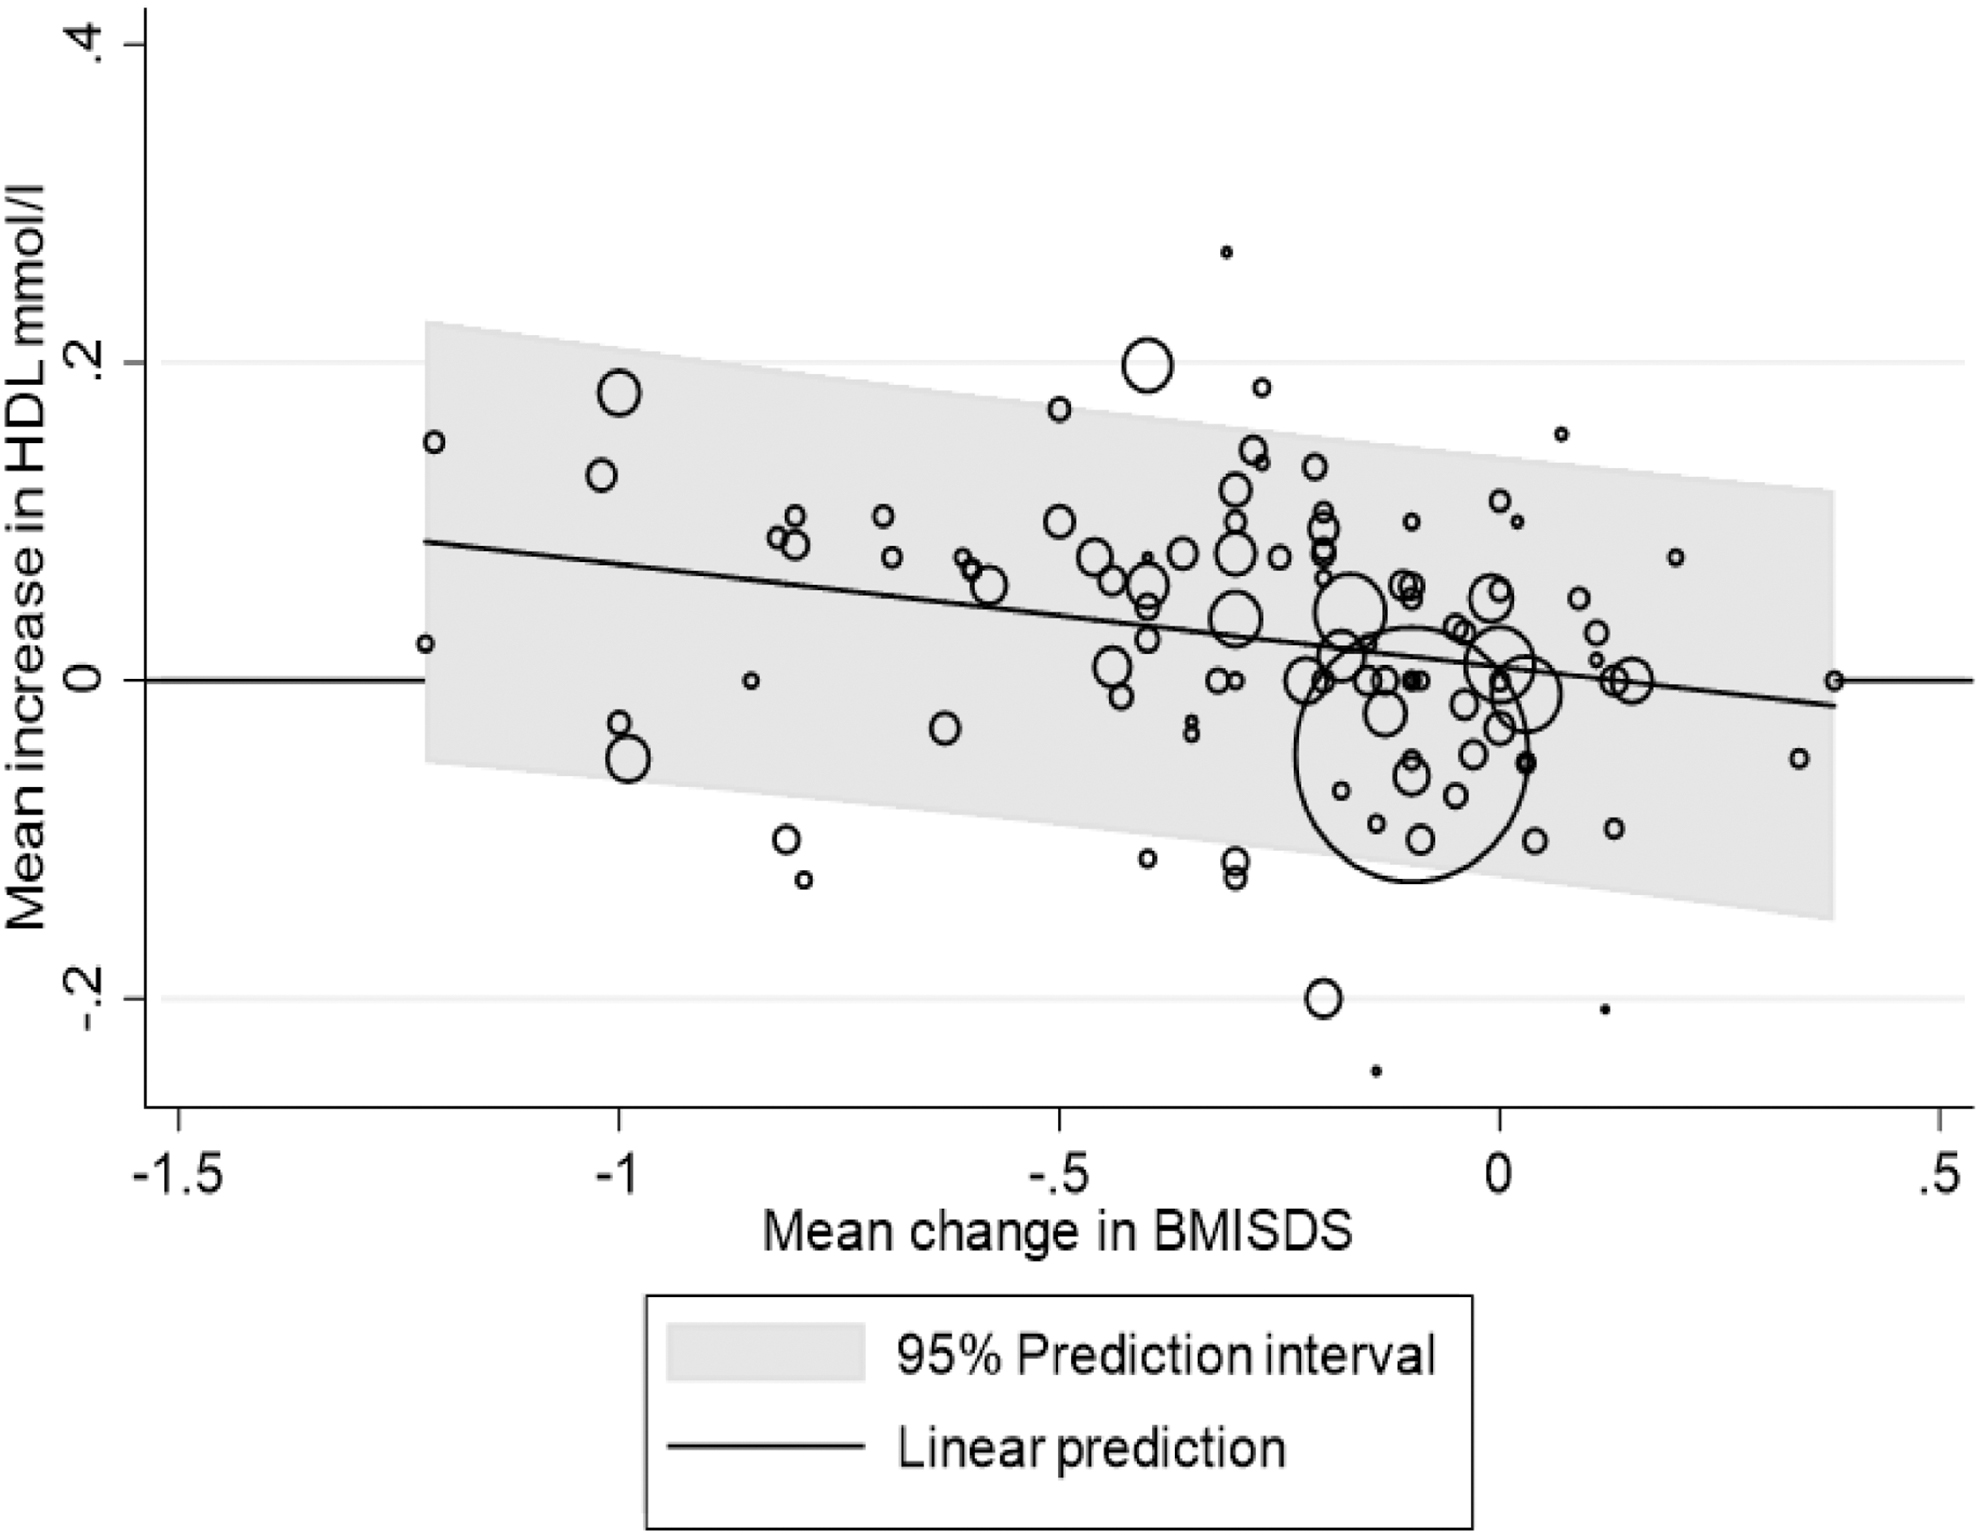
Twenty-five subsets reported mean and SDs of the changes in HDL and analysis based on those given in Appendix Fig. A2(A). The median of the correlation coefficients estimated from 16 datasets reporting SDs of mean change, baseline and post-intervention HDL values was 0.60 (IQR 0.31–0.79), which was used to estimate the SDs of the changes in HDL for the remaining 78 subsets, leaving 104 subsets for analysis (Appendix Fig. A2(B)). In Figure 3, however, the control subset in Visuthranukul et al. has been omitted (n = 103) because it was found to be a strong outlier in the analysis, with a mean reduction of 1.1 mmol/L 109 in HDL (Appendix Fig. A2(B)). The equation of the fitted line was: mean change (increase) in HDL = −0.065 × mean change in BMI-SDS +0.009. (adjusted R2 = 9%; I2 = 86%). Although the slope was statistically significant (p = 0.009; 95% CI −0.112 to −0.017), the change in BMI-SDS needed to ensure an increase in mean HDL was beyond the range of the data (in excess of 1.22). The standardized predicted random effects were approximately normal (Appendix Fig. A2(C)). Including the control subset in Visuthranukul et al. 109 (n = 104) did not impact this result, in that it was still impossible to find a change of BMI-SDS, among the range of changes seen, that would ensure an improvement in mean HDL (Appendix Fig. A2(B)).
Neither the percentage of women nor the length of the study (baseline to end-of-intervention), added as extra predictors, significantly affected the mean change in HDL (p = 0.86; p = 0.057).
LDL cholesterol
Before the LDL analysis, Kolsgaard et al. 66 was excluded for similar reasons as the HDL analysis. Eighty-two data subsets from the remaining 46 studies reported both a mean change in BMI-SDS and an associated mean change in LDL or gave pre- and post-intervention values from which these could be calculated, together with the number of cases analyzed. Thirty-two subsets reported LDL in mmol/L. The remaining (n = 50) required their reported values to be multiplied by 0.02586 to convert them from mg/dL to mmol/L. 115 Seven subsets reported medians and IQRs for the baseline and post-intervention results.39,40,54
Twenty-four subsets reported a mean change in LDL together with SDs (Appendix Fig. A3(A)). The median and IQR of the correlation coefficients estimated from the 15 datasets where the SDs of mean change, baseline and post-intervention LDL values were available was 0.80 (IQR 0.66–0.83), which was used to estimate the SDs of the changes in LDL for the remaining 58 subsets and the overall meta-regression line is shown in Figure 4. The equation of the line was: Mean change in LDL = −0.225 × Mean change in Mean BMI-SDS +0.101. (adjusted R2 = 11%; I2 = 94%). The slope was statistically significant (p = 0.002; 95% CI −0.362 to −0.088); however, looking at the 95% PI, the mean BMI-SDS would have to be reduced by at least 1.2 to ensure a reduction in mean LDL. Murer et al. 76 was a strong outlier, although omission of this subset (n = 81) did not change the overall findings (Appendix Fig. A3(B)).

The standardized predicted random effects were approximately normal (Appendix Fig. A3(C)). Neither the percentage of women nor the study duration significantly affected the mean change in LDL when added to the regression model (p = 0.83 and p = 0.16, respectively, n = 81).
Triglycerides
Before the TG analysis, Kolsgaard et al. 66 was excluded for similar reasons as the previous analyses. The weight-loss subset in Corripio et al. 48 (n = 1) was excluded, as the reported baseline IQR for TG was incorrect. Savoye et al. 96 (n = 2) was excluded, as the changes from baseline TG were reported as CIs of geometric means (GMs) from which it was impossible to determine SDs for the actual changes in TG. After these exclusions, 98 data subsets from 54 studies reported both a mean change in BMI-SDS and an associated mean change in TG or gave pre- and post-intervention values from which these could be calculated, as well as the number of cases analyzed. Thirty-six subsets reported TG in mmol/L; the remaining (n = 62) required their reported values to be multiplied by 0.01129 to convert them from mg/dL to mmol/L. 115 Nine subsets reported medians and IQRs,39,40,48,54,71 and two subsets reported medians and ranges76,105 for both the baseline and post-intervention results. For Ford et al. (n = 4), who reported TG values as GMs and ranges, GMs were used to approximate the medians and the mean/SD was estimated from the medians/ranges. 16
Twenty subsets reported a mean change in TG together with SDs (Appendix Fig. A4(A)). The median and IQR of the correlation coefficients estimated from the 13 datasets where the SDs of mean change, baseline and post-intervention TG values were available was 0.69 (IQR 0.53–0.78), which was used to estimate the SDs of the changes in TG for the remaining 78 subsets The meta-regression for all 98 subsets is shown in Figure 5. The equation of the fitted line was: mean change in TG = −0.239 × mean change in mean BMI-SDS +0.033. The slope was statistically significant (p < 0.001; 95% CI −0.325 to −0.153). (adjusted R2 = 29%; I2 = 86%).
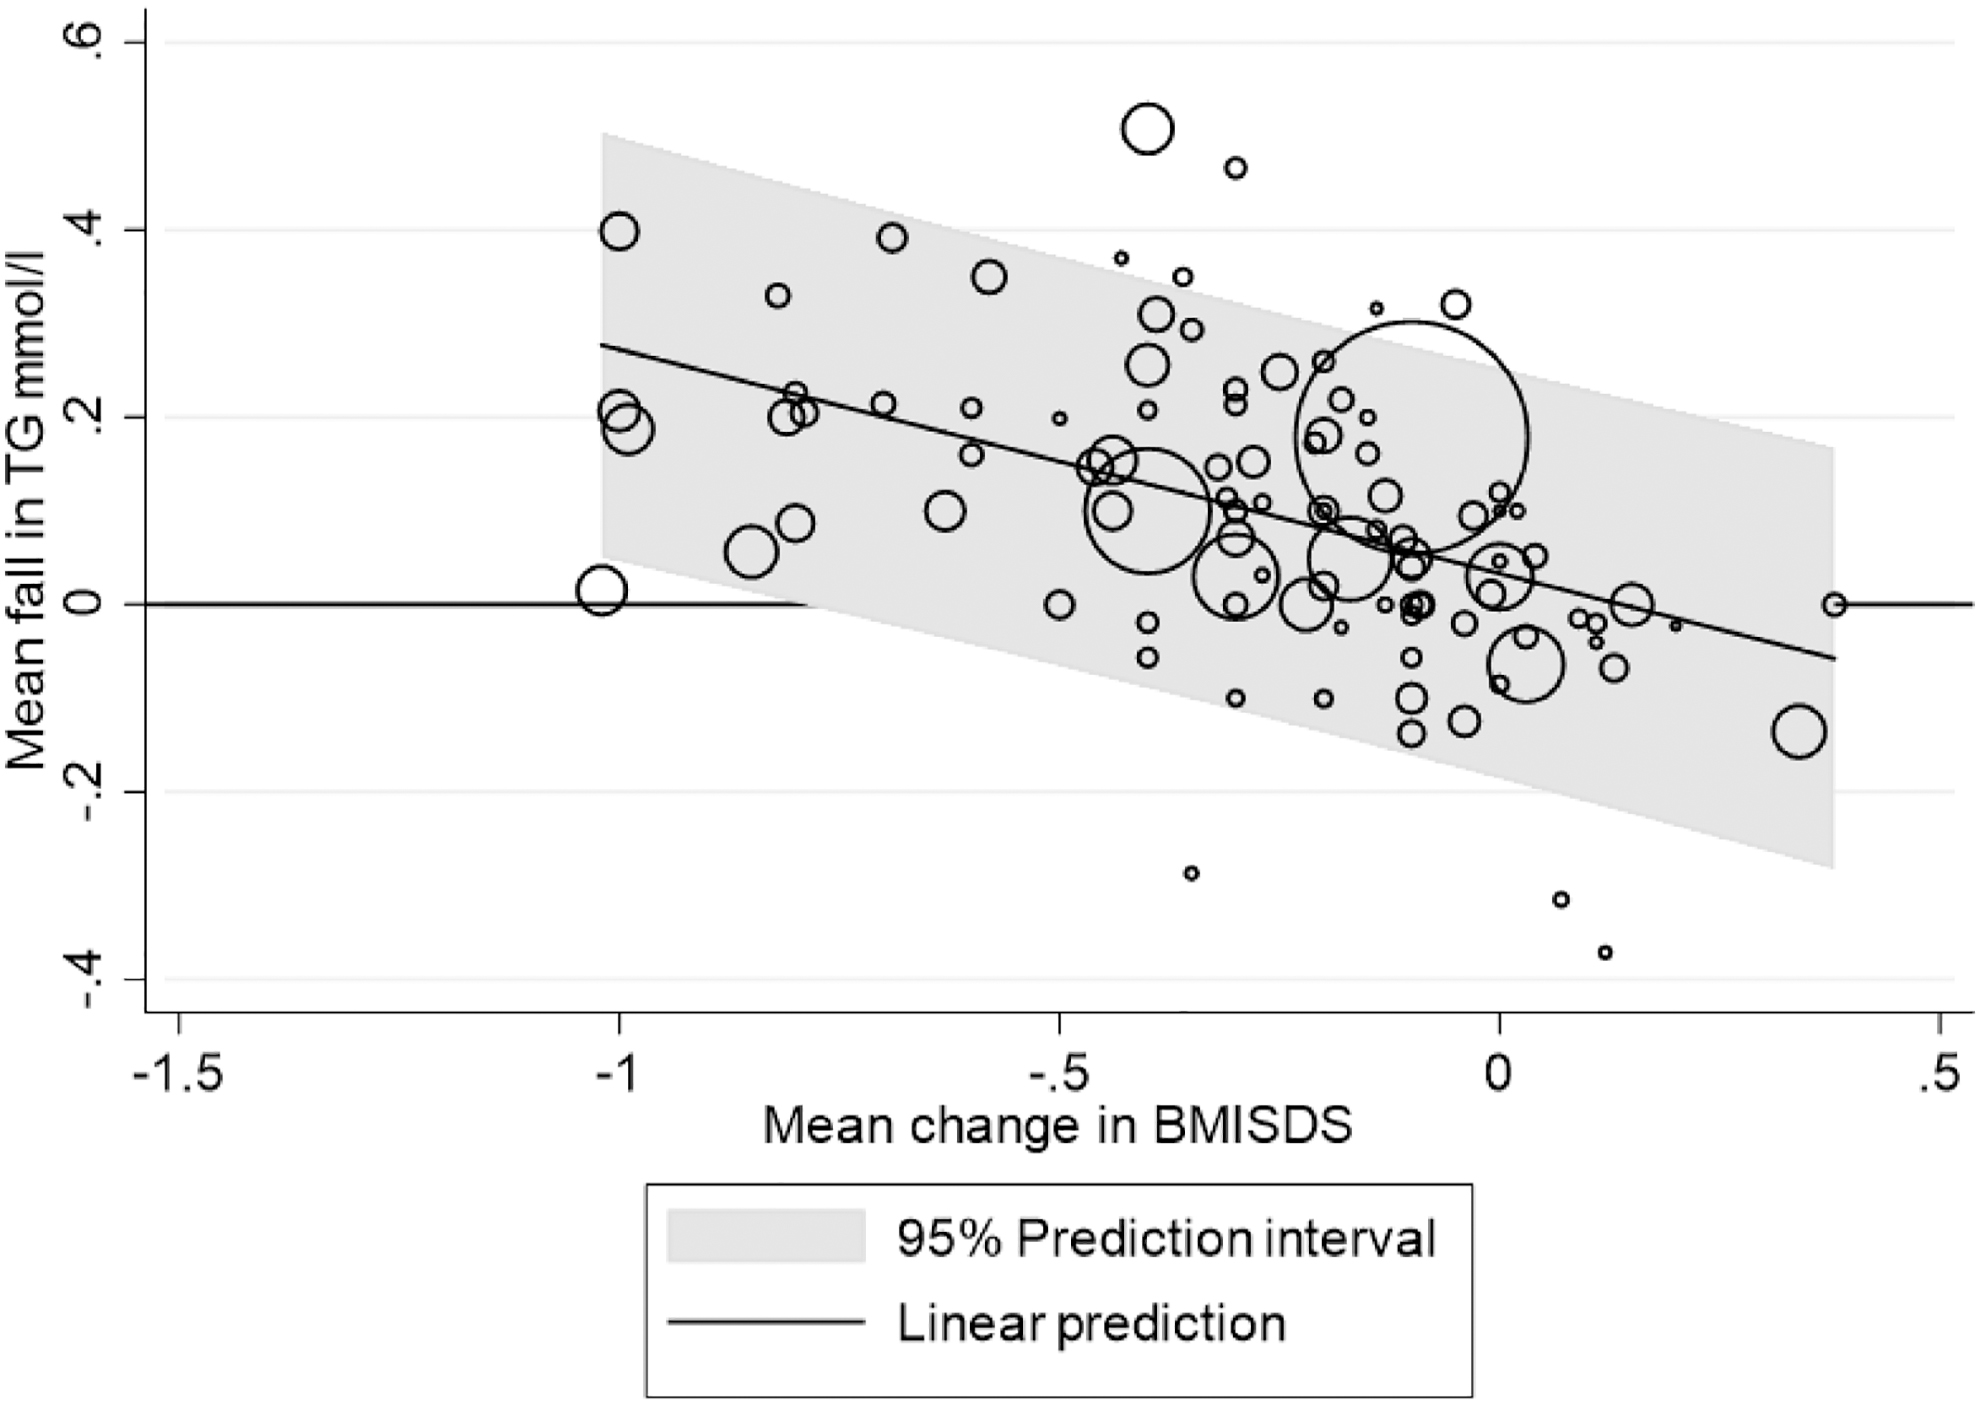
The 95% PI suggests that a mean BMI-SDS reduction of 0.7 would be needed to ensure a reduction in mean TG. The standardized predicted random effects were approximately normal (Appendix Fig. A4(B)). As added predictors, the percentage of women and the length of the study did not significantly affect the mean change in TG (p = 0.21 and p = 0.14, respectively).
Discussion
Summary of Main Results
The objective of this article was to establish the minimum change in BMI-SDS required to improve BP and lipid profile in children and adolescents with obesity in a clinical trial intervention. Seventy-one of the 90 included studies reported on BP and lipid profile measurements, with 69 of the 71 studies ultimately analyzed; and SBP, HDL, LDL, and TG were included in the meta-regression. Change in BMI-SDS was significantly associated with changes in all four measurements; minimum mean reductions in BMI-SDS of 1, 1.2, and 0.7 would be needed to ensure improvements in SBP, LDL, and TG parameters, respectively, in any future clinical weight management trial.
An equivalent value for improvement in HDL could not be determined. Although there was a positive relationship between an increase in mean HDL and a reduction in BMI-SDS, the lower limit of the 95% PI for the increase in mean HDL was never higher than 0 within the range of BMI-SDS reduction seen here. A mean reduction of at least 1.22 would be needed to ensure this.
Strengths and Limitations
Currently, this is the first article to attempt to bring together all studies that have reported both a change in BMI-SDS and changes in BP and lipid profile measurements in the obese pediatric population. All 71 included studies were of moderate to high quality (Table 2 and Appendix A1) according to the HTA assessment tool. 36
This article is the third of three papers reporting on the findings from studies identified in a large systematic review. The last study analyzed was published in September 2017, 93 and therefore studies published in the past 2.5 years have not been included. The first two papers in this review series were published in August and December 2019, respectively.31,32
As expected, there was a high degree of methodological and statistical heterogeneity among the included studies. This was addressed by using random-effects meta-regression. Potential sources of heterogeneity include variations in sample populations with regards to number, gender, and ethnicity; pubertal status; intensity and duration of treatment and follow-up; variety of diet and exercise intervention; whether family members were involved in interventions; and the wide range of ages used in studies. Many studies did not report on all these variables, making it difficult to analyze their effect on meta-regression; however, gender and study duration were not significant confounders in the analyses shown (p > 0.05 for both).
Most of the studies included in this article were from the United States or Europe (n = 59). Unfortunately, there was a paucity of data from developing countries, and it is not possible to accurately extrapolate our results to the obese pediatric and adolescent demographics in lower-income countries. Another important factor to consider is the proportion of participants lost to follow-up. Attrition would likely have affected both change in BMI-SDS and changes in cardiovascular risk factors but would have unlikely affected the relationships between both variables.
The systematic methods employed to identify the included studies were stringent, with the inclusion of published literature in all languages to avoid publication bias, but it is possible that some relevant studies might have been missed. In addition, there was variation in the reporting of results where there were multiple publications of the same study; in these cases, results from the most comprehensive paper were used.
At extremes of body weight, the use of BMI-SDS is another important limitation to address. Vanderwall et al. describe BMI-SDS as a poor predictor of adiposity in children and adolescents with extreme obesity, particularly those younger than 9 years of age. 116 Alternative measures of pediatric adiposity, such as the percentage above the International Obesity Task Force 25 (IOTF-25) cut-off—an established BMI cut-off—have been described to be more accurate than BMI-SDS in severe obesity. 117 After comparing the relationship of BMI-SDS to the waist circumferences, skinfolds, and fat mass data of 30,003 children, Freedman et al. concluded that BMI-SDS is weakly associated with other measures of adiposity in severe obesity and suggested expressing extreme BMIs relative to the 95th percentile or as a percentage of the 95th percentile, as opposed to using BMI-SDS. 118 Despite this, BMI-SDS still continues to be widely used, including in recent publications. This is clearly apparent from the data available to us, which were almost entirely reported as BMI-SDS.
Previous literature has shown an increase in SBP, DBP, and BMI in older children. 119 Our inclusion criteria specified ages from 4 to 19 years, and most of the studies analyzed covered a wide range of ages (Table 1). We did not have access to individual participants' data to evaluate the potential influence of individuals' ages at baseline on cardiovascular risk factors. However, data from four subsets of children up to 10 years50,64,64 did not suggest a different relationship from the whole cohort.
The exclusion of four data subsets for SBP, HDL, and LDL; and seven data subsets for TG before analysis48,49,66,90,96 will likely have affected the outcome from the four meta-regression analyses and ultimately, 69 of the 71 studies reporting on cardiovascular outcomes were analyzed (Table 1). However, these subsets were impossible to compare due to the use of SBP-SDS,49,90 incorrect value for baseline TG IQR for the weight-loss subset 48 ; lack of reported mean change in BMI-SDS for each sub-group in Kolsgaard et al. 66 ; or inability to accurately determine SDs from the GMs of change in TG. 96 Moreover, many studies (69, 78, 58, and 85 SBP, HDL, LDL, and TG data subsets, respectively) did not report the SD of mean change in BMI-SDS.
The original authors were contacted to retrieve values, although responses were limited. Imputation methods were required to estimate the SD, based on the correlation between the absolute baseline and “end” value for SBP, HDL, LDL, and TG. However, this is not ideal, and authors should be encouraged to report both BMI-SDS change and SD—to facilitate future systematic reviews and meta-analyses. Finally, two outlier subsets76,109 were found to skew analyses for HDL and LDL.
Omitting the outlier Murer et al. 76 in the LDL analysis had no effect on the minimum mean BMI-SDS required to improve LDL. Similarly, in the HDL analysis, there was no minimum BMI-SDS determinable that would lead to a beneficial increase in HDL, regardless of whether the control group in Visuthranukul et al. 109 was omitted or not.
Agreements and Disagreements with Other Studies
Included in this review, a prospective cohort study by Ford et al. 16 evaluating the impact of an outpatient weight management clinic in the United Kingdom on BMI-SDS in 88 adolescents with obesity found that significant clinical benefits were evident with a BMI-SDS reduction ≥0.5, leading to a mean change in SBP, HDL, LDL, and TG from a baseline of −3.5 (−7.6 to 0.7), 0.09 (95% −0.01 to 0.18), −0.33 (−0.53 to −0.13), and 0.70 (GM) (0.59–0.84), respectively. These results differ after including all respective studies (minus outliers) in this review: suggesting that a minimum reduction in BMI-SDS of 1, 1.2, and 0.7 is required to ensure improvements in SBP, LDL, and TG; and that there was no discernible minimum change for HDL. This may be due to other confounding variables across the included 71 studies (n = 69 analyzed), which have been unaccounted for such as age, ethnicity, intensity and type of lifestyle intervention, and duration of follow-up; as well as the presence of alternative strong predictors of adult CVD, such as waist circumference and waist-to-height ratio (see clinical implications and recommendations for future research). Another prospective cohort study (n = 230; age range 7–17 years) by Kolsgaard et al. reported a mean reduction of BMI-SDS of −0.13 (p < 0.001) in their whole group after 1 year of intervention and linked this to a greater reduction in LDL. 66 Participants with a decrease in BMI-SDS ≥0.23 reduced their mean LDL and TG by 0.35 (SD 0.47; p < 0.001) and 0.12 (0.63; p = 0.02), respectively, as opposed to −0.1 (0.49; p < 0.001) and −0.03 (0.58; p = 0.02), respectively, for individuals who had an increase in BMI-SDS at follow-up. However, no association was found between BMI-SDS reduction and improvement in HDL when comparing individuals with increased BMI-SDS and those with a ≥ 0.23 reduction [mean change 0.02 (0.23) vs. −0.04 (0.18); p = 0.15]. These findings are in keeping with the HDL, LDL, and TG analyses (Figs. 3–5) in this study; although this study was not included in this meta-regression, due to the lack of individual mean change in BMI-SDS reported for each of the four subgroups.
Our analysis in this review shows that BMI-SDS changes must be of a magnitude (>0.7) rarely achieved in lifestyle intervention trials worldwide, to improve BP and lipid profile parameters. Previous meta-analyses have demonstrated a reduction in BMI-SDS after lifestyle intervention of −0.06 (95% CI −0.12 to −0.01) in children younger than 12 years and −0.14 (95% −0.18 to −0.10) in children 12 years and older at 6 months' follow-up. 21 A meta-analysis of 33 RCTs by Ho et al. illustrated a reduction of −0.10 (95% CI −0.18 to −0.02) in BMI-SDS at 1 year from baseline with lifestyle interventions. 22 Colquitt et al. found a mean reduction of −0.3 in BMI-SDS across 4 low-quality evidence RCTs, at 6–12 months of follow-up (95% CI −0.4 to −0.2). 23
Recent meta-analyses by Al-Khudairy et al. and Mead et al. have shown that although lifestyle interventions in overweight and obese participants lead to significant reductions in BMI-SDS −0.34 (95% CI −0.66 to −0.02) in participants aged 12–17 years; and −0.06 (95% CI −0.10 to −0.02) in participants aged 6–11 years; they are unlikely to lead to clinical improvements in metabolic health due to inconsistent results, risk of bias, and low quality of evidence.120,121
To predict an improvement in adiposity in children and adolescents with obesity, we have suggested that future studies require a BMI-SDS reduction of at least 0.6. 31 Likewise, in this article, we suggest a magnitude of change in BMI-SDS seldom achieved in clinical practice, and these results challenge the efficacy of childhood weight management trials, as well as the validity of BMI-SDS as a measure of adiposity at extremes of obesity. Further, we have described significant improvements in insulin resistance and inflammation with a reduction in BMI-SDS (p = 0.003 and 0.021, respectively), although no minimum reduction in BMI-SDS could be identified to predict an improvement in metabolic biomarkers. 32 These findings again highlight the importance of reporting additional indices of derived BMI values, which may better reflect changes in adiposity in children and adolescents with obesity.
Clinical Implications
Childhood obesity is a global health concern, with short- and long-term CVD risk implications, although there remains a paucity of data on the impact of BMI-SDS improvement through lifestyle modifications on cardio-metabolic risk. Setting a standard by which clinicians and researchers can assess the apparent success of their interventions should allow for the establishment of a clinically significant consensus on weight loss targets benefiting cardio-metabolic health in pediatrics, such as that seen in adult medical practice. 13 However, the analyses in this review demonstrate that the required BMI-SDS reduction must be of a value seldom achieved in trials. It is uncertain whether the positive effects on SBP, LDL, HDL, and TG were attributable to weight loss, or rather to aspects of the lifestyle intervention independent of weight loss, such as a reduction in saturated fat intake or increased physical activity.
Furthermore, although BMI has been heralded as a strong predictor for childhood CVD risk factors by many large longitudinal and cross-sectional studies,122–124 it is likely that there are many other contributing factors to child and adolescent CVD. These include waist circumference and waist-to-height ratio, which have been described by Savva et al. in a study evaluating 1987 children (950 girls) with a mean age of 11.4 ± 0.4 years, as a better predictor of CVD risk factors in children than BMI. 125
A cross-sectional study by Daniels et al., looking at one hundred ninety-two 7–17-year-old children, described that maturation stage, ethnicity, gender, and distribution of body fat should be interpreted with the results, if BMI is used as a measure of adiposity. 126 This study took into consideration the length of follow-up and gender, but perhaps when incorporating BMI-SDS targets into future studies, the other variables that have been cited should be taken into consideration, to reduce confounding bias. This is especially the case when looking at all HDL data subsets in this review—where a minimum beneficial change in BMI-SDS could not be determined, due to the 95% PI including 0, even at extremes of BMI-SDS reduction.
Recommendations for Future Research
The current literature base suggests that very few childhood weight management trials to date are likely to achieve the BMI-SDS reduction targets, illustrated by this review, which would lead to beneficial changes in SBP, LDL, and TG. There are likely to be many other factors impacting the results found. Therefore, further large-scale reviews with sub-group analyses for treatment type; setting and intensity; age, using a cut-off of 10 years to divide children and adolescents into subgroups 127 ; pubertal stage, according to Marshall and Tanner staging 114 ; ethnicity; gender; duration of treatment and follow-up; family involvement; and waist circumference and waist-to-height ratio should be sought to improve the reliability of these findings; to elucidate the optimal duration, intensity, and style of intervention; and to allow for cost-effectiveness analysis. Further research of lifestyle interventions is also required in developing or under-developed countries.
Further, as with other reviews looking at lifestyle interventions and a reduction in BMI-SDS, heterogeneity is a major issue, in addition to the inconsistency of results and reporting bias. Thus, authors should be encouraged to report mean BMI-SDS, mean weight change, and SDs for these data, to facilitate future systematic reviews and meta-analyses.
Conclusions
The prevention of atherosclerotic CVD is particularly achieved by instituting and maintaining optimum health behaviors early in life. Using meta-regression, a BMI-SDS reduction of 1 is needed to ensure an improvement in SBP outcome in future clinical trials reporting on pediatric weight management outcomes. Likewise, a reduction of 1.2 and 0.7 is required in future clinical trials to ensure improvements in LDL and TG, respectively; although a reduction in BMI-SDS was significantly associated with an improvement in HDL, an equivalent value for HDL could not be determined. These figures should provide a benchmark for apparent success in future research, clinical practice, and the commissioning of weight management guidelines.
Acknowledging the global burden of childhood obesity and the strong link between obesity and cardio-metabolic disease, dietary and physical activity professionals can use these results to judiciously support the cost-neutrality and effectiveness of their services as an integral component of public health and preventive cardiology. Further studies are needed to clarify the optimal duration, intensity, and setting for interventions—with cost-effectiveness analysis.
Ethical Considerations
All included studies have had their ethical approval taken into consideration before full analysis and inclusion.
Footnotes
Authors' Contributions
Dr. El-Medany managed the data, drafted and revised the article. Ms. Birch and Dr. Perry provided substantial contributions to the conception and design of the study; designed the data extraction instrument; performed electronic database searches, data screening, extraction, and quality assessment; coordinated and supervised data collection; and assisted with the drafting and revision of the article. Prof. Hamilton-Shield provided a substantial contribution to the conception and design of the study, conducted data screening and interpretation. Dr. Hunt provided statistical expertise in relation to study design, conducted the data analyses, and contributed to the drafting and revision of the article. Mr. Matson, Ms. Chong, and Ms. Beynon were involved in data acquisition and management. All authors approved the final article as submitted and agreed to be accountable for all aspects of the work.
Acknowledgment
The author would like to thank Dr. Suzanne Barr and the Preventive Cardiology faculty at Imperial College London for their support throughout the entire process.
Funding Information
This study was supported by the NIHR Biomedical Research Centre at University Hospitals Bristol NHS Foundation Trust and the University of Bristol. The views expressed in this publication are those of the authors and not necessarily those of the NHS, the National Institute for Health Research, or the Department of Health.
Author Disclosure Statement
Prof. Hamilton-Shield is a lead author on studies included in the systematic review that this article reports on. Dr. Hunt assisted with statistical analysis in Ford et al., 13 which was included in the systematic review that this article reports on. The other authors have no conflicts of interest to disclose.
References
Supplementary Material
Please find the following supplemental material available below.
For Open Access articles published under a Creative Commons License, all supplemental material carries the same license as the article it is associated with.
For non-Open Access articles published, all supplemental material carries a non-exclusive license, and permission requests for re-use of supplemental material or any part of supplemental material shall be sent directly to the copyright owner as specified in the copyright notice associated with the article.