
Abstract
Background:
Research indicates that youths with overweight and obesity often face difficulties in peer relationships. The current research examined longitudinal associations between youths' peer competence (i.e., successful interactions with peers), friendship quality (i.e., disclosure, conflict resolution, and companionship with a best friend), and body mass index (BMI) z-score when they were 3 to 15 years of age.
Methods:
A subsample of 1292 majority White families from the National Institute of Child Health and Human Development (NICHD) Study of Early Child Care and Youth Development (SECCYD) were included in the analyses. Measured height and weight were used to compute BMI z-scores. Youths reported on their friendship quality starting when they were 8–9 years. Peer competence was assessed with an observation of dyadic peer play when participants were 3 years old, and with maternal reports after that. Associations were examined using autoregressive cross-lagged path models.
Results:
Bidirectional associations between peer competence and friendship quality were noted when participants were 8–9 and 15 years old. Greater BMI z-scores when youths were 3 and 10–11 years old predicted lower peer competence when they were 15 and 11–12 years old, respectively. Peer competence when youths were 11–12 years old was negatively associated with BMI z-score at 15 years old. Multigroup Structural Equation Modeling (SEM) indicated that significant paths differed between boys and girls.
Conclusions:
Findings extend previous literature considering peer outcomes and weight by examining associations as early as 3 years old, and indicate the need for early outreach to buffer against detrimental effects on developing peer competencies, especially for girls.
Introduction
From childhood through adolescence, peers play an important role in social and emotional development.1–5 Early peer interactions allow for the assembly of social skills integral to later relationships and peer competence (defined here as youths' ability to successfully engage with peers, including following social rules and guidelines, engaging in effective communication, and understanding relationships between their own actions with the thoughts and needs of peers).6–8 In adolescence, peer status and close friendships become increasingly important, 9 youths rely on close friends more often for support, 10 and focus more on social status within the peer group. 11 Peer relationships can be particularly challenging for youth who stand out among the crowd. For youths with overweight and obesity, peer relationships may be particularly difficult, given the societal stigmatization of individuals with a larger body size.12,13 Given the role peer relationships play in building social competencies, it is important to understand how associations with weight may change over time. Toward this goal, this study examined longitudinal associations between peer competence, friendship quality, and weight status for youth participants from 3 to 15 years of age, using an analysis sample from the National Institute of Child Health and Human Development (NICHD) Study of Early Child Care and Youth Development (SECCYD).
Background Literature
A growing body of literature indicates that youths with overweight or obesity, or perceived to be outside of weight norms, are more likely to report peer victimization experiences (e.g., name calling, social exclusion, threats, physical aggression).17–21,27 These associations have been noted as early as 5 years of age,14,22 and longitudinal studies indicate increases in reports of victimization over time in relation to increasing weight.14,23 Youths with overweight are also more likely to report being neglected by their peers, have more negative peer interactions, and be socially isolated from the peer group.24–26 Peer interactions provide a context in which youth can learn social skills and develop interpersonal competence,29–32 and as such, youths with overweight or obesity who experience victimization and isolation may not have the opportunity to develop such skills as readily as their peers. For example, research with 8- and 9-year olds suggests that children who are bullied by peers report lower self-perceived social competence and global self-worth than children who are not victimized or bullied. 28 Prior research also indicates associations in the opposite direction. For example, a study examining the bidirectional association between reports of peer victimization and body mass index (BMI) found that starting as early as age six, peer victimization predicted annual increases in BMI for girls. 14 Research considering social competence as a predictor of weight change found that self-reported social competence in third grade predicted weight change from third to fifth grade. 33
Some research considering friendship indicates that youths with overweight or obesity tend to be nominated less as a friend than peers,25,34 and, in particular, youths with overweight or obesity who are victimized have difficulty making friends. 20 However, the majority of studies indicate positive benefits of high-quality friendship for heavier weight youth. 35 For example, high social engagement with friends has been shown to buffer associations between weight and negative body image in sixth to tenth graders. 36 Adolescents with overweight or obesity who reported higher self-disclosure to a best friend were less likely to report peer victimization. 37 It may be the case that for these adolescents who have a high-quality best friendship, they do not need to seek out social interactions in the larger peer group and thus are not exposed to peer victimization experiences. However, research also indicates similarities in weight and weight control behaviors over time among friends,38,39,43 suggesting a complex association between friendship and weight.
Although the majority of studies of weight and peer relationships have been conducted with adolescents or adults, more recent research is finding similar associations during early childhood. Studies that ask children to rate photographs of peers find children rate heavier target peers more negatively, 40 and when asked about their willingness to help a peer, children as young as four are less likely to help an overweight than an average weight peer. 16 However, these studies also indicate stereotypes of thinness moderate associations, such that children who do not hold thinness stereotypes do not exhibit preferences related to weight. These findings are worrisome as they suggest weight-based stigmatization can start very early in childhood.
The Current Research
Given findings from the early childhood literature, it is important to understand how early associations between weight and youths' reports of peer competence and friendship quality may track into later years when peers take on increasing importance. The current study tracked longitudinal associations between ratings of peer competence, friendship quality, and BMI z-scores for youth participants from ages 3 to 15 years (Fig. 1). Based on prior research, we hypothesized the following: (H1) Peer competence and youths' reports of their friendship quality would be positively associated over time; (H2) bidirectional relationships between children's BMI and peer competence would be negative; and (H3) the associations between peer outcomes and weight would be stronger for girls.15,18,35,41,42 Associations between youths' reported friendship quality and weight are less clear in prior literature, and as such, tested associations were exploratory in nature.

Conceptual model.
Methods
Participants
The hypothesized associations were examined using a subsample of 1292 youth and families of the NICHD-SECCYD following a total of 1364 families from the birth of the child in 1991 until the child was 15 years old (for a detailed description, see NICHD Early Child Care Research Network, 2005). The subsample used in the current study included children who were not underweight during study periods and provided at least one measure of model variables. Table 1 describes the demographic characteristics of the analysis sample.
Analysis Sample Characteristics (n = 1292)
Demographic information, including child gender, marital status, maternal education, and child ethnicity, was obtained when the child was 1 month old. Family income refers to averaged family income reported at 6, 15, 24, and 36 months.
Two mothers and 211 families did not report marital status and family income, respectively.
Measures
Peer competence
Peer competence at 3 years old was measured in the observation of dyadic peer play at a child care arrangement or home setting. 44 The study child participated in a semistructured play session with a familiar same-sex child who was close in age, had been aquatinted with the study child for longer than 2 weeks, but who was not the study child's best friend or sibling. Children's interactions in three toy segments were videotaped and rated on a 5-point scale for seven prosocial behaviors (e.g., positive mood, cooperation, and concern for peers) 45 and the codes across three episodes were averaged. Two other behaviors, response to provocation and social problem solving, were coded based on the number of toy episodes (0–3) in which the study child showed the target behaviors. The peer competence score was computed by standardizing and averaging across the nine prosocial behaviors (α = 0.80), with a higher score representing children who were more positive and cooperative and resolved conflict in more prosocial manners. 45
Peer competence when participants were 8–9, 10–11, 11–12, and 15 years of age was assessed using the Social Skill Rating Scale (SSRS), 46 asking mothers to report the frequency of children's social behaviors with adults and other children (i.e., cooperation, assertion, responsibility, and self-control), with documented construct validity and reliability. 44 Mothers completed the 38-item questionnaire for the first three time points (when the child was 8–9, 10–11, 11–12 years old) and 40-item questionnaire when their child was 15 years old on a 3-point scale ranging from 0 (never) to 2 (very often). The peer competence, a priori subscale developed by NICHD-SECCYD, was indexed by averaging 10 items in the first three time points (α = 0.79, 0.77, 0.78)47–49 and 11 items when the child was 15 (α = 0.82). 50 For example, questionnaire items for peer competence include “joins group activities without being told,” “responds appropriately when hit or pushed by other children,” “gives compliments to friends or other children,” “is self-confident in social situation.” Higher total scores of peer competence indicate children's prosocial behavior toward peers and more positive and skilled reaction to peer's negative interaction.
Friendship quality
The Friendship Quality Questionnaire (FQQ), 51 including 20 questions and an initial warm-up question (i.e., “This friend and I live really close to each other.”), assessed children's perceptions of their friendship with their very best friend at the ages of 8–9, 10–11, 11–12, and 15. At 11–12 and 15 years of age, 8 more questions were asked to make it more suitable for adolescents. During the interview, children were asked to choose one of 5 cards designed reflecting a 5-point Likert scale (1-not at all true, 5-really true) in response to questions asking six aspects of their friendship: validation and caring (e.g., This friend and I make each other feel important and special.), conflict resolution (e.g., This friend and I always make up easily when we have a fight), conflict and betrayal (e.g., This friend and I argue a lot.), help and guidance (e.g., This friend and I loan each other things all the time.), companionship and recreation (e.g., This friend and I would always like to sit together at lunch.), and intimate exchange (e.g., This friend and I tell each other private things a lot.). 47 The total friendship quality score was computed as the weighted average of responses to the 20 or 28 items, with ratings on 4 conflict and betrayal items reversed (α = 0.87, 0.89, 0.93, 0.92).52–55 Higher values in the friendship quality measure refer to children who show more disclosure behaviors with their best friend, are given more caring and validation by the best friend, have an easier time getting over conflict, and spend more time in companionship and recreation with the best friend.
BMI-z scores
Children's weight and height were measured spanning early childhood (age 3) to adolescence (age 15). Certified visit coordinators conducted growth measure procedures 56 by following protocol manuals provided by NICHD Early Child Care and Youth Development. 57 Given the average height and weight, age- and gender-adjusted BMI z-scores were calculated using the Centers for Disease Control (CDC) growth references. 58 Children who were categorized as underweight at any measuring periods (n = 71) were excluded from the analysis sample.
Statistical controls
Based on previous literature, the current analysis included family income-to-needs ratio, maternal education years, and child temperament and ethnicity as statistical controls.26,59–62 Maternal years of education were obtained at the 1-month interview. Family income-to-needs ratio 63 was computed by averaging family income-to-needs ratio for 4 time points in early childhood (when the child was 6, 15, 24, and 36 months), with each one being calculated by dividing the family income by the federal poverty threshold for that family. 64 Children's temperamental negativity was assessed by mothers using a revised version of the Early Infant Temperament Questionnaire (EITQ) at 6 months. 65 Composite negative temperament scores were created by combining three subscales (i.e., mood, intensity, and adaptability; α = 0.81).66,67 Descriptive statistics for the model variables are presented in Table 2.
Descriptive Statistics for Model Variables
Higher values in peer competence refer to greater prosocial behaviors with peers. Greater friendship quality represents more positive and skilled friendship behaviors with their best friends. Greater BMI z-score indicates greater weight in relation to height. Maternal education represents years of education attained. High values in negative temperament reflect high negative mood, low adaptability, and high intensity. Ages under each measure refer to time points in which each measure was assessed.
BMI, body mass index.
Analytic Strategy
The analysis sample (n = 1292) was compared with cases excluded (n = 72) due to underweight status or missing values across all study variables. There were no significant differences between the analysis sample and the excluded sample in peer competence, friendship quality, BMI z-scores, and demographic variables. The missing values in the study variables were handled using full information maximum likelihood (FIML).70,71
Preliminary analyses were conducted with the IBM Statistical Package for Social Sciences (SPSS) Statistic 24. 68 An autoregressive cross-lagged path model and a nested multigroup SEM were analyzed in a consecutive order using M-plus version 7.4. 69
Multigroup SEM can proceed only if an unconstrained model, which assumes all parameters are potentially unequal across gender, fits the data adequately according to fit indices. Then, the models can be compared between gender through the specification of cross-group equality constraints that makes unstandardized estimates of parameters equal across gender. Worse fit of the constrained model to the data than the fit of the unconstrained model indicates that the model contains paths different between genders. The regression path different between genders is the one that increases the model fit when it is unconstrained. All statistical tests were performed at a significance level of α = 0.05.
Results
Descriptive Analysis
Bivariate correlations indicated positive associations between peer competence and friendship and negative correlations of BMI z-scores with peer competence and friendship quality (Supplementary Table S1).
Autoregressive Cross-Lagged Path Model
An autoregressive cross-lagged path model without differentiating gender was examined. Results showed that the initial autoregressive cross-lagged model indicated a good fit (χ 2 = 79.804, df = 37, p < 0.001, Comparative Fit Index [CFI] = 0.994, root mean square error of approximation [RMSEA] = 0.030, standardized root mean squared residual [SRMR] = 0.016) without meeting the criteria of having a nonsignificant chi-square, which was expected given the large sample size. Adding each of four regression paths subsequently made the model fit significantly better (Table 3) (χ 2 = 28.526, df = 33, p = 0.690, CFI = 1.000, RMSEA = 0.000, SRMR = 0.010).
Results of the Chi-Square Difference Test for the Autoregressive Cross-Lagged Model
A single-headed arrow (→) indicates a causal path from a predictor to an outcome variable.
p < .05, **p < .01, ***p < .001.
RMSEA, root mean square error of approximation; CFI, Comparative Fit Index; SRMR, standardized root mean squared residual.
Hypothesized bidirectional associations between peer competence and friendship (H1) and between peer competence and BMI (H2) were found to be significant (Fig. 2). Greater peer competence when participants were 8–9, 10–11, and 11–12 years of age predicted higher quality friendships 1 year after. Friendship quality when participants were 10–11 years old was positively related to peer competence at 11–12 years of age (β = 0.057, p < 0.05). In addition, BMI z-scores when participants were age 3 years and age 10–11 years predicted peer competence at age 15 years (β = −0.070, p < 0.05) and age 11–12 years (β = −0.075, p < 0.01), respectively. In the opposite direction, peer competence when participants were 11–12 years old was predictive of BMI z-scores at age 15 (β = −0.052, p < 0.05). BMI when participants were 10–11 years old showed a negative relation to friendship quality at age 11–12 years at a marginally significant level (β = −0.055, p = 0.057). Friendship quality, peer competence, and BMI z-scores showed strong stability over time (β's ranging from 0.388 to 0.924, p < 0.001).
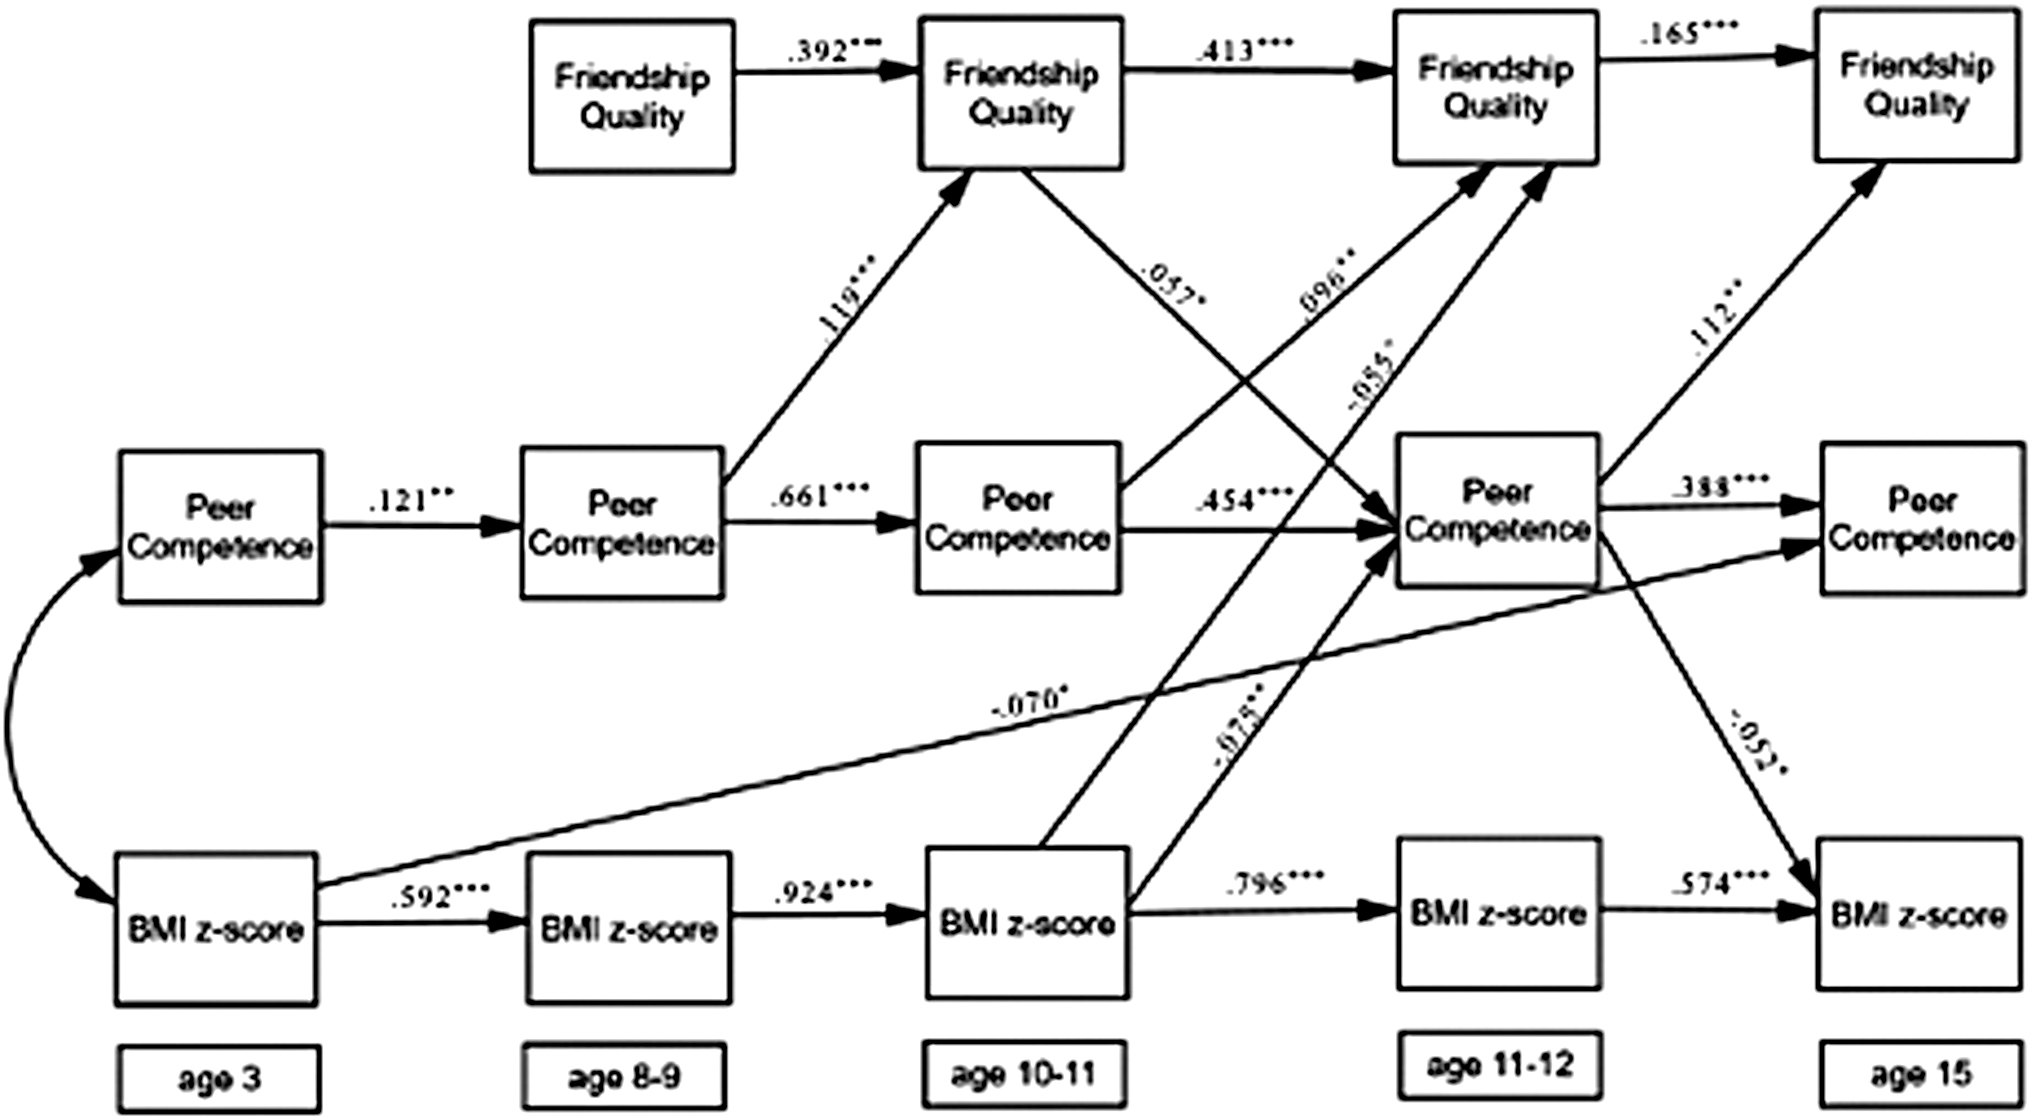
Autoregressive cross-lagged path model. Note. The model included the second-order stability paths and within-time correlations among constructs and used maternal education, family income-to-needs ratio, child ethnicity, and negative temperament as covariates (χ 2 = 28.526, df = 33, p = 0.690, CFI = 1.000, RMSEA = 0.000, SRMR = 0.010). +p = 0.057, *p < 0.05, **p < 0.01, ***p < 0.001. CFI, Comparative Fit Index; RMSEA, root mean square error of approximation; SRMR, standardized root mean squared residual.
Multigroup SEM
A nested model comparison was performed to examine whether the regression paths differed by gender. First, the unconstrained multigroup model fits the data well (χ 2 = 62.897, df = 66, p = 0.586, CFI = 1.000, RMSEA = 0.000, SRMR = 0.013; Fig. 3). A chi-square differential test confirmed that the model constraining all paths (χ 2 = 116.234, df = 100, p = 0.128, CFI = 0.998, RMSEA = 0.016, SRMR = 0.025) was a significantly worse fit to the data (χ 2 Δ = 53.337, df = 34, p < 0.05; Supplementary Table S2). A series of models relaxing each path were compared with the model with all paths constrained.

Multigroup SEM with standardized beta weights for girls (n = 628) and boys (n = 664). Note. Values before the slash are parameter estimates for girls. Values after the slash are parameter estimates for boys. The model included the second-order stability paths and within-time correlations among constructs and used maternal education, family income-to-needs ratio, child ethnicity, and negative temperament as covariates (χ 2 = 62.897, df = 66, p = 0.586, CFI = 1.000, RMSEA = 0.000, SRMR = 0.013). *p < 0.05, **p < 0.01, ***p < 0.001.
Hypothesized relationships were significant for both boys and girls, or either gender. Girls showed three significant relationships between peer competence and friendship quality from ages 8–9 through age 15 (Girls: β's ranging from 0.123 to 0.137, p < 0.01), and boys showed one significant path from ages 11–12 to age 15 (β = 0.103, p < 0.05). The opposite association, from friendship quality to peer competence, was significant for boys only from ages 10–11 to 11–12 (β = 0.066, p < 0.05). In addition, three significant paths from BMI z-scores to peer competence were found at multiple periods for girls only; (1) from age 3 to ages 8–9 (β = −0.095, p < 0.05), (2) from ages 10–11 to ages 11–12 (β = −0.090, p < 0.01), (3) from age 3 to age 15 (β = −0.106, p < 0.05). For boys, two negative relationships from peer competence at ages 11–12 to BMI z-scores at age 15 (β = −0.080, p < 0.05) and from BMI z-scores at ages 10–11 to friendship quality at ages 11–12 (β = 0.098, p < 0.05) were found.
Discussion
This study examined longitudinal associations between peer competence, friendship quality, and BMI z-scores for youth from ages 3 to 15 years using an analysis sample from the NICHD-SECCYD. Gender differences in the nature of these relationships were also examined. Our results indicated considerable rank-order stability in peer competence, friendship quality, and BMI-z scores over time. The autoregressive cross-lagged model also showed a good fit to the data suggesting that, overall, there were bidirectional associations between peer competence and friendship quality over time beginning at 8 years of age. This finding supports our hypothesis, is consistent with previous research, and highlights the importance of peer competence and friendship quality for children developing socioemotional and relationship skills.
Our second hypothesis was partially supported in the full model. That is, children who had a higher BMI at 3 and 10–11 years were reported to have lower peer competence at 15 and 10–11 years, respectively. Lower peer competence when youth were 11–12 years was also associated with a higher BMI at age 15. These data show that higher weight initially drove the association with lower peer competence, but that lower peer competence also contributed to the subsequent higher BMI at 15 years old. This is consistent with previous research showing that low social competence is associated with weight gain over time. 33 Importantly, our analysis also reveals that the interplay between weight and peer competence is evident in a national sample not selected based on risk factors for overweight/obesity or socioemotional difficulties, and across a wider age range than has been previously reported.
The full model findings differed by gender, supporting our third hypothesis. For girls, weight status was found to be inversely associated with peer competence at almost all time periods, and notably from age 3 to age 15. For boys, significant and inverse associations between weight and peer competence did not emerge until ages 10–11. This finding extends previous literature by documenting associations between higher weight status in early childhood, before formal schooling, and lower peer competence at ages 8–9 for girls. This is important because peak ages for peer bullying are between 6 and 9 years of age, and peer victimization has been shown to predict annual increases in BMI for girls starting at 6 years old. 14 Although this study did not examine peer victimization, the data suggest that high weight status affects subsequent social skills with peers, and that the development of these influences may vary by gender. Future studies are needed to shed light on specific behaviors and cognitions that impact weight-peer associations, including the possible mediating roles of body image, self-image, and eating behaviors.
Although bidirectional associations were found between peer competence and friendship quality over time, only one association was found between weight and friendship quality. Higher weight status was associated with lower friendship quality for boys only. Findings regarding friendship quality and weight status have been mixed, with some studies showing both a buffering role of close friendships in the associations between weight and negative body image, 72 and others revealing similarities in weight and weight control behaviors over time among close friends.38,39 For boys, weight status could be impacting friendship quality, and more research is needed to address this issue. It could also be that the effect of weight on friendship quality is indirect, through its impact on cognitions related to self-image or as a moderator, which was not the focus of this study. It should also be noted that questions regarding friendship quality were completed by the children, whereas peer competence was reported by mothers, which may account for differences in findings. However, strong bidirectional group-level associations were noted between friendship and peer assessments. Future studies are needed to investigate how competencies in the peer group and dyadic friendship relationships, measured using multiple methodologies over time, may differentially influence aspects of weight outcomes.
This study has several strengths, including (1) the analysis of longitudinal data from early childhood to adolescence; (2) the examination of both peer competence and friendship quality; and (3) the use of anthropometric assessments of weight status over time; and (4) the inclusion of important control variables in model testing. However, there are some limitations to the study. First, the NICHD SECCYD sample is representative of the 10 US sites where data were collected, but the proportion of nonwhite participants in this analysis sample was small. Therefore, examining the nature of these relationships in more diverse populations is needed. Second, only maternal reports of peer competence were obtained, and multi-informant and multimethod approaches would strengthen the findings. However, research suggests parent reports are appropriate peer assessment methodologies across early and middle childhood and into adolescence. 73 Despite these limitations, the findings from this study are a contribution to the literature. They suggest that, in addition to the impact of weight status on physical health, even as early as 3 years of age, having a higher weight status has implications for children's socioemotional health. Furthermore, attention to gender differences in the nature of these relationships is needed.
Conclusions
The development of peer competence and close friendships is key for social and emotional health, and having a higher weight status may put children at risk for lower peer competence over time. For girls, the impact of weight on peer competence may begin much earlier than for boys, highlighting the need for additional studies examining developmental timing and possible mechanisms accounting for these longitudinal associations and gender differences. The findings also emphasize the need to develop early prevention programs that target peer acceptance and reduce weight-related stigma.
Footnotes
References
Supplementary Material
Please find the following supplemental material available below.
For Open Access articles published under a Creative Commons License, all supplemental material carries the same license as the article it is associated with.
For non-Open Access articles published, all supplemental material carries a non-exclusive license, and permission requests for re-use of supplemental material or any part of supplemental material shall be sent directly to the copyright owner as specified in the copyright notice associated with the article.