
Abstract
Background:
Increased central (or abdominal) fat mass has been associated with cardiometabolic risk factors such as high low-density lipoproteins (LDL)-cholesterol or triglycerides (TG) concentration in children.
Objectives:
To generate pediatric reference centiles for trunk/leg fat mass ratio (T2L) (assessed by dual-energy X-ray absorptiometry [DXA]) and to evaluate the association of LDL-cholesterol and TG concentrations with T2L in children and adolescents.
Results:
The DXA results of 6538 children and adolescents (2629 females) were used to generate reference centiles for T2L. In girls, T2L was significantly associated with high LDL-cholesterol and TG concentration (odds ratio [OR] adjusted to FMI 1.69), (95% confidence interval [CI] 1.20–2.40), and 1.45 (95% CI 1.11–1.91, p = 0.003 and p = 0.008). In boys, T2L was significantly associated only with high TG concentration (OR adjusted to FMI 1.81 [95% CI 1.52–2.19, p < 0.001]).
Conclusions:
A central fat distribution seemed to be an independent risk factor for high TG concentrations in children and for high LDL-cholesterol only in girls. The first ethnicity-specific, pediatric reference centiles for T2L were presented.
Introduction
Defined by the World Health Organization (WHO) as abnormal or excessive fat accumulation that may impair health, 1 obesity is already a public health concern in childhood. The prevalence of obesity among children and adolescents in the United States has increased in the past decades 2 and was as high as 18.5% in 2015–2016, assessed by Z-scores for body mass index (BMI). 3 Childhood obesity has been associated with higher risk of adult obesity and has been regarded as a major risk factor for several comorbidities, including hypertension, dyslipidemia, cardiovascular diseases, and diabetes mellitus. 4
In addition, in previous studies, it has been repeatedly reported that the body fat distribution is a significant and independent cardiometabolic risk factor in children.5–9 Increased central (or abdominal) fat mass, consisting of an accumulation of both subcutaneous and visceral adipose tissues, has been highly associated with adverse health outcomes.7,10,11 Trunk fat has been positively associated to glucose concentration 12 and arterial stiffness, 13 whereas leg fat has been negatively associated. A negative association of fat mass in leg or gluteo-femoral regions with metabolic dysfunction has also been reported in children and adolescents.14,15
There are some proposed body measures to quantify central fat mass, such as waist circumference, waist-to-height ratio, and waist-to-hip ratio. The utility of these parameters as markers of metabolic disorders in children is yet unclear.16–18 Although this anthropometric indexes are easy to measure in clinical practice, they are only rough surrogates for central fat mass. Body fat mass and regional fat mass distribution can be evaluated more exactly by using dual-energy X-ray absorptiometry (DXA). 19 In adults, ratios of android/gynoid fat mass, trunk/limb fat mass, or trunk/leg fat mass are used to quantify central fat mass. 19 So far, there are no pediatric reference percentiles for the quantification of central obesity of children in the United States. Recently, reference percentiles for Indian children for android/gynoid were published. 20 Kelly et al. published also reference centiles for quantifying central fat mass by using DXA in the three major ethnicities in the United States, but only for adults (age ≥20 years). 21
The aim of our study was to generate pediatric reference centiles for trunk/leg fat mass ratio (T2L) assessed by DXA applicable for the three major ethnicities in the United States (non-Hispanic White, non-Hispanic Black, and Mexican American) and to evaluate the association of low-density lipoproteins (LDL)-cholesterol and triglycerides (TG) concentration with T2L in children and adolescents.
Here, we are presenting the first pediatric reference centiles for T2L assessed by DXA, to precisely quantify central adiposity in clinical practice and research settings.
Methods
Study Design
In the years 1999–2004, whole-body DXA scans were performed on randomly selected, noninstitutionalized participants of the National Health and Nutrition Examination Survey (NHANES) study, from the age of 8 years onward. 22
The NHANES includes a series of longitudinal cohort studies designed to assess the health and nutritional status of adults and children in the United States, combining interviews and physical examinations. The study examines a nationally representative sample of about 5000 people each year. A complex, multistage, probability study design is used for the patient recruitment. 23 We included the cross-sectional DXA data of the three major ethnicities in the United States (non-Hispanic White, non-Hispanic Black, and Mexican American). Exclusion criteria were a positive pregnancy test or the declaration of pregnancy on recruitment, as well as weight and height surpassing the limit of the Hologic DXA system (weight >136 kg or height >196.6 cm). We further excluded individuals with missing values of height or weight, and all individuals older than 19 years old (age range 8–19 years). The data of the eligible study population were used to generate the reference centiles. For the regression analysis, we further excluded all children and adolescents with missing fasting LDL-cholesterol concentrations or fasting TG concentrations.
The study was reviewed and approved by the National Center for Health Statistics Institutional Review Board. Written consent was obtained from all participants aged ≥18 years, whereas parental consent and child assent were obtained among children and adolescents.
DXA Measurement, Data Acquisition, and Reference Centiles
The whole-body DXA scans were conducted by using a Hologic QDR-4500A fan-beam densitometer (Hologic, Inc., Massachusetts, USA) in combination with the Hologic software v826:a3. The dataset was downloaded from the CDC server on the August 21, 2017 (https://wwwn.cdc.gov/Nchs/Nhanes/Dxa/Dxa.aspx).
The laboratory dataset was downloaded from the CDC server on February 11, 2019 [https://wwwn.cdc.gov/nchs/nhanes/search/DataPage.aspx?Component=Laboratory&CycleBeginYear=1999(2001,2003)].
The NHANES investigators replaced missing values by using a multiple-imputation methodology and published five random, independent datasets without missing values, to rule out for bias. We averaged these five datasets in one final dataset, since no methodology is known to average five independent percentiles. This method was already used by Fan et al. 24
The analytic guidelines for the NHANES dataset were published by Johnson et al. 25
Creation of Reference Centiles
We used Cole and Green's LMS method (lambda-mu-sigma)
26
to generate centile curves for T2L, applying a modified Box-Cox transformation to calculate ZLMS-scores (“a” corresponds to age):
We applied cubic spline interpolation to adjust the median value [M(a), corresponds to the 50th centile], the coefficient of variation (S(a)), and the skewness (L(a)) of the curve to the data with the maximum likelihood estimate. The functions M(a), S(a), and L(a) are age related, and the Z-score of a given data pair of age a and T2L can be determined with the given formulas. We used the Q-test by Royston and Wright and the Worm Plot by van Buuren and Fredriks to evaluate the goodness of fit of the model.27,28
We calculated the LMS model by using R Version 3.6.1 (R Foundation for Statistical Computing, Vienna, Austria) in combination with the packages GAMLSS (version 5.1.4). 29 We used the function gamlss with the distribution box cox Cole and Green (BCCG).
Definitions of High LDL-Cholesterol and TG Concentrations
In this study, we used the cutoffs recommended recently by the American College of Cardiology and the American Heart Association to define high LDL-cholesterol (≥130 mg/dL) and high TG concentrations (for age <10 years: ≥100 mg/dL, for age ≥10 years: ≥130mg/dL). 30
In NHANES, LDL-cholesterol and TG concentrations were measured by the Hitachi 704 Analyzer. 31 In total, in n = 2305 children and adolescents (females n = 925) fasting LDL-cholesterol and TG concentrations were measured (fasting time between 8.5 and 20 hours before phlebotomy). Children treated with drugs that may have an effect of the LDL-cholesterol or TG concentrations such as statins, estrogens, androgens, b-blockers, and carbamazepine (n = 19) were excluded from statistical analyses.
Analysis of the Relationship of Body Composition and LDL-Cholesterol and TG Concentrations
To evaluate the body composition, fat mass index (FMI) and T2L assessed by DXA scans were utilized. FMI was defined as
Linear regression was performed to evaluate the relationship between Z-scores for FMI and LDL-cholesterol and TG concentrations, respectively. In addition, linear regression was performed to evaluate the relationship between Z-scores for trunk/fat mass ratio and LDL-cholesterol and TG concentrations, respectively.
Since there was a significant correlation between FMI and T2L Z-scores (Supplementary Fig. S1; r = 0.42, p < 0.001), multivariate logistic regression analysis was performed with Z-scores for FMI and for T2L as the independent variables and LDL-cholesterol and TG concentrations as the dependent variables.
Statistical Analysis
We explored the normality of distribution by using Shapiro–Wilk test. We used t test to compare means of subgroups of normally distributed variables and Mann–Whitney U test for variables with non-normal distribution. Analysis of variance (ANOVA) or the Kruskal–Wallis test was used to compare more than two groups. We used the chi-square or exact Fisher test to study variables with binary distribution.
If not stated otherwise, results were given as mean (1 standard deviation [SD]). Statistical analyses were performed by using R Version 3.6.1 (R Foundation for Statistical Computing, Vienna, Austria).
Results
Study Population for Generating of Trunk/Leg Fat Mass Reference Centiles
The demographics of the study population are given in Supplementary Table S1. In total, the DXA results of 6538 children and adolescents (2629 females) were eligible.
Creation of Reference Centiles for T2L
The ethnicity-specific reference centiles for trunk/leg fat mass ratio for the non-Hispanic White, non-Hispanic Black, and Mexican American population are presented in Figure 1. The tabulated reference centiles for T2L are presented in Supplementary Tables S2, S3, S4, S5, S6, S7.
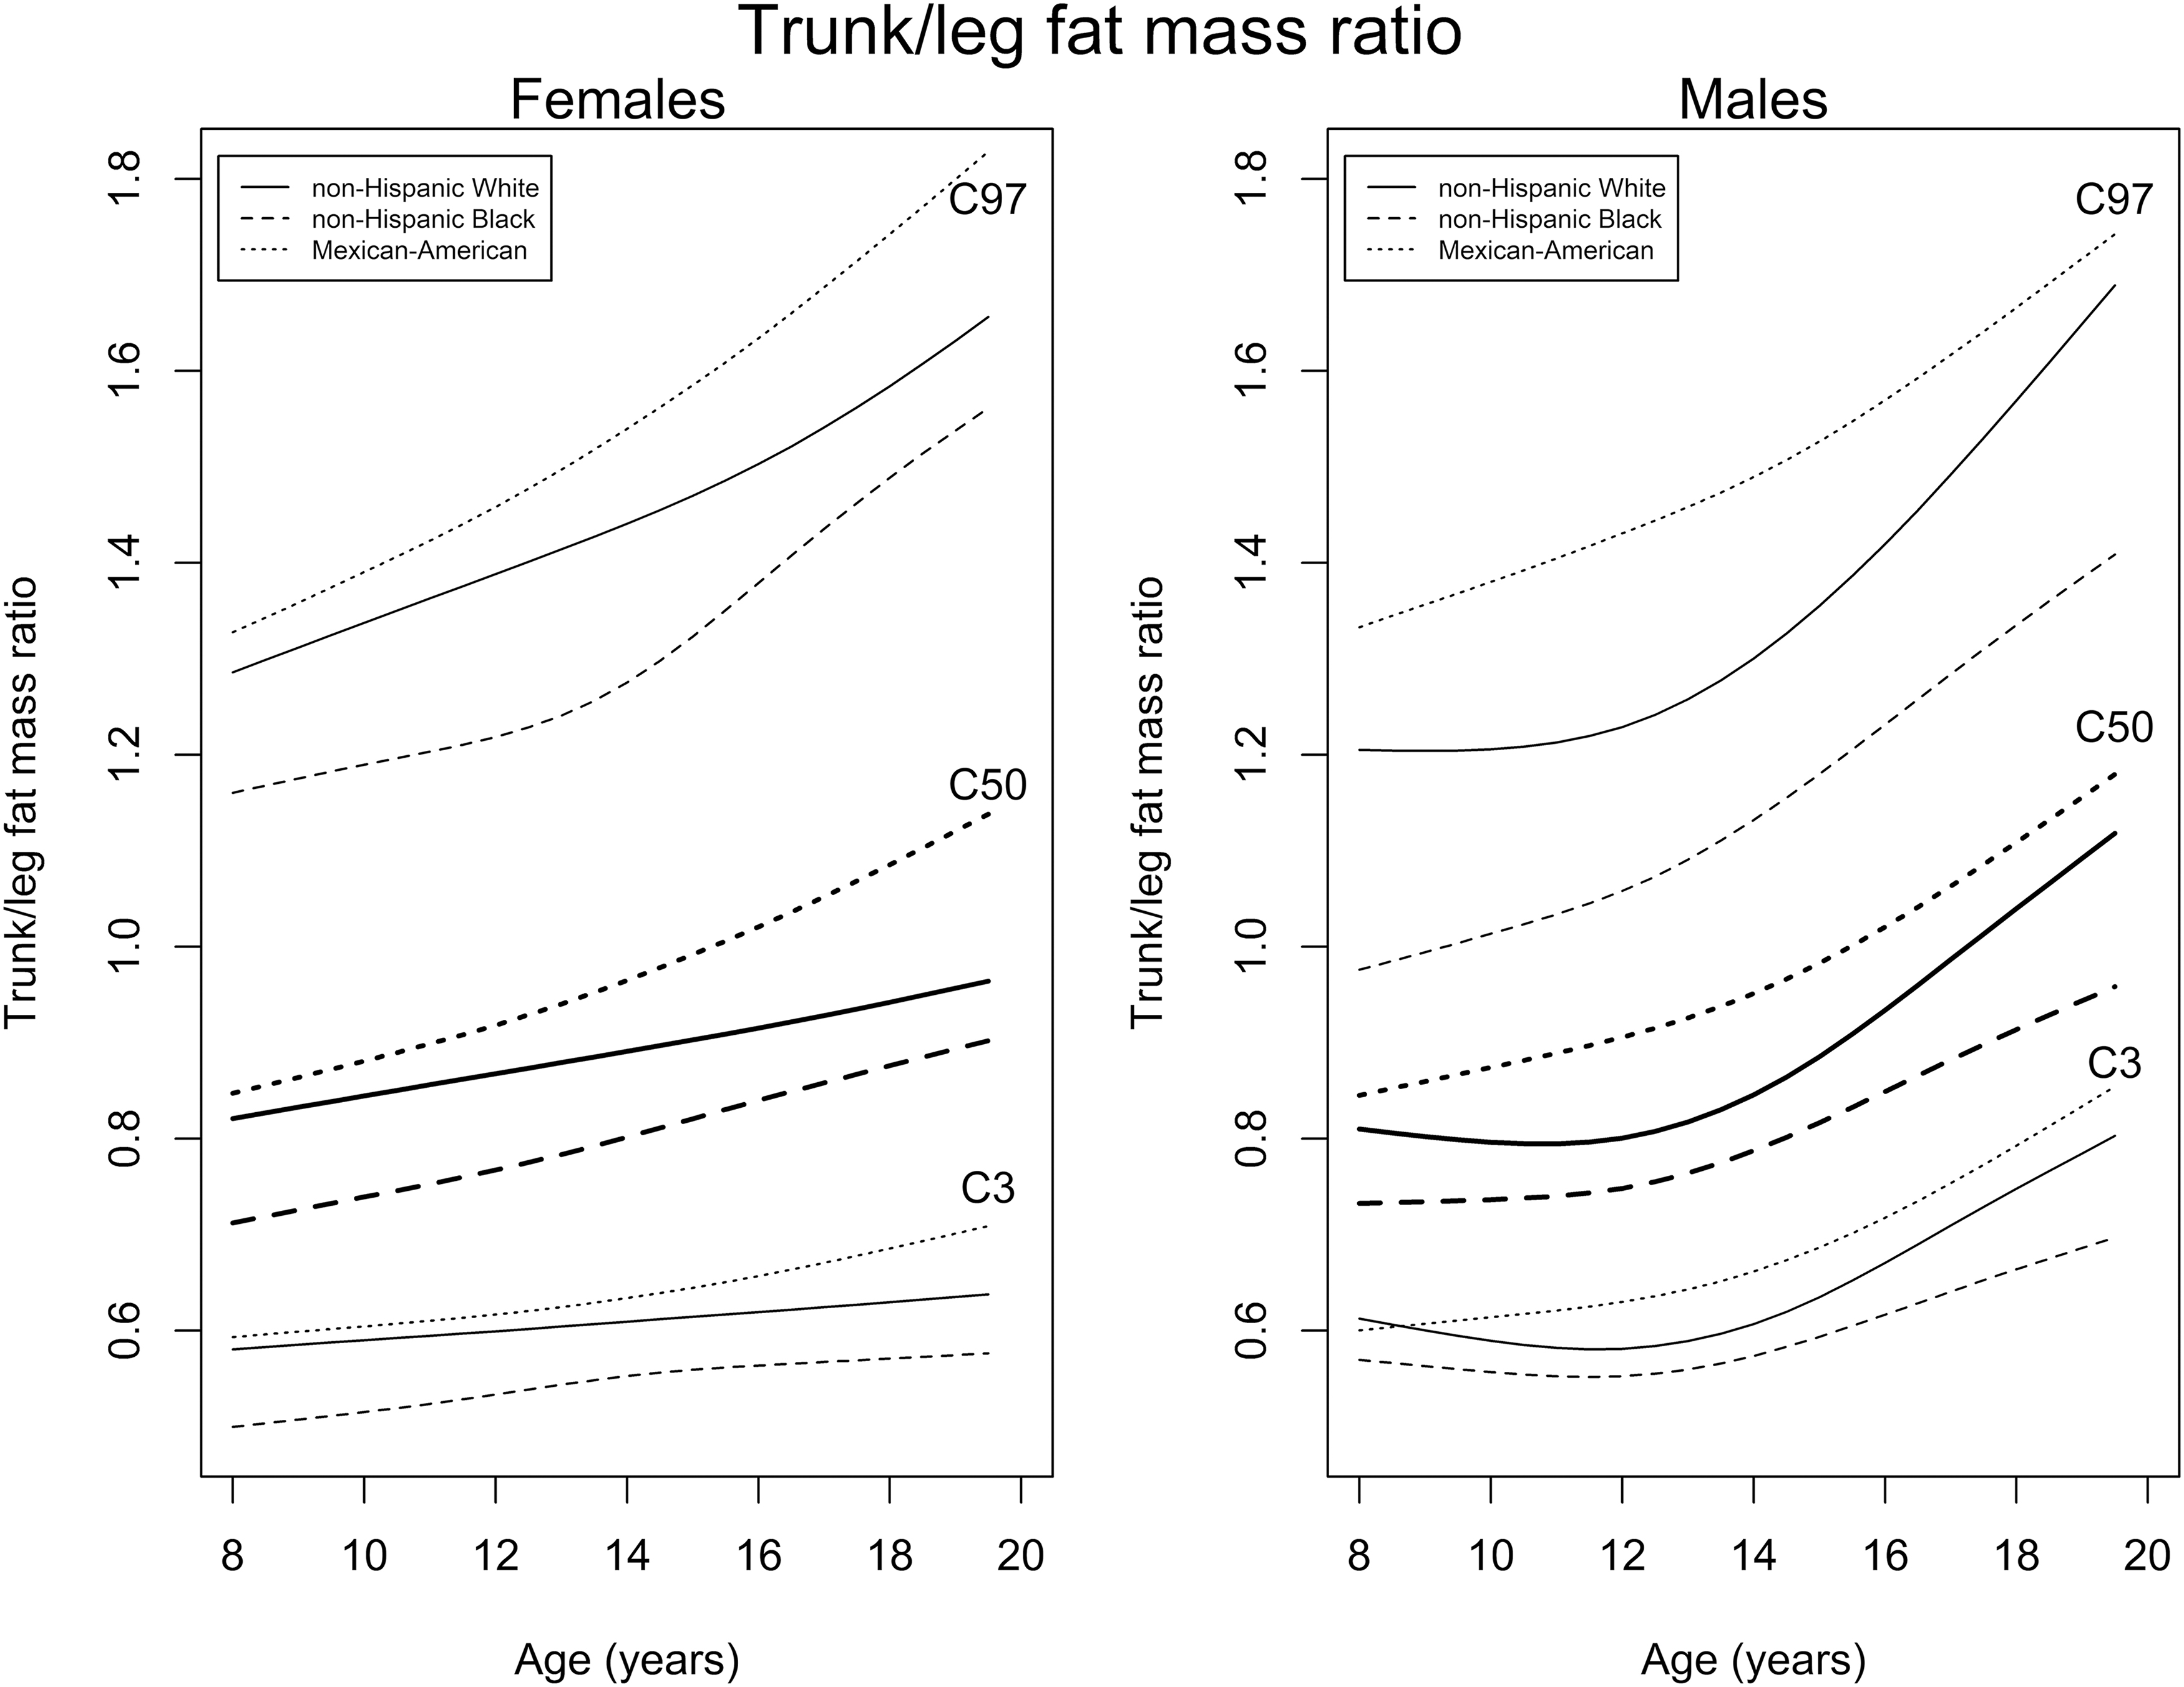
Reference percentiles for T2L. The reference percentiles for T2L of the three major ethnicities of the United States are shown. C3, C50, and C97 refer to the 3rd, 50th, and 97th percentiles. FMI, fat mass index; T2L, trunk/leg fat mass ratio.
Study Population for Evaluating LDL-Cholesterol and TG Concentrations
Data of 2286 children and adolescents (907 females; Table 1), with reported fasting LDL-cholesterol and TG concentrations, were eligible for the evaluation of the relationship of LDL-cholesterol and TG concentrations with FMI and T2L Z-scores.
Study Population for Low-Density Lipoproteins-Cholesterol and Triglycerides Analysis, by Ethnicity and Sex
Data are presented as mean (±SD) and count.
BMI, body mass index; FMI, fat mass index; SD, standard deviation.
Univariate Analysis of the Relationship of LDL-Cholesterol Concentration with Body Composition
In females, we found a significant positive correlation between LDL-cholesterol concentrations and FMI and T2L Z-scores (Pearson's r = 0.17 and r = 0.19, p < 0.001; Fig. 2). In males, we found a significant positive correlation between LDL-cholesterol concentrations and FMI Z-scores and trunk/leg fat mass ratio Z-scores (r = 0.27 and r = 0.20, p < 0.001; Fig. 3).

Body composition and LDL-cholesterol concentration in female.
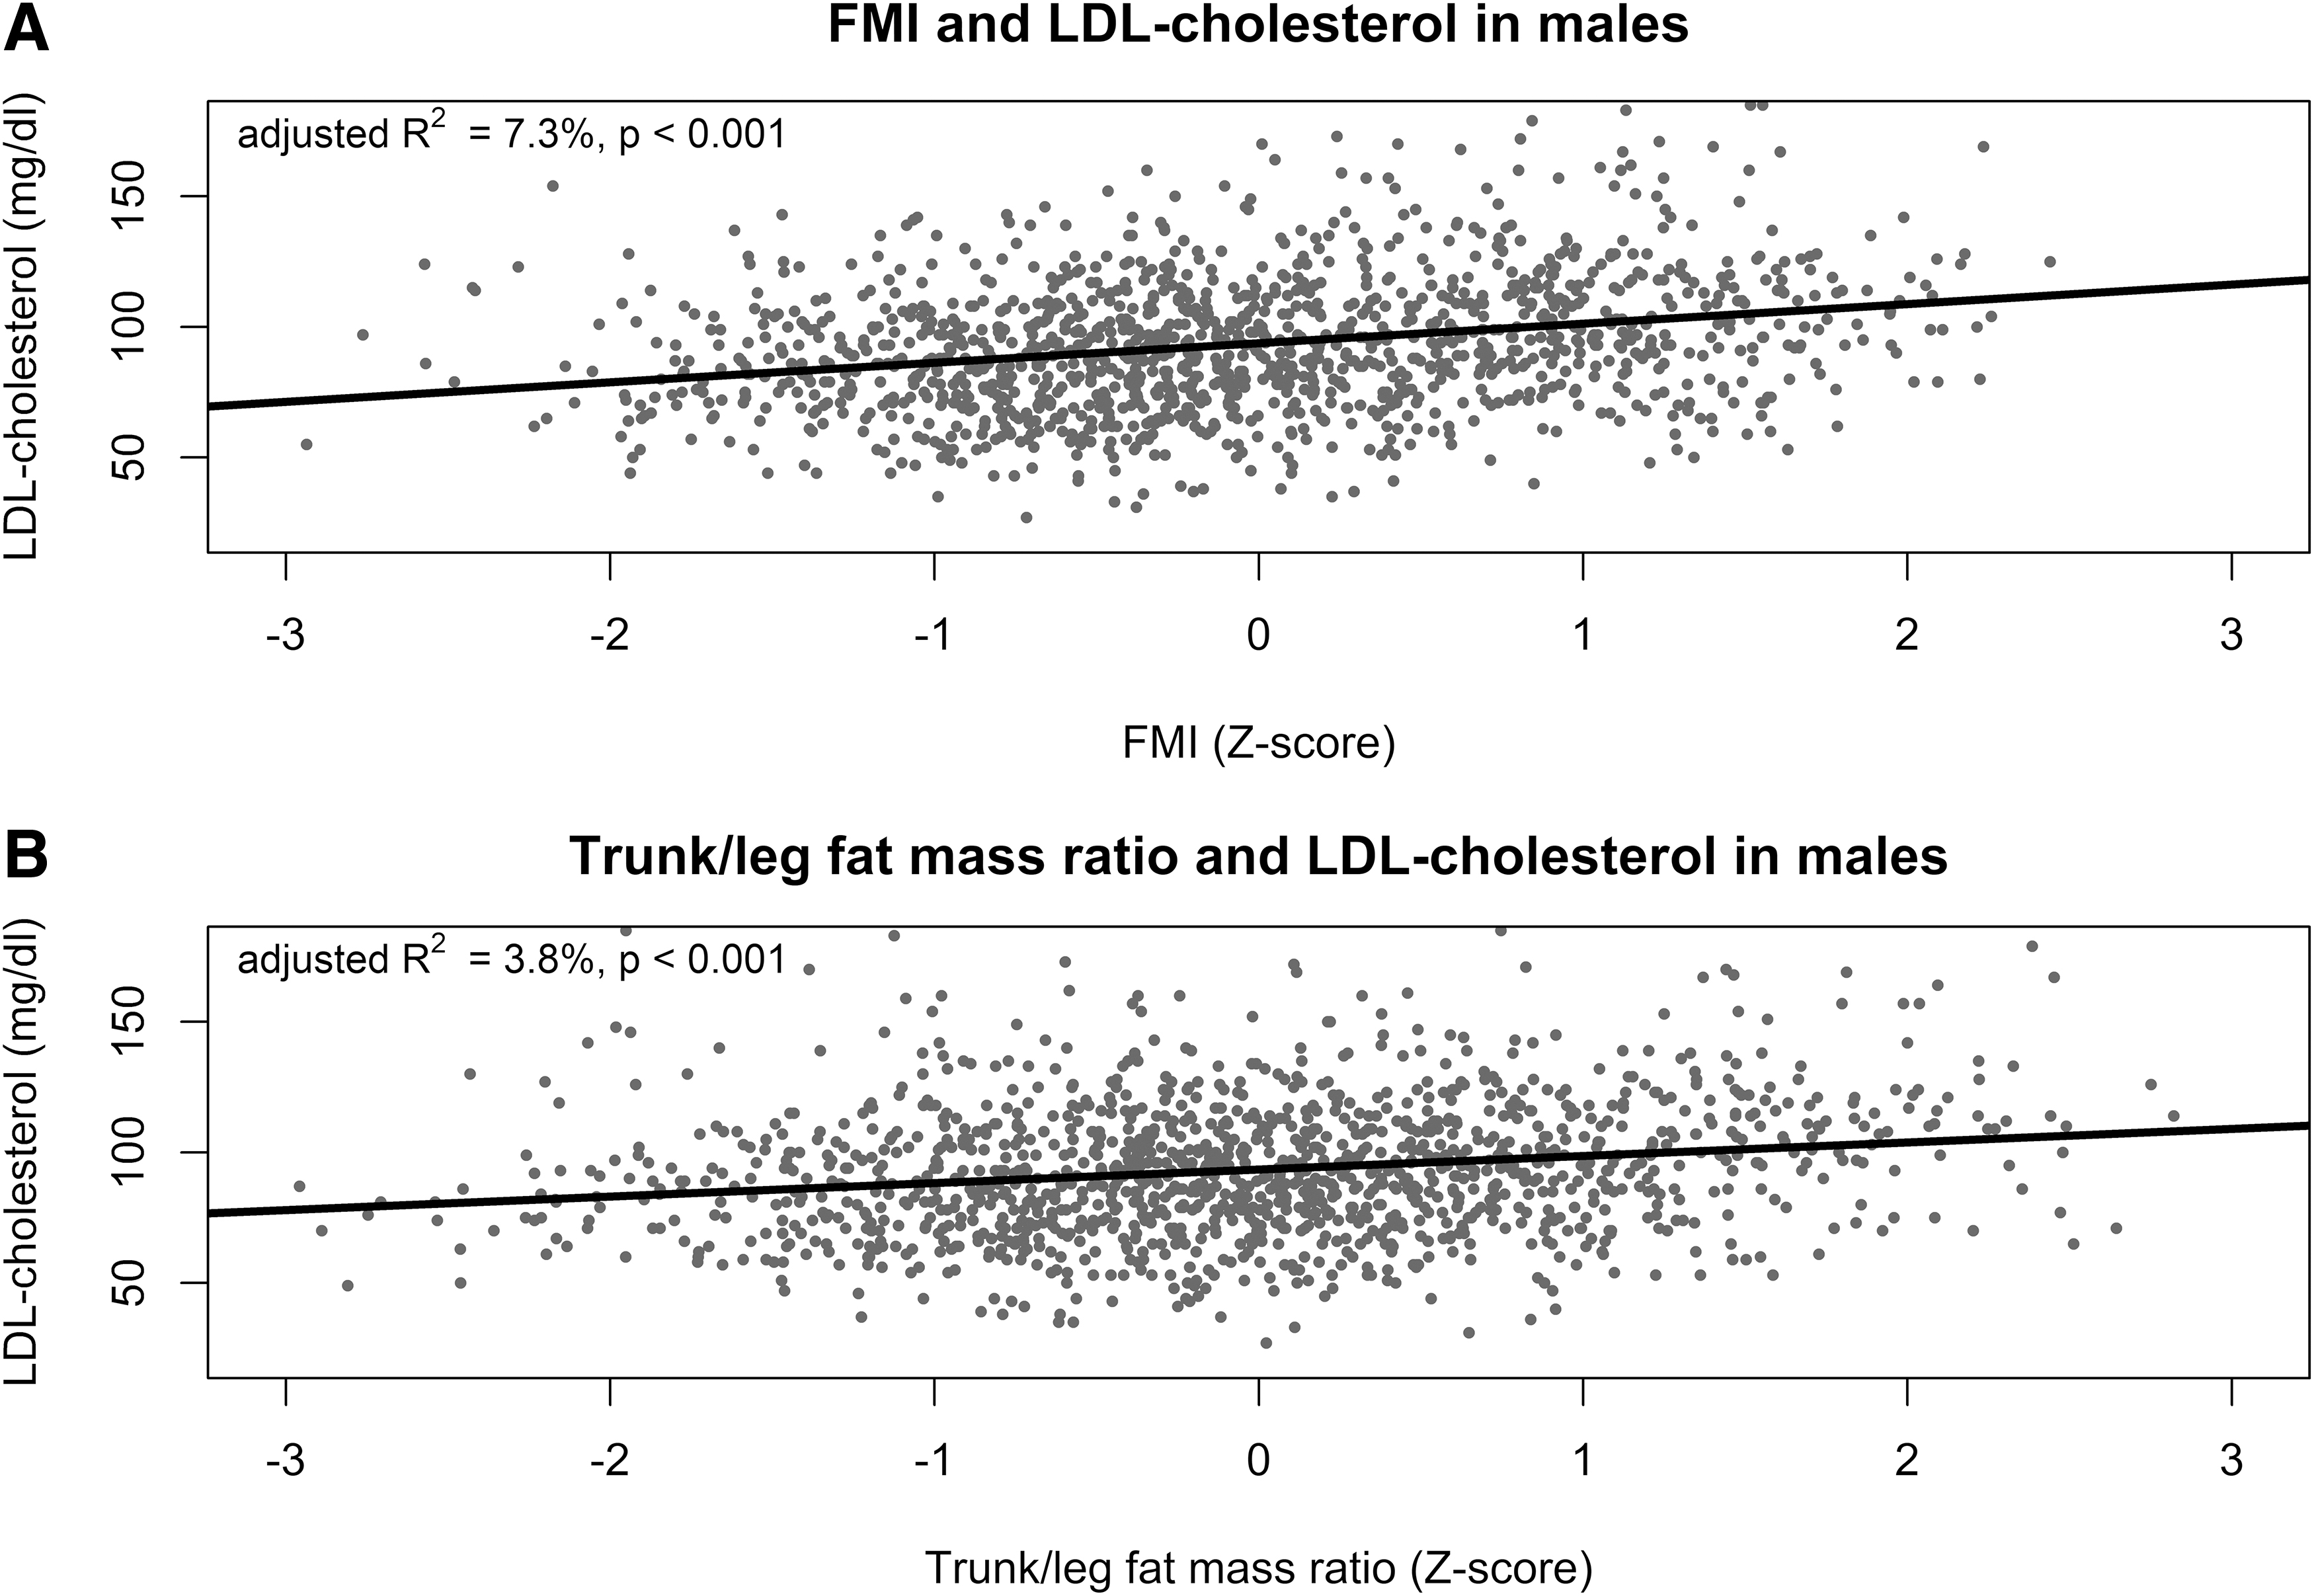
Body composition and LDL-cholesterol concentration in male.
Bivariate Analysis of the Relationship of LDL-Cholesterol Concentration with Body Composition
Figures 4 and 5 depict the results of the bivariate logistic regression with FMI and T2L Z-scores as independent variable. The binary dependent variable was the presence of high LDL-cholesterol concentration. In females, only T2L Z-score was a significant predictor for the presence of high LDL-cholesterol concentration (Table 2). In males, only FMI Z-scores was a significant predictor for the presence of high LDL-cholesterol concentration.
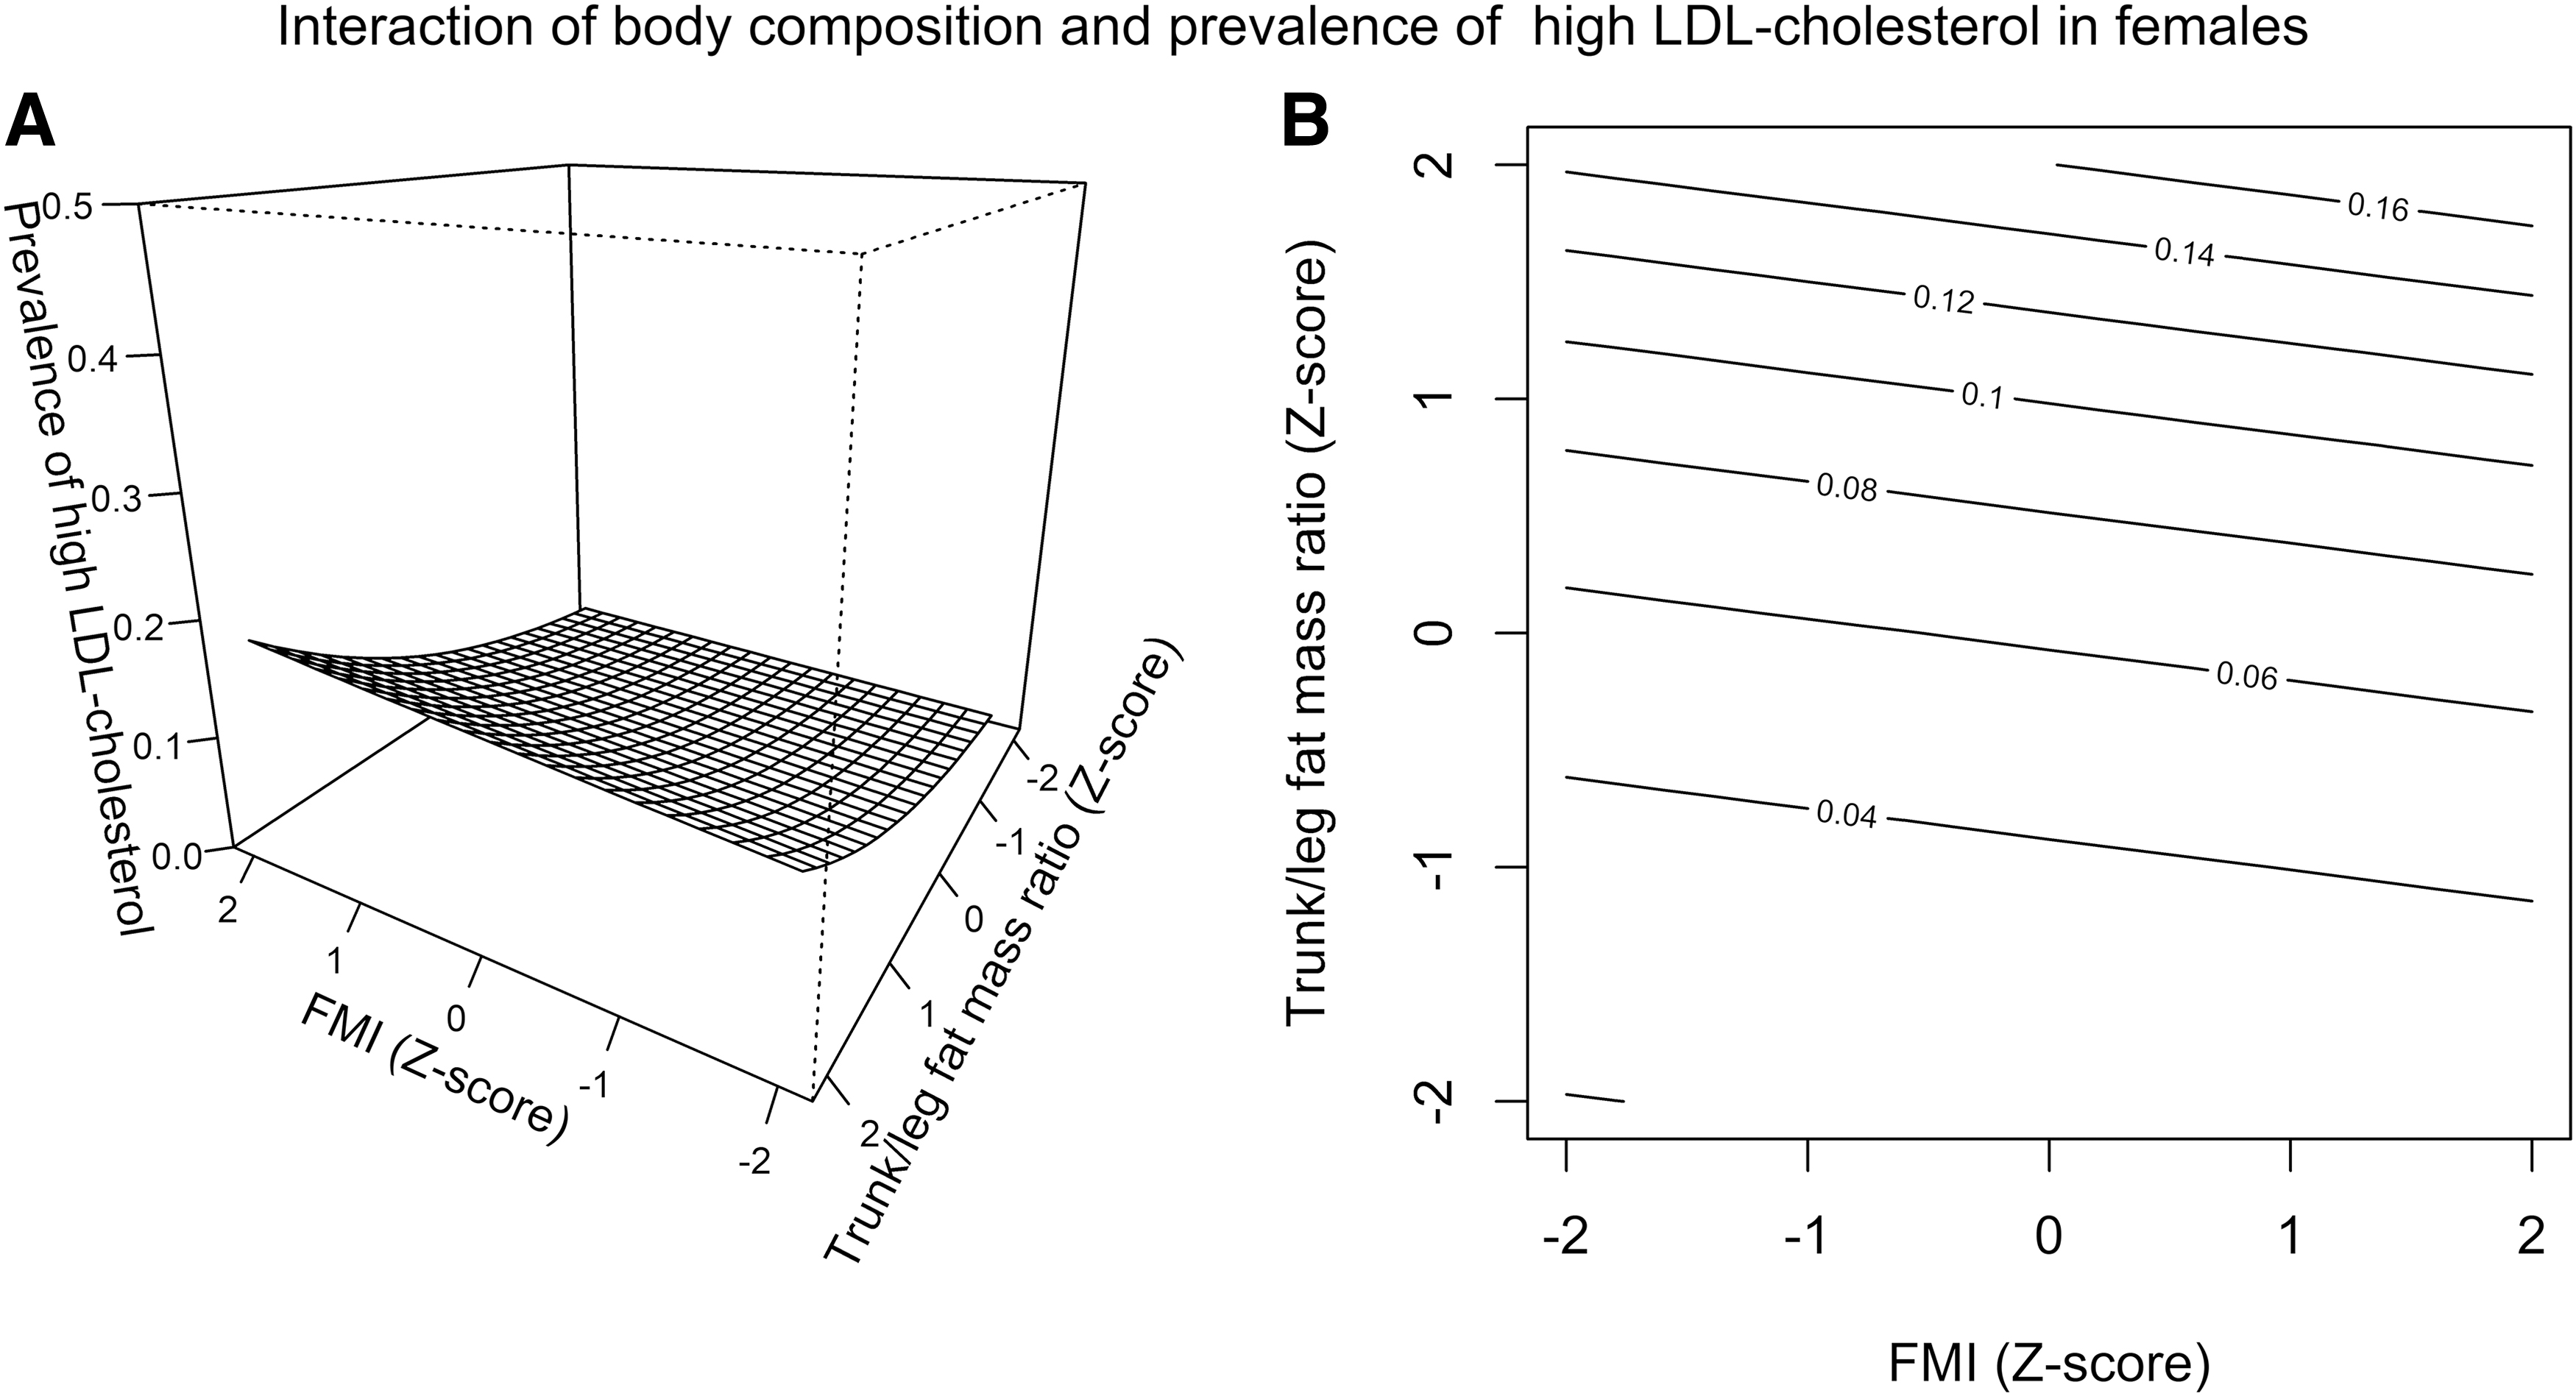
Interaction of body composition and prevalence of high LDL-cholesterol concentration in females.

Interaction of body composition and prevalence of high LDL-cholesterol concentration in males.
Association of Fat Mass Index and Trunk/Leg Fat Mass Ratio with the Prevalence of High Low-Density Lipoproteins-Cholesterol and Triglycerides Concentration
The results of the logistic regression are presented. The binary dependent variable was the presence of high LDL-cholesterol concentration, defined as ≥130 mg/dL or the presence of high triglycerides concentration, defined as ≥100 mg/dL for age <10 years or ≥130 mg/dL for age ≥10 years. The independent variables were the FMI and T2L Z-scores. For further details see Results section.
FMI, fat mass index; LDL, low-density lipoproteins; T2L, trunk/leg fat mass ratio; TG, triglycerides.
Univariate Analysis of the Interaction of TG Concentration with Body Composition
In females, we found a significant positive correlation between TG concentrations and FMI and T2L Z-scores (r = 0.24 and r = 0.27, p < 0.001; Fig. 6). In males, we found a significant positive correlation between LDL-cholesterol concentrations and FMI Z-scores and trunk/leg fat mass ratio Z-scores (r = 0.35 and r = 0.36, p < 0.001; Fig. 7).
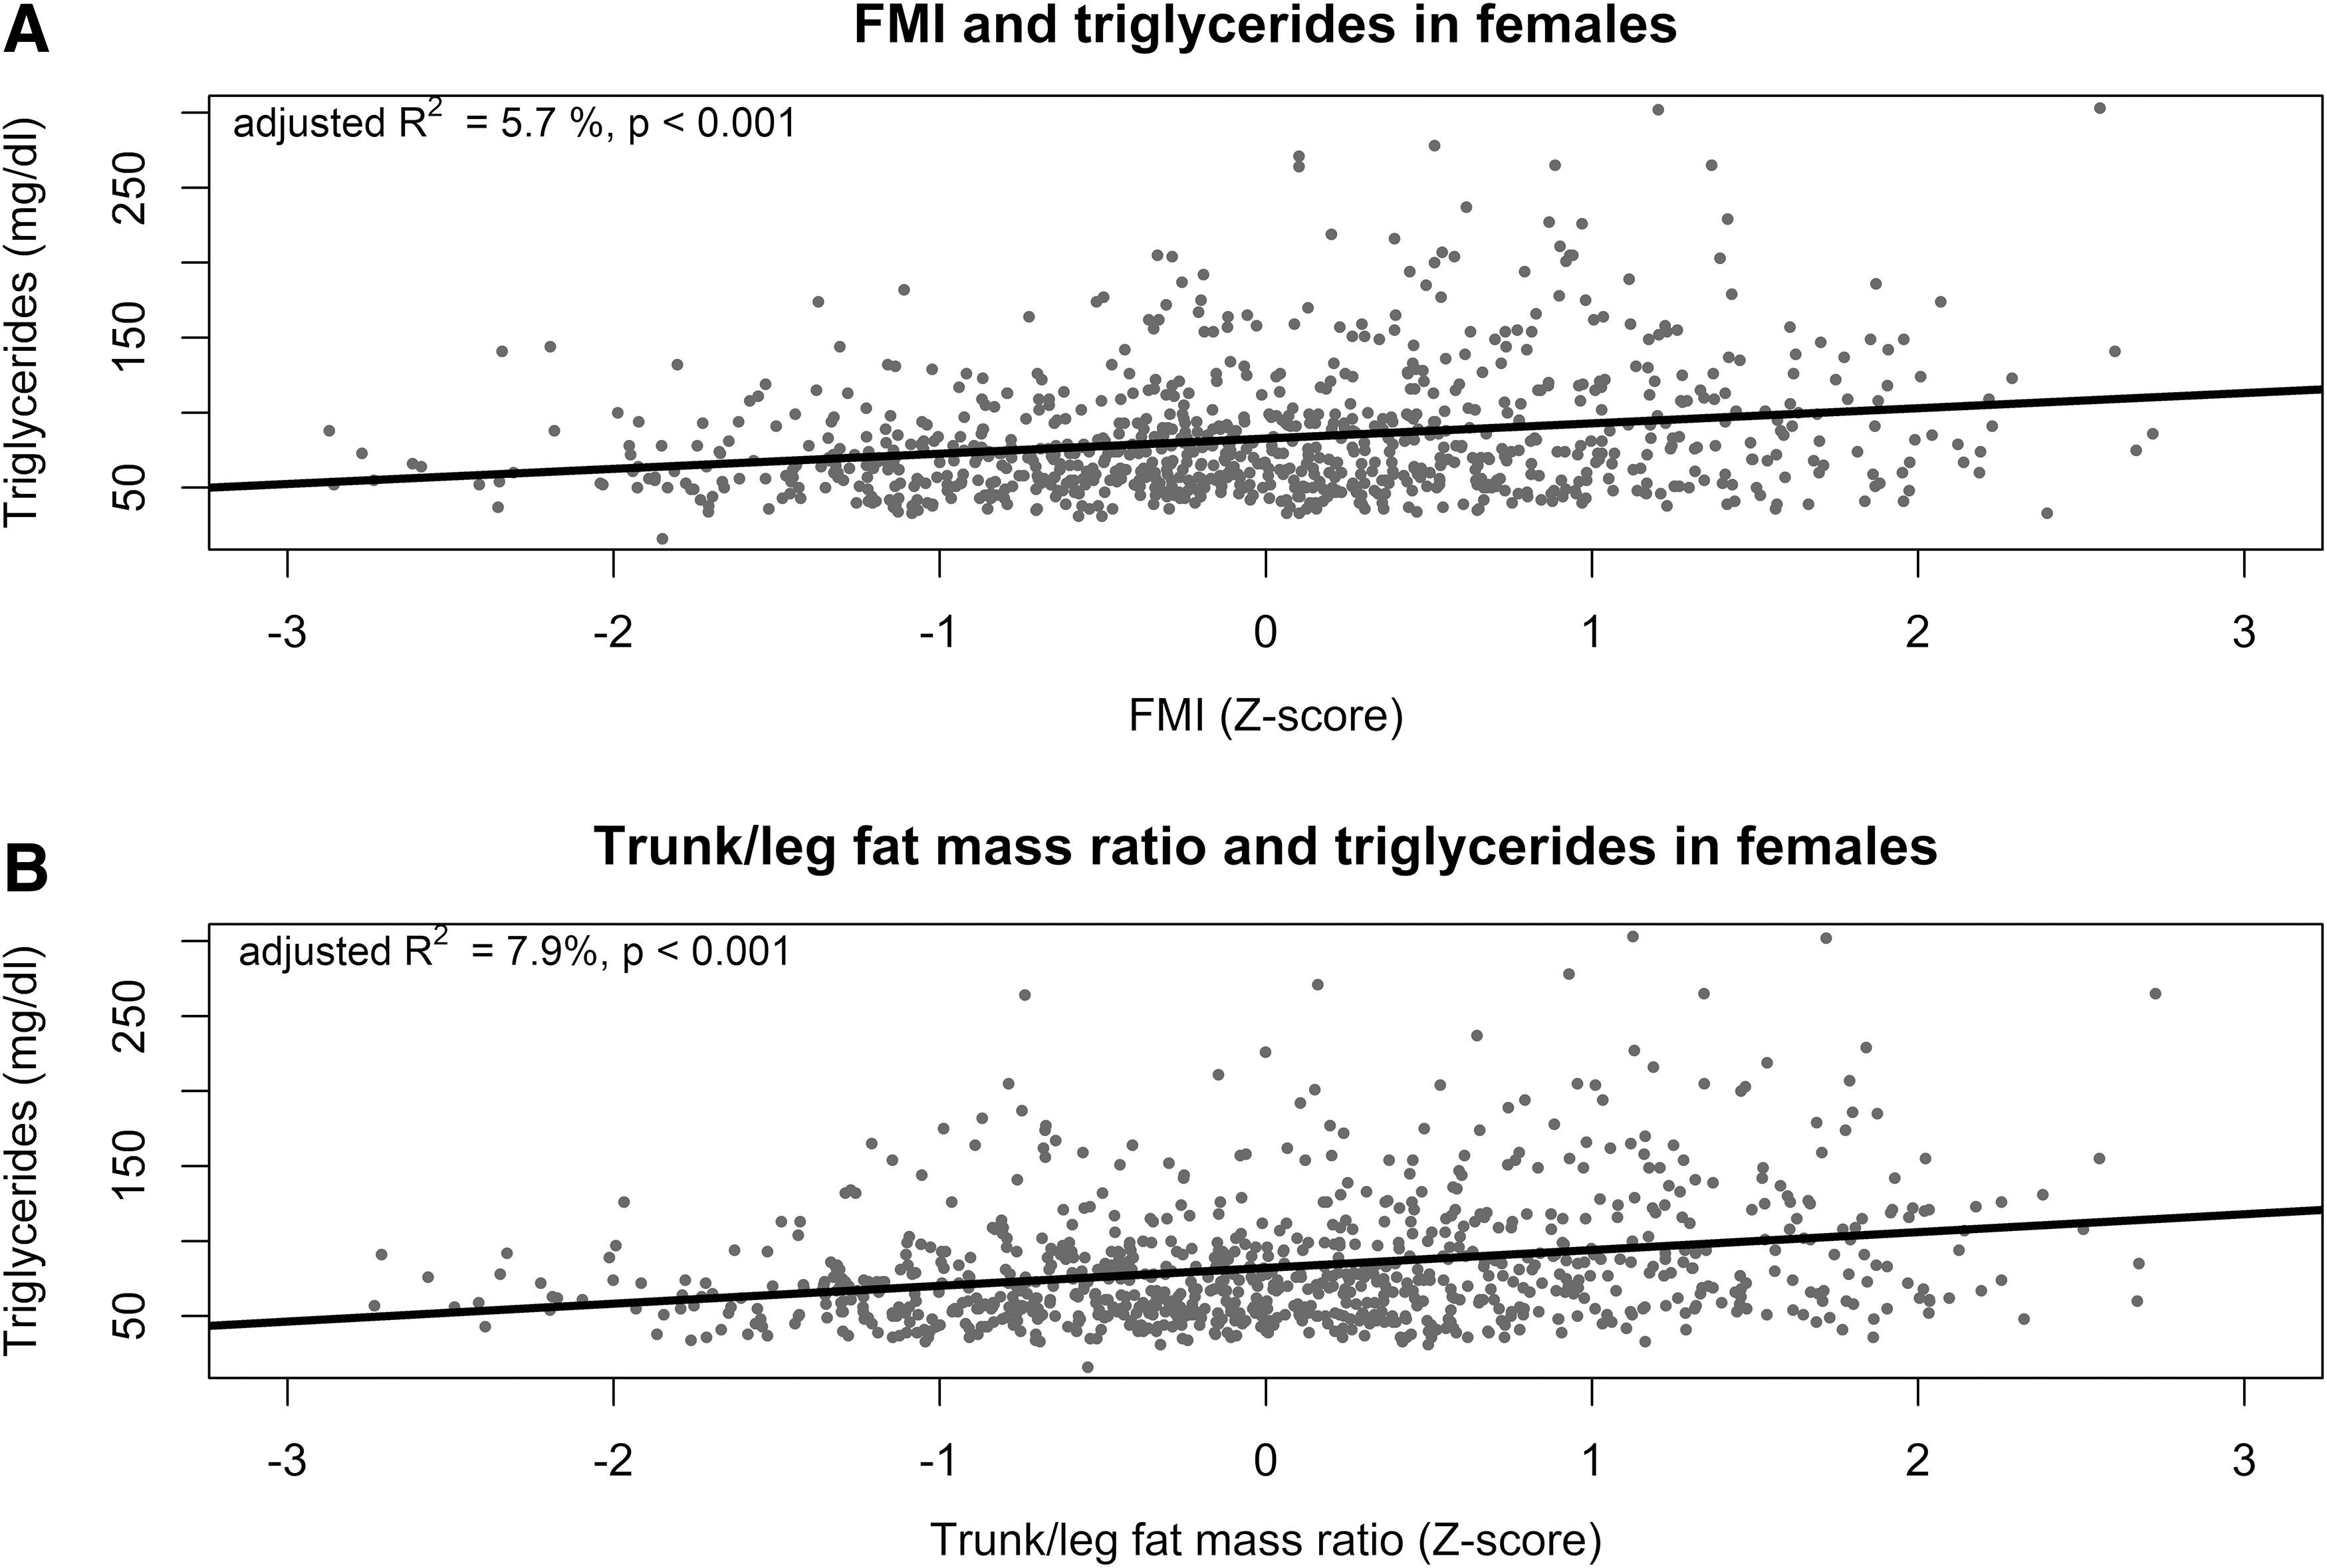
Body composition and TG concentration in females.

Body composition and TG concentration in male.
Bivariate Analysis of the Relationship of TG Concentration with Body Composition
Figures 8 and 9 depict the results of the bivariate logistic regression with FMI and T2L Z-scores as independent variables. The binary dependent variable was the presence of high TG concentration. In females and males, FMI and T2L Z-score were significant predictors for the presence of high TG concentration (Table 2).

Interaction of body composition and prevalence of high TG concentration in females.

Interaction of body composition and prevalence of high TG concentration in males.
Discussion
The study findings indicated that a central fat distribution, quantified using T2L, seemed to be an independent risk factor for high TG concentration in childhood and adolescence in both sexes, as well as for high LDL-cholesterol concentration only in girls. We further presented the first ethnicity-specific, pediatric reference centiles for T2L applicable for Hologic QDR-4500A fan-beam densitometer (Hologic, Inc.; Supplementary Tables S2–S7).
Ethnicity-Specific Reference Centiles for T2L
There were clinically relevant differences in the reference centiles for T2L between the evaluated three major ethnicities in the United States (Fig. 1). The median T2L was higher in Mexican American girls and boys than in non-Hispanic White or non-Hispanic Black individuals. The lowest T2L was found in individuals of the non-Hispanic Black population.
Comparable results have been reported recently by Cioffi et al., 11 who evaluated the T2L of adolescents aged from 12 to 19 years (NHANES population 2003–2006) and reported the same differences of the T2L between the three ethnicities. Similar results have also been reported by other authors.33,34
In addition, there was an increase of the T2L with increasing age from 8 to 20 years in both sexes (Fig. 1). In concordance, Cioffi et al. also reported that girls with menarche had higher T2L than girls without menarche. 11
Therefore, it is important to use ethnicity-specific and age-adjusted reference centiles when evaluating T2L to screen for individual cardiometabolic risk in children and adolescents.
LDL-Cholesterol Concentration
In females, increased central fat distribution, assessed by T2L, was strongly associated with high LDL-cholesterol concentration than the total fat mass, assessed by FMI (Figs. 2 and 4). An increase of 1 SD of the Z-score for T2L increased the prevalence of high LDL-cholesterol concentration by 1.69 (95% confidence interval [CI] 1.20–2.40; Table 2). Cioffi et al. also reported a significant correlation of trunk/fat mass ratio to high LDL-cholesterol concentration in girls 12–19 years old. 11
Interestingly, in boys of our study population, the T2L seemed not to be significantly associated with high LDL-cholesterol concentration when adjusted to FMI (Figs. 3 and 5; Table 2). On the contrary, FMI was positively associated with high LDL-cholesterol concentration. An increase of 1 SD of the Z-score for FMI increased the prevalence of high LDL-cholesterol concentration by 1.73 (95% CI 1.37–2.22; Table 2). Cioffi et al. have also reported that trunk/fat mass ratio in boys was not associated with high LDL-cholesterol concentration. 11 On the contrary, Cioffi et al. used BMI to assessed fat mass and adjusted the linear regression analysis in addition to household income status, total energy intake, and physical activity level.
Further, a stronger association of T2L with LDL-cholesterol concentration has been reported in adult females compared with males.10,35 The reason for the significantly differing association of T2L to LDL-cholesterol concentration between the sexes is unclear.
Contrasting our results, Lawlor et al. have reported a comparable association of central adiposity, assessed by waist circumference at age 9–12 years, with the presence of high LDL-cholesterol concentration at age 15–16 years in both sexes (n = 5235, 2747 girls). 36 The reported odds ratio (OR) per increase of 1 SD of the Z-score for waist circumference was 1.23–1.29 and thus, lower than our findings for the females in our study population (Table 2).
Kim and Park evaluated the association of central fat distribution assessed by visceral adipose tissue (by computed tomography) with LDL-cholesterol concentration in Korean adolescents (n = 175, 103 girls). 37 The reported adjusted R2 was 2.3% and, thus, comparable with our results (3.4%–3.8%; Figs. 2 and 3).
Although the biological mechanisms responsible for the association between T2L and cardiometabolic disease, for example, high LDL-cholesterol concentration, are not known, several hypotheses have been proposed. 38 A common point of all these hypotheses is that central fat tissue is probably metabolically more active than peripheral fatty tissue. The discussion of the possible biological mechanisms for this association10,38 was out of the scope of our study.
TG Concentration
In both sexes, the central fat distribution and FMI were approximately equally associated with high TG concentration (Figs. 6–9 and Table 2), even after adjusting for each other. An increase of 1 SD of the Z-score for T2L increased the prevalence of high TG concentration by 1.45 (95% CI 1.11–1.91) in females and by 1.81 (95% CI 1.52–2.19) in males (Table 2). The adjusted ORs for FMI were comparable to these results (Table 2).
Cioffi et al. also reported that T2L was significantly associated with high TG concentration and described comparable ORs. 11 In addition, they found a stronger association in males than in females.
Our results are also in accordance with the results of Lawlor et al. 36 They evaluated the association of central adiposity assessed by waist circumference at age 9–12 years with the presence of high TG concentration at age 15–16 years and calculated an OR of 1.36–1.42, depending on the included covariates, in girls and an OR of 1.96–1.97 in males, respectively. These ORs were comparable to our results (Table 2).
Kim and Park also evaluated the association of central fat distribution assessed by visceral adipose tissue (by computed tomography) with TG concentration in Korean adolescents. 37 The reported adjusted R2 was 6.4%, which was a little lower than the one reported in this article (7.9%–13.2%; Figs. 6 and 7).
Recently, Viitasalo et al. conducted a huge Mendelian randomization analysis to evaluate the relationship between central adiposity and cardiometabolic risk factors in children and adolescents. 39 They concluded that central adiposity may have a causal, unfavorable effect on plasma triglycerides and potentially other cardiometabolic risk factors starting in childhood.
Clinical Implications
The evaluation of fat distribution might have clinical utility in assessing the cardiometabolic risk in children. Our study results demonstrated, that, for instance, in a child with an age-adjusted Z-score for FMI of 0.0 (nonobese) the prevalence of high TG concentration may vary between <5% and >20% in dependence of the Z-score for T2L (−2.0 to +2.0; Figs. 8 and 9). In addition, Supplementary Figure S1 illustrated that such a discrepancy in the Z-scores for FMI and T2L could appear in a clinical setting and is not only a theoretical consideration. The dotted line in Supplementary Figure S1 demonstrated the observed range of the Z-scores for T2L in children with a Z-score for FMI of 0 (range approximately −2.0 to 2.0).
The fact that a central fat distribution was associated to high LDL-cholesterol and high TG concentrations, even if a child showed normal FMI values or had normal weight, may lead to the revelation of new therapeutic targets, such as remodeling the fat distribution pattern.
In children and adolescents, it was shown that aerobic exercise was effective in reducing central fat.40–43 In adults, a moderately low caloric but high protein diet reduced android fat mass during weight loss. 44 Future pediatric studies assessing fat distribution during therapeutic intervention (dietary and/or exercise) are needed to develop the best therapeutic program optimizing the cardiometabolic risk profiles of children and adolescents.
Here, we presented the first ethnicity-specific, pediatric reference centiles for T2L applicable for Hologic QDR-4500A fan-beam densitometer (Hologic, Inc.; Supplementary Tables S2–S7), to quantify the central fat mass in a clinical and research setting.
Limitation
Our study is limited by the lack of data of the diet of the participants of the NHANES study, although it is known that dietary pattern may significantly affect lipid concentrations. Further, the participants' age was only up to the eighth year of age. There is no statistic method for evaluating reference percentiles with multiple imputed data methods. In addition, the studied T2L considers all central tissue depots as metabolically similar, ignoring possible differences between the influence of subcutaneous and intra-abdominal adipose tissue on lipid concentrations.
Since the NHANES data were cross-sectional, it is not possible to evaluate the causality.
The presented analyses were adjusted for sex, ethnicity, and age, using ethnicity and sex-specific Z-scores. No further adjustments for other potential confounding variables, such as socioeconomic status, were performed.
The strengths of the study include the large study population and the evaluation of total fat mass with the compartment-specific parameter FMI, instead of using, for example, BMI. In addition, the first ethnicity-specific, pediatric reference centiles for T2L were presented.
Conclusion
A central fat distribution seemed to be an independent risk factor for high TG concentrations in children and for high LDL-cholesterol only in girls. We presented the first ethnicity-specific, pediatric reference centiles for T2L applicable for Hologic QDR-4500A fan-beam densitometer (Hologic, Inc.) to quantify central fat mass in a clinical and research setting. Evaluation of the fat distribution, in addition to the evaluation of the total fat mass, can have clinical utility in assessing cardiometabolic risk in children.
Data Sharing Statement
All data used to generate the reference centiles for appendicular lean mass index are available on the CDC-servers (https://wwwn.cdc.gov/Nchs/Nhanes/Dxa/Dxa.aspx). Data described in the article and analytic code will be made available on pending request.
Footnotes
Authors' Contributions
I.D. had substantial contributions to the conception of the work, the data acquisition, analysis, and interpretation of data for the work; drafting the work critically for important intellectual content; final approval of the version to be published; and agreeing to be accountable for all aspects of the work. The first author (I.D.) accepts responsibility for the integrity of the data analysis and is the corresponding author. K.M., K.R.E., E.A., M.J., and E.S. had substantial contributions to the design of the work and interpretation of data for the work; revising it critically for important intellectual content; final approval of the version to be published; and agreeing to be accountable for all aspects of the work.
Funding Information
No funding was received for this article.
Author Disclosure Statement
No competing financial interests exist.
References
Supplementary Material
Please find the following supplemental material available below.
For Open Access articles published under a Creative Commons License, all supplemental material carries the same license as the article it is associated with.
For non-Open Access articles published, all supplemental material carries a non-exclusive license, and permission requests for re-use of supplemental material or any part of supplemental material shall be sent directly to the copyright owner as specified in the copyright notice associated with the article.