
Abstract
Objective:
The beginning of postinfancy increase in BMI has been termed the adiposity rebound, and an early rebound increases the risk for obesity in adolescence and adulthood. We examined whether the relation of the age at BMI rebound (agerebound) to subsequent BMI is independent of childhood BMI.
Design:
From the electronic health records of 2.8 million children, we selected 17,077 children examined at least once each year between ages 2 and <8 years, and who were reexamined between age 10 and <16 years. The mean age at the last visit was 12 years (SD = 1). We identified agerebound for each child using lowess, a smoothing technique.
Results:
Children who had an agerebound <3 years were, on average, 6.8 kg/m2 heavier after age 10 years than were children with an agerebound >7 years. However, BMI after age 10 years was more strongly associated with BMI at the rebound (BMIrebound) than with agerebound (r = 0.63 vs. −0.49). Although the relation of agerebound to BMI at the last visit was mostly independent of the BMIrebound, adjustment for age-5 BMI reduced the association's magnitude by about 55%.
Conclusions:
Both agerebound and the BMIrebound are independently related to BMI and obesity after age 10 years. However, a child's BMIrebound and at ages 5 and 7 years accounts for more of the variability in BMI levels after age 10 years than does agerebound.
Introduction
BMI (kg/m2) is widely used as a surrogate for body fatness among children and adolescents. BMI levels increase rapidly during the first year of life, but then generally decrease to a minimum between 2 and 8 years of age before increasing throughout childhood and adolescence. The beginning of this second rise in BMI has been termed the “adiposity rebound” (referred to throughout as “BMI rebound”). Rolland-Cachera et al. were the first to report that the age at which this rebound occurs (agerebound) is inversely related to subsequent obesity.1,2 It was suggested that both the size and number of adipocytes might increase during this BMI rebound. 1
Subsequent studies have also confirmed that agerebound is inversely related to BMI levels and obesity in adolescence and adulthood.3–8 Agerebound is also adversely associated with DXA-calculated body fatness 9 and impaired glucose tolerance 10 among adults and with adverse levels of triglycerides and blood pressure among adolescents. 11 Various authors have considered BMI rebound to a critical period for developing obesity, a statistical effect, or a developmental marker.12–15
However, it is uncertain if agerebound provides additional information on adolescent or adult obesity beyond that conveyed by a single BMI measurement in childhood. Although the inverse association between agerebound and subsequent obesity is independent of the BMI at the rebound (BMIrebound), 5 Williams et al. 6 suggested that BMI at age 7 years could provide similar information that would be easier to obtain than agerebound. One of us (DSF) has previously shown that although agerebound among 105 participants in the Bogalusa Heart Study was inversely associated with BMI levels in early adulthood, this association was not independent of BMI at ages 7 or 8 years. 8
Our objectives are to examine this longitudinal relationship of agerebound to subsequent BMI among 17,077 children from a large electronic health record (EHR) database and determine if this association is independent of BMI at various ages throughout childhood. Each of these children had at least 1 BMI value each year between the ages of 2 and <8 years, along with a subsequent BMI value between ages 10 and <16 years. Throughout the article, we refer to the age at the BMI rebound as “agerebound” and the BMI value at the rebound as “BMIrebound.”
Subjects and Methods
Because this research is a secondary analysis of already existing observation data, it is exempt under CDC IRB policies.
Study Sample
IQVIA's Ambulatory electronic medical database (US) transformed into the Observational Medical Outcomes Partnership Common Data Model (version 5) contains deidentified medical records and encounters from 100,000 physicians and 800 networks from January 2006 through May 2019. These data include provider medical specialty, patient variables such as examination date, year of birth, gender, race, and ethnicity, and clinical variables such as diagnoses, procedures, medication prescription records, and patient and family history captured during a patient visit. Contributing practices comprise medium to large physician offices, outpatient clinics, and physician groups. Using the E360™ Software-as-a-Service Platform, 16 we identified 3.04 million 2- to 19-year olds with longitudinal data for weight and height (23 million records) whose last visit occurred at least one year after the initial visit, with the first visit occurring before age 14 years.
We identified weights and heights that are likely to be errors using the Daymont algorithm for the longitudinal detection of outliers.17,18 This method focuses on the difference between modified z-scores for weight and height 19 at each visit and the expected values based on an exponentially weighted moving average for each child. This algorithm also identifies several other categories of values likely to be errors. We have previously described 20 details concerning these likely errors and their treatment during data management. These records' exclusion reduced the number of weights and heights by 17% and the number of children by 6%, resulting in a data set of 2,843,859 children (17,991,318 records). Although these data are not representative, the prevalences of obesity and severe obesity are similar to those in the National Health and Nutrition Examination Survey (NHANES). 20
For the current analyses, we required that a child has one or more visits for each year of age between 2 and <8 years, along with an additional visit after age 10 years. For children who had two or more visits after age 10 years, we used the BMI at the last visit; the maximum age at the last visit in this sample was 15.9 years. Because the EHR data cover only 13 years (January 2006 through May 2019), this restricted the analyses to 17,077 children who were first examined before July 2011. On average, these children had 17 (SD = 11) visits between age 2 and <8 years.
Obesity is defined as a BMI ≥95th percentile of the CDC growth charts (or, equivalently, a z-score ≥1.645) for a child's sex and age. 21
Statistical Methods
Data management and analyses were performed inR. 22 Inspection of plots BMI for individual children indicated that most children had several values that were very close to the minimum BMI, possibly because most weights and heights were recorded to the nearest pound or inch. Furthermore, among many children, these low BMIs did not occur at consecutive visits, complicating the determination of BMIrebound. Most analyses, therefore, are based on using locally weighted regression smoother (lowess) 23 to estimate BMIrebound. We first smoothed the BMIs for each child and then defined BMIrebound as the minimum of these smoothed BMIs; agerebound was defined as the age at which the BMIrebound occurred. For 57 children whose minimum BMI was identical at several ages, we defined agerebound as the oldest age.
Because agerebound can be difficult to assess, we also performed sensitivity analyses in which agerebound was based on the (1) minimum observed BMI, (2) the minimum BMI after smoothing with Friedman's supersmoother, 24 or (3) the minimum of the median BMIs calculated for each year of age. Intercorrelations between values of agerebound determined by these various methods ranged from r = 0.75 to r = 0.85.
We first examined mean levels of various characteristics, at both agerebound and after age 10 years, across categories of agerebound. We used correlation coefficients and lowess to examine the relation of agerebound and BMIrebound to BMI values at the last visit.
To determine if the relation of agerebound to adolescent BMI and obesity was independent of childhood BMI levels, we constructed a series of regression models that predicted BMI at last visit. Predictor variables in these models included agerebound, along with sex, height-for-age z-score at agerebound, and age at last visit. Height-for-age was included because studies have found that, independently of a child's BMI, it is a predictor of subsequent obesity.25,26 These models also included BMIrebound or a child's BMI at ages 5 to <6, 6 to <7, or 7 to <8 years; for children with multiple BMIs in these age ranges, we used the mean value. To assess the information provided by BMI at the various ages and agerebound, we compared the (1) multiple R2s of these models and (2) predicted differences in BMI at the last visit between children who were at the 90th and 10th percentile of agerebound and BMI. Covariates in these models were set to their mode (sex) or median values, and we modeled continuous variables using natural splines 27 to allow for nonlinearity.
We constructed a nomogram using the rms package 28 in R to summarize the results of logistic regression predicting the probability of obesity at the last visit from the covariates, agerebound, and BMIrebound. This plot assigns points to each predictor's value, which can then be summed over all variables to derive the child's total number of points. This total can be converted to the predicted probability of obesity at the last visit. This visual aid has been used to predict prostate cancer recurrence 29 and survival after ovarian cancer recurrence. 30
Because of the large amount of missing data for race/ethnicity (8%), we did not include this characteristic as a covariate in the various regression models. We did, however, conduct sensitivity analyses that were stratified by race/ethnicity.
Results
All children were first examined between ages 2 and <3 years, and the mean age at the last visit was 12 years (SD = 1.3 years). The prevalence of obesity increased from 10% at age 2 years to 18% at age 7 years, and the prevalence at the last visit was 21%. Girls comprised 49% of the sample, and 75% of the children were white (75%), 8% were black, 4% were Hispanic, and 3% were Asian. The race/ethnicity of about 8% of the children was unknown or “other.”
Table 1 shows the relation of agerebound to various characteristics at both the time of the BMI rebound (top) and after age 10 years (bottom). As shown by the longitudinal correlations in the two final columns, BMI and BMIz at the final visit were more strongly associated with BMIrebound than with agerebound (r = 0.63 to 0.64 vs. −0.49 to −0.52).
Relation of Agerebound to Various Characteristics at the Time of the Rebound and to Values at the Final Visit among 17,077 Children
Agerebound is the age at which the BMI rebound occurs and BMIrebound is the BMI at this age.
Values are mean ± standard deviation.
Figure 1 summarizes the relations of agerebound (panel A) and BMIrebound (panel B) to BMI levels after age 10 years. The lines in each panel represent smoothed BMI levels at the last visit within the 3 age groups. The relation of both agerebound and BMIrebound to BMI after age 10 years is evident in all groups. Although the results varied somewhat by sex and final age, a child whose agerebound occurred before age 2 years was about 7 kg/m2 heavier after age 10 years than was a child whose agerebound occurred at 7 years. The range of BMI values at the last visit associated with BMIrebound (panel B) was larger, with predicted BMIs varying from 15 to 35 kg/m2 across values of BMIrebound.
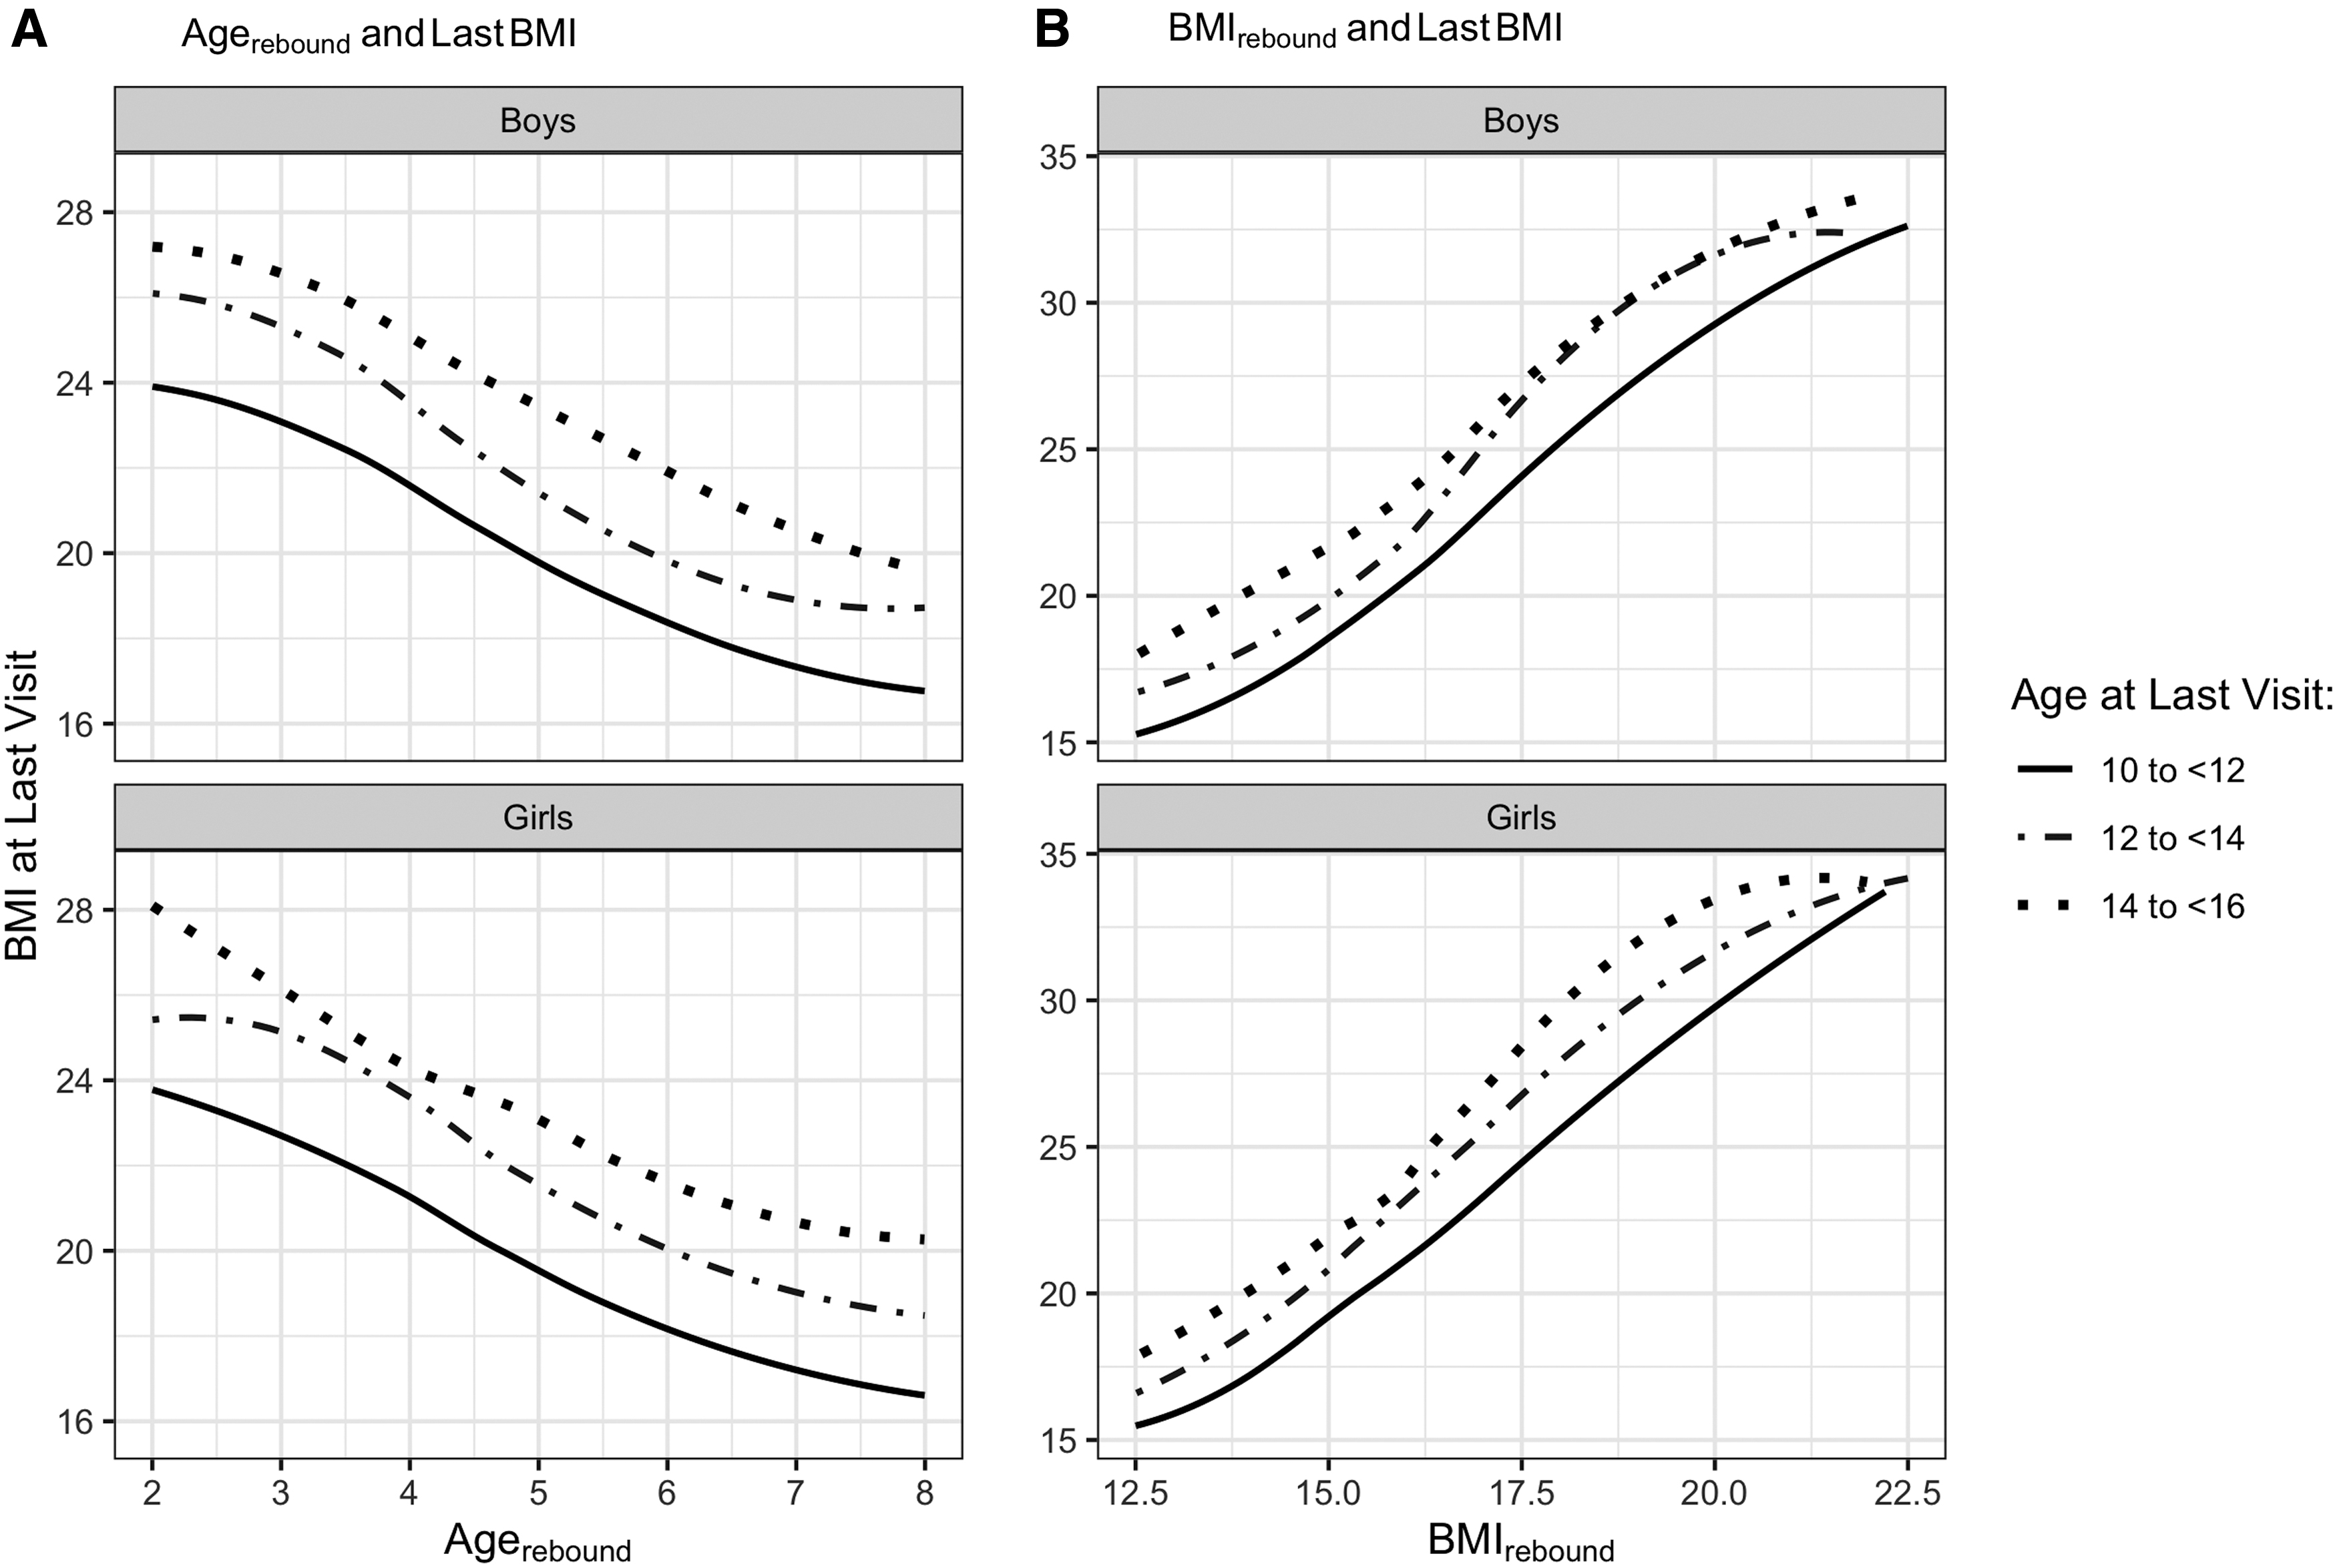
Relation of agerebound
Figure 2 represents a nomogram, based on logistic regression, for predicting obesity at the last visit from a child's sex, agerebound, and BMIrebound. To calculate the probability of obesity at the last visit for a child, the points (top row) for each predictor would first be calculated. These points are then summed and converted to a probability (bottom row). For example, a boy (5 points) with an agerebound of 4 years (31 points) and a BMIrebound of 18 (62 points) would have a total of 98 points and a probability of obesity after age 10 years of about 0.75. In contrast, a girl (0 points) with an agerebound of 2.5 years (37) and a BMIrebound of 15 (35) would have 72 points and a predicted probability of obesity of about 0.20.
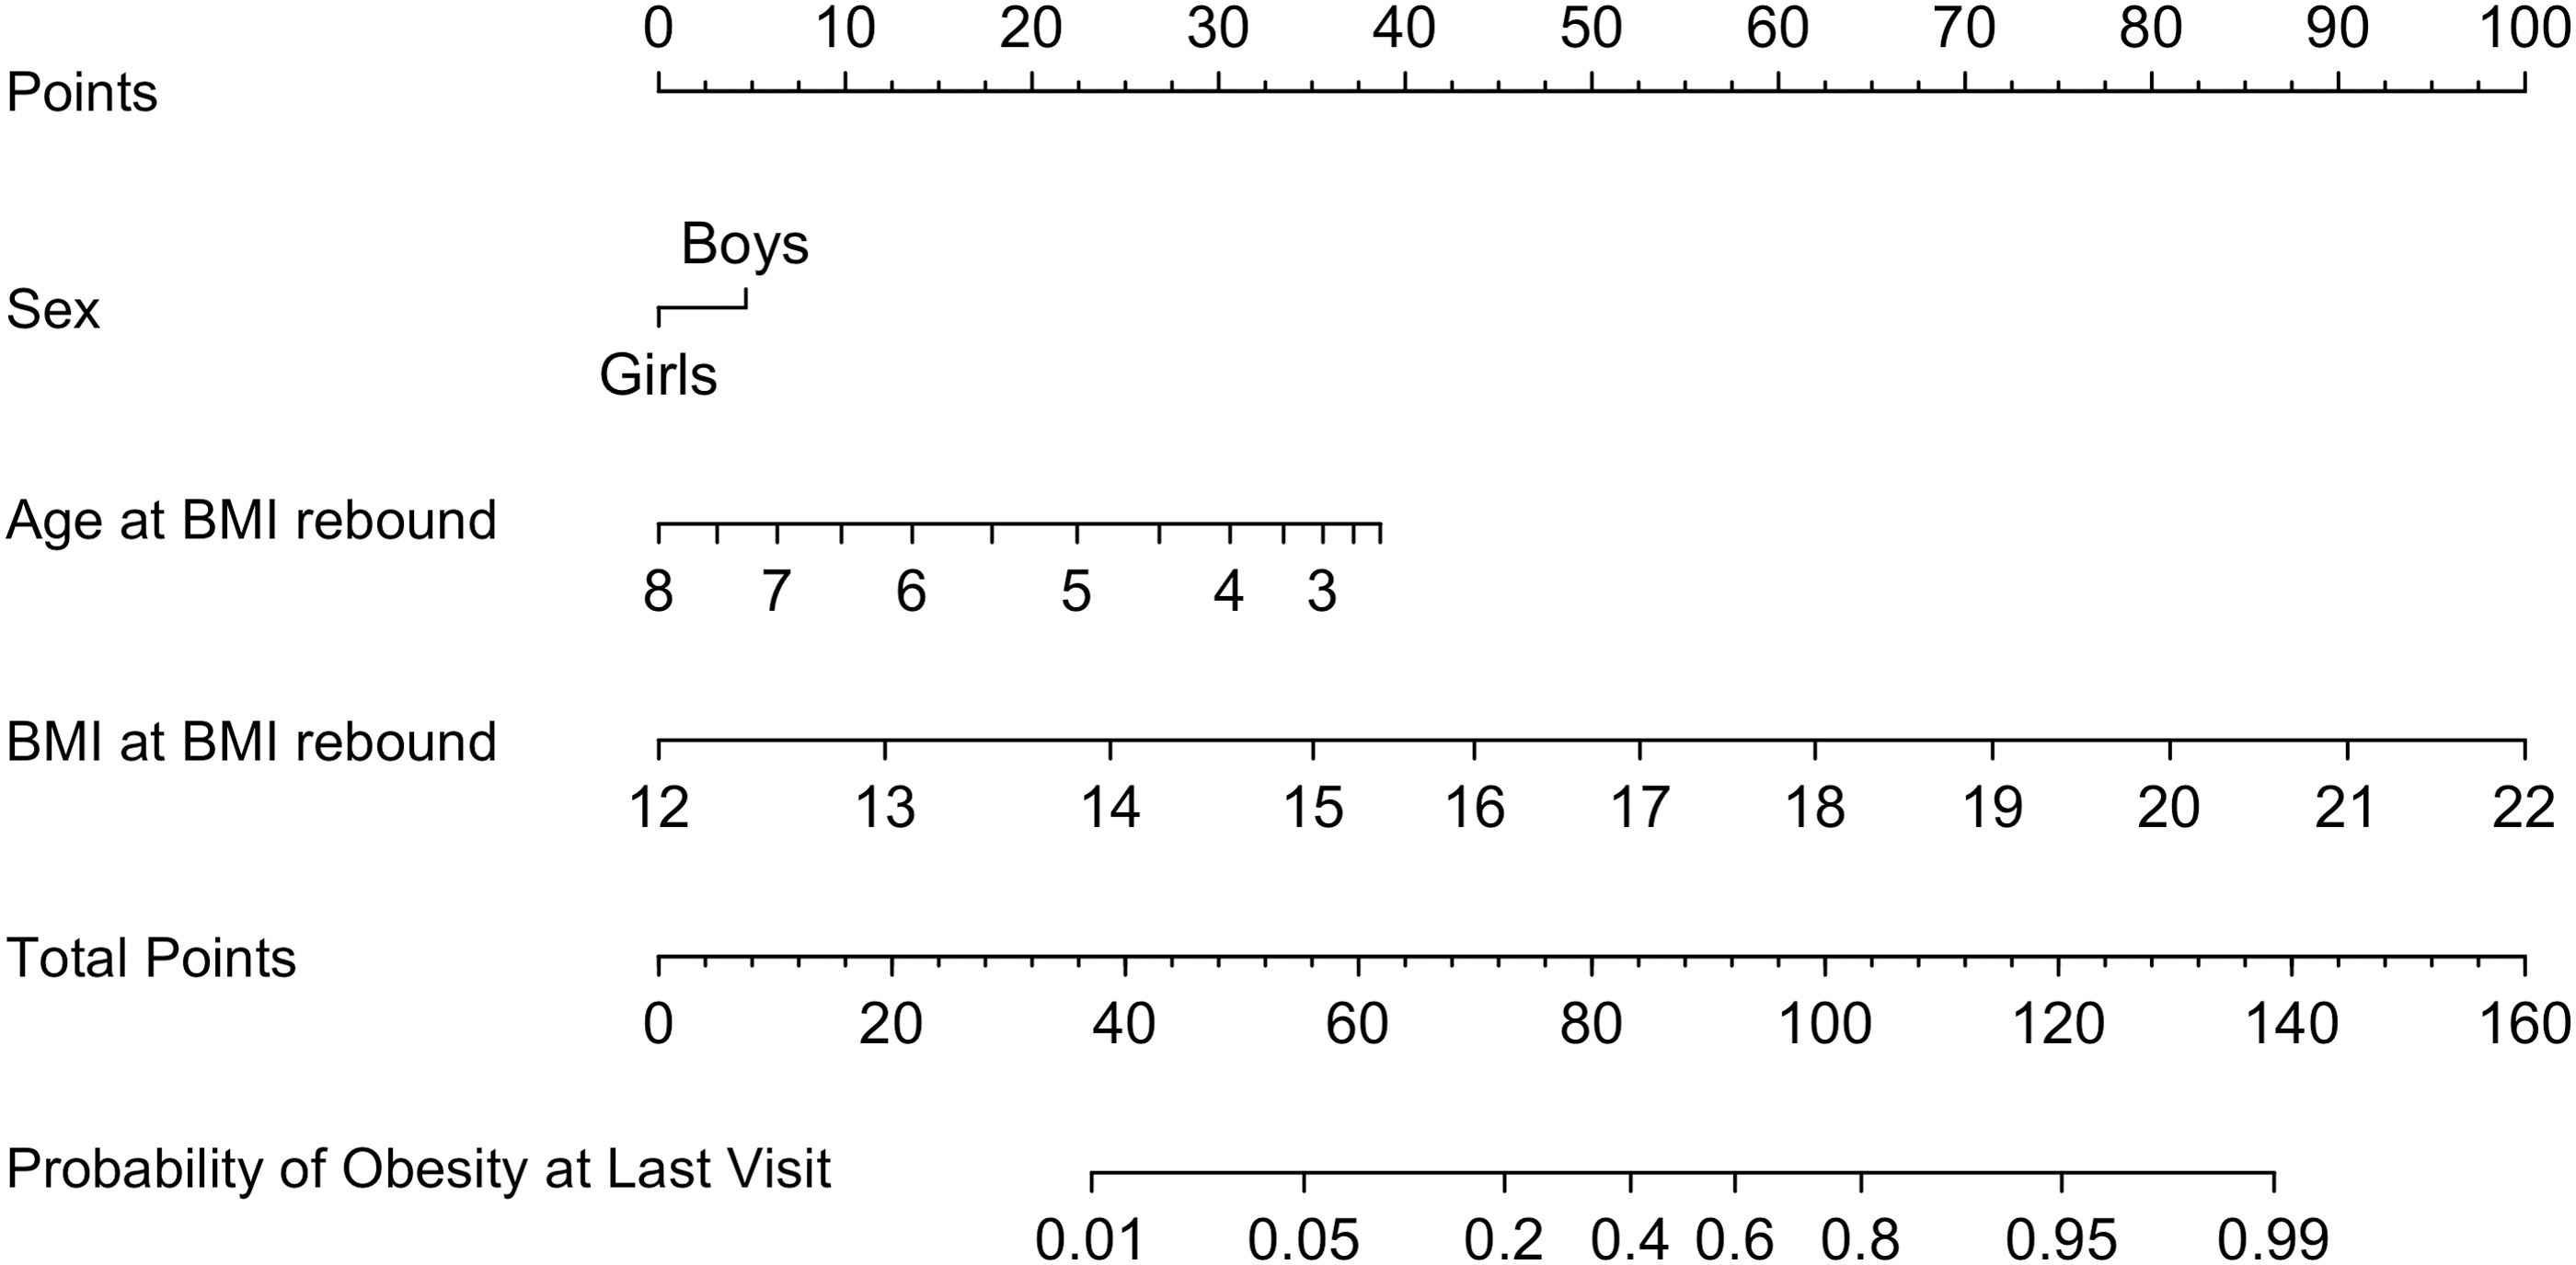
Nomogram showing the predicted probability of obesity at the last visit (bottom row) based on various combinations of sex, agerebound, and BMIrebound. For each predictor variable, the number of points (top line) would be calculated. These values would then be summed to derive a child's total points and probability of obesity (final two rows).
We further examined whether the relation of agerebound to subsequent BMI levels was independent of a child's BMI at various ages. A regression model that included the covariates (sex, age at last visit, and height z-score at agerebound) and agerebound accounted for 31% of the variability in BMI at a child's last visit, and Table 2 shows the results of various models that controlled for BMI at different ages. A model that included the covariates and BMIrebound (alone) accounted for 45% of the variability in BMI at the last visit (top left), while the R2 for a model that included both BMIrebound and agerebound was 0.55. However, agerebound provided less information if the BMI level at age 5 years (R 2 s of 0.59 and 0.64) was known and almost no information if the BMI at age 7 years was known.
Summary Statistics for Various Linear Regression Models Predicting Final BMI from Covariates, Agerebound, and BMI Value at Various Ages
All models include sex, childhood height-for-age z-score, and last age as covariates. The R2 of a model with these three covariates alone was 0.09, while the R2 of a model with the covariates and reboundage was 0.31.
Independent effects of each variable, summarizing the difference in BMI at last visit between children at the 90th and 10th percentiles of the predictor. For agerebound, a child with an agerebound of 7.6 years (90th percentile) would have a predicted BMI at the last visit that was 6.9 kg/m2 lower than a child with an agerebound of 2.3 years (10th percentile). The 10th and 90th percentiles of minimum BMI were 13.9 and 17.5 kg/m2. Covariates were set to their mode (sex) or median value.
The values in the right half of Table 2 show the predicted differences in BMI at the last visit between children who were at the 10th or 90th percentile of agerebound and BMIrebound. For agerebound, a child who had an agerebound of 2.3 years (10th percentile) had, on average, a 6.9 kg/m2 higher BMI at the last visit than did a child with an agerebound of 7.6 years (90th percentile). This difference was comparable with the BMI difference (+7.2) at the final visit between children at the 90th (17.5 kg/m2) and 10th (13.9 kg/m2) percentiles of BMIrebound. However, information on BMIs at age 5 years or after substantially reduced the effect of agerebound. Information on BMI at age 7 years reduced the effect of agerebound by 90% (1 − 0.7 ÷ 6.9).
Discussion
Based on 17,077 children, our results show that age at the BMI rebound (agerebound) is predictive of BMI levels after age 10 years. For example, children with an early agerebound (<3 years) had a mean BMI after age 10 years that was about 7 kg/m2 higher than the BMI among children whose agerebound occurred after age 7 years. However, the BMIrebound was at least as important as agerebound in predicting BMI levels and obesity after age 10 years. Furthermore, agerebound provided almost no information on BMI after age 10 years if age-7 BMI was known.
Williams et al. 6 suggested that although the BMI rebound may be of scientific interest, it could be easier to use age-7 BMI to predict adult BMI. Despite the large number of studies that have examined agerebound, only one previous study has assessed whether a child's BMI at various ages can provide comparable information. 8 This small (N = 105) study found that children with an agerebound ≤5 years were 4 to 5 kg/m2 heavier in early adulthood than were children with an agerebound ≥7 years. Agerebound, however, provided no information on adult BMI if a child's BMI at age 7 or 8 years was known.
Several investigators have found that the relation of agerebound to subsequent BMI is mostly independent of BMIrebound,3,5 and this agrees with our findings. However, we found that the BMIrebound was a more accurate predictor of obesity at the last visit than was agerebound (R 2 s of 0.45 vs. 0.31). Furthermore, because the estimation of agerebound requires at least 3 BMI values throughout childhood, it is uncertain why childhood BMI at other ages has not been considered in many of the previous analyses of BMI rebound. For example, we found that information on age-5 BMI reduced the effects of agerebound by about 55% (Table 2).
Agerebound was originally defined as the age corresponding to the lowest BMI before the increase in adiposity, 1 but for many children, it may be difficult to determine agerebound. Rather than showing a U-shaped pattern between ages 2 and 7 years, BMI levels among children in the current study usually showed a plateau or had several nonadjacent BMIs that were close to the minimum. To address these issues, some investigators 31 have required that all BMIs after the nadir show increases of more than 0.1 kg/m2, while others have used more complicated regression models to determine agerebound.3,6,32 We used lowess to determine agerebound but obtained very similar results with other techniques, such as the (unsmoothed) minimum BMI or selecting the year of age with the lowest median BMI.
Despite the large sample size of the current study based on EHR data, there are several limitations to this type of secondary analysis. EHR information is not always collected in a standardized way within or across practices, and the view of a patient captured in an EHR is typically representative of a patient's medical history only at a single practice and is not a comprehensive record of all medical visits. Also, the data in the current study are limited to encounters occurring in specific ambulatory settings. There were also many errors in the recorded weights and heights. Although we used the Daymont algorithm 18 to identify and exclude these probable errors, we likely failed to exclude all errors and likely excluded some valid values.
Because of privacy concerns, we had information on each child's visit date and year of birth, but not the child's age. Therefore, we calculated age from the visit date and the midpoint of the year of birth, resulting in errors in calculating a child's age, agerebound, and BMIrebound. Furthermore, almost 10% of the children were missing information on race/ethnicity. We did not include this variable in the analyses because of the lack of information that could be used for imputation. Black and Hispanic children had higher BMI levels than did white children, but sensitivity analyses indicated that the relations of both agerebound and BMIrebound to BMI levels at the last visit were similar within race/ethnicity categories.
Despite these limitations, we have previously shown 20 that the tracking of BMI levels in these data is similar to that observed in the Bogalusa Heart Study and that the prevalences of obesity and severe obesity among children in these data correspond well with estimates from comparable years in NHANES. Furthermore, the magnitude of the unadjusted relation of agerebound to BMI after age 10 years that we observed is comparable with that reported by others.
Conclusions
The age of the adiposity rebound is related to subsequent BMI and obesity, and an early rebound could help identify children who could benefit from intervention. However, we found that BMIrebound provides more information on subsequent BMI and obesity than does agerebound. Furthermore, knowledge of the BMI at age 5 years reduced the magnitude of the association between agerebound and BMI at last visit by 55%. As suggested by Williams et al., 6 it may be more practical to identify subsequent obesity by assessing a child's BMI at various ages rather than identifying agerebound.
Footnotes
Acknowledgments
The authors thank Robert Grundmeier for his work on the growth cleaning algorithm17,18 and his continued support on this project. All authors approved the article as submitted and agreed to be accountable for all aspects of the work. The findings and conclusions in this report are those of the authors and do not represent the official position of the Centers for Disease Control and Prevention.
Funding Information
No funding was received for this article.
Author Disclosure Statement
No competing financial interests exist.