




Abstract
Background:
An early trend in the mean age of pubertal onset appears in adolescents, but the association between body fat percentage (BF%) of children and precocious puberty is unclear. The aim of the study was to analyze the association of sexual development with BF% in girls.
Methods:
A total of 407 females were included in this cross-sectional study. BF% was measured by Inbody S10, International Obesity Task Force was used to judge overweight or obesity, and early puberty was defined as a younger age than the median age in each of the pubertal Tanner stages. Logistic regression analysis was used to test relationships between pubertal states and independent variables, including age, weight, waist circumference (WC), type of school, and residency.
Results:
Females with early puberty exhibited higher anthropometry data (such as weight, BMI, BF%) than females with normal maturation (p < 0.001). Weight, BMI, WC, BF% residency, and school type were related to pubertal state (p < 0.001). Females with higher BF% were more likely to exhibit early puberty (odds ratio = 1.138, 95% confidence interval = 1.046–1.237). The students who lived in urban areas and studied in public schools had a lower risk of early puberty. Moreover, BF% continuously increased with age in 6- to 9-year-old girls.
Conclusions:
Females with higher BF% may be more likely to exhibit early puberty. In future studies, more research is needed to analyze this mechanism of how BF% influences puberty development.
Introduction
Puberty is a crucial period of physical and mental development,1,2 with the beginning of puberty being of particular importance. Research has shown a downward trend in the mean age of pubertal onset since 1979 in Chinese adolescents. 3 Pubertal onset is affected by many factors, such as nutrition, socioeconomic status, and genetic factors, whereas the most common factor is nutrition. 4 However, the mechanism of how these factors influence the onset of puberty remains to be elucidated. 5
With sex differences noted between precocious puberty and obesity, the influence of obesity in precocious puberty is unclear. In males, results have been mixed, with some studies showing a positive association between BMI and precocious puberty,6,7 some studies reporting a negative association, 8 and others finding no relationship between obesity and puberty onset.1,9 However, research in females suggests that obesity is more likely to lead to precocious puberty,6,8,10 possibly due to factors such as endocrine dysfunction and neural mechanisms.
Puberty is triggered by an increase in the secretion of the neuropeptide gonadotropin-releasing hormone (GnRH), 11 which is controlled by the hypothalamic–pituitary–gonadal (HPG) axis. GnRH can stimulate the secretion of luteinizing hormone (LH) and follicle-stimulating hormone (FSH), which are necessary for gonadal activation. 12 Obesity may affect puberty by influencing the HPG axis. Some study found that estradiol (E2) can be converted from adrenal androgens via aromatase, which was secreted by peripheral adipose tissue. 8 If the hypothesis is true, there may be a positive correlation between body fat percentage (BF%) and basal sexual hormones in girls who have.
In clinical practice, sometime BF% is not convenient to measure, but previous studies found that there is a positive correlation between waist circumference (WC), waist-to-height ratio (WHtR), BMI, and BF%. 13 WC measurement is a simple anthropometric method, and WC is a good predictor of intra-abdominal fat and cardiovascular risk factor.14,15 The different waist parameters and their combination with BMI are helpful in assessing the distribution of body fat and assessing cardiovascular risk factors, especially during pubertal development.
The BMI is commonly used to judge obesity in children, which is calculated by using total body mass; it contains two factors, adipose tissue and lean mass, 16 but it is impossible to distinguish adipose and lean body tissues, 17 which may lead to faulty data and negatively affect growth and development. However, measuring BF% can distinguish adipose and lean body tissues. So, some researchers have proposed BF% as a more accurate metric in determining obesity in children and adolescents. However, as we all know, the cutoff of BF% is different across age, sex, ethnic groups, and even the measurement methods, and there is no consensus of BF% to judge overweight and obesity in children and adolescents,17,18 limiting the clinical application of BF%.
Therefore, the current study was conducted to analyze the association between obesity and pubertal development; assess the correlation between BF% and sexual hormones (i.e., E2, FSH, and LH), the correlation between BF%, BMI, and WC; and estimate the tendency of percentile curves of BF% in females aged 6–9 years for our subject.
Methods
Our study was a cross-sectional study conducted in Zhongshan, Guangdong Province, China. It was a part of the baseline survey of a multicenter prospective cohort study sponsored by Shanghai Children's Medical Center affiliated to the Shanghai Jiao Tong University School of Medicine.
Study Design and Ethics Approval
This study was approved by the Institutional Review Boards of Shanghai Children's Medical Center (SCMCIRB-K2019007), and Zhongshan Bo Ai Hospital.
Stratified, clustered, random sampling was conducted in 6- to 9-year-old students in Zhongshan, Guangdong Province, from 15 October to 10 December 2019. The method of sampling is shown in Figure 1.

Participant selection flowchart.
Teachers distributed the informed consent forms and the questionnaire to students, which were audited by the head teacher of schools. Parents and students who agreed to participate in the study signed the informed consent form and filled in the questionnaire, and they then returned it to researchers. The present study was registered in the Protocol Registration and Results System (ClinicalTrials.gov, NCT04113070), and the article was written in accordance with the requirements of cross-sectional design (Supplementary Data (STROBE Checklist)).
Subjects
To determine the list of subjects before the physical examination, BMI of participants in grades two and three was calculated based on data from 2018 medical examinations, whereas BMI of participants in grade one was calculated based on height and weight reported by parents in the questionnaire. For participants whose parents provided consent, International Obesity Task Force (IOTF) standards were used to judge overweight or obesity based on BMI for age and sex.19,20 Then, normal-weight girls were matched by age with overweight and obese children one by one. Measurement of height and weight and body composition was conducted for all the participants we chose.
The exclusion criteria were as follows: (1) all males; (2) females with a history of using hormonal drugs; (3) females with chronic diseases that may affect puberty or physical development; and (4) females who lacked necessary data. So at last, we only included girls in our study.
Since our study is part of a baseline survey of a multicenter prospective cohort study, therefore, we did not separately calculate the sample size for our research. However, before we began analysis, we calculated the required sample size, which is 368.
Sociodemographic Characteristics
We used self-designed questionnaires to collect basic characteristics of participants, including name, sex, birthdate, weight, height, ethnicity, residency, and school. Residencies were divided into urban and suburban areas, whereas the school was classified into public and private schools.
Body Composition and Anthropometric Measurements
Standing height was measured to the nearest 0.1 cm by using a stadiometer, whereas weight was measured by a balance scale to the nearest 0.1 kg, with light clothes and no shoes. BMI was calculated by dividing weight (kilograms) by the square of height (meters). The IOTF standards were utilized to classify nutritional status19,20 adjusted for age and sex. WC was measured at the mid-point between the lowest rib and the top of the iliac crest to the nearest 0.1 cm. Waist-height-ratio (WHtR) was calculated by dividing WC (centimeters) by height (centimeters). BF% was measured by Inbody S10 (Biospace Co., Ltd., China), which was measured by bioelectrical impedance analysis (BIA). The human BF% is the total fat mass divided by total body mass, multiplied by 100. The BIA measured impedance of the body to a small electric current, and it then used an empirical derivation of regression equations to measure total body water21,22 and fat-free mass. The BIA methodology's accuracy has been supported by research in the previous study and it has been validated in assessing body composition in children.23,24 Compared with other BF% measurements, BIA is the most suitable method for large-scale investigations. 25
Blood Sample Collection
To reduce the influence of exogenous hormones in food26,27 and increase the comparability of our study, we collected three milliliters of venous blood samples in the morning before breakfast rather than random samples, and these were transferred from schools to the laboratory of the local hospital. Whole blood was centrifuged to collect serum, which was used to measure basal concentrations of sexual hormones, including E2, FSH, and LH, via chemiluminescence immunometric assay (Beckman DX1800) in the same laboratory.
Pubertal State Evaluation
Sexual maturation examination was performed by trained pediatric physicians based on the Tanner stages reported by Marshall and Tanner. 28 Participants were assigned to categorize based on maturity indicators for breast development. The Tanner stage was judged based on inspection and palpation. For overweight/obese females, breast Tanner stage was judged by ultrasound. Puberty onset is marked by Tanner stage II.
Precocious puberty is defined for girls as the onset of breast or pubic hair development reaching stage II and above before 8 years old or menarche before 10 years old. 29 However, considering that some females were older than 8 years in our study, exceeding the age that can diagnose precocious puberty, we introduced the concept of early puberty. However, as there is no standard definition of early puberty, we used the definition most used in other studies, to increase comparability of our results.30,31 The definition of early puberty was younger than the median age in each of the pubertal Tanner stages (II, III, IV, and V). 32 The reference was produced by a population-based multicenter study in China; therefore, it has a certain representativeness for Chinese children. And the others are considered to be normal maturity.
Statistical Analysis
Quantitative variables are reported as median with 25th and 75th percentiles and were compared by using Mann–Whitney U test or t test. Categorical variables are reported as absolute numbers and frequencies (%). Statistical differences were assessed by Pearson's chi-square or Fisher's exact tests.
Logistic regression was used to test associations between independent variables and pubertal states. Before the logistic regression analysis, we analyzed the correlation of various anthropometric indexes to screen indexes that could be included. After the univariate analysis and collinear diagnostics, we found that most of those indexes were correlated, so we only included the representing variables into logistic regression. Odds ratios (ORs) and 95% confidence intervals (CIs) were obtained via logistic regression. Spearman correlation was used to analyze the correlations between BMI, BF%, and sexual hormones (E2, FSH, LH), and the correlations between WC, WHtR, weight, BMI, and BF%. Cole and Green's Lambda-Mu-Sigma (LMS) method was used to generate age-specific percentile curves. 20 All analyses were carried out by using SPSS 25.0 (IBM Corp. Armonk, NY) and R 3.6.3 (The R Foundation for Statistical Computing, Vienna, Austria). Statistical significance was established as a two-sided p-value <0.05.
Results
Baseline Characteristics of Participants
Baseline characteristics of the participants are shown in Table 1. Median BMI and BF% were 15.87 kg/m2 and 18.40%, respectively. Of 407 participants, 282 (69.3%) exhibited normal maturation, whereas 135 (30.7%) demonstrated early puberty. The median value of age, height, weight, BMI, WC, WHtR, and BF% was found to be significantly higher in early pubertal females (p < 0.001). However, no differences were noted in the concentrations of sexual hormones (i.e., E2, FSH, and LH) between the two groups (p = 0.130, p = 0.937, and p = 0.563, respectively).
Characteristics of Participants
p < 0.05 was marked in bold.
Fisher's exact test used.
BF%, body fat percentage; E2, estradiol; FSH, follicle-stimulating hormone; LH, luteinizing hormone; WC, waist circumference; WHtR, waist-height-ratio.
Among the females with normal maturation, the percentages of females with grade 3, grade 2, and grade 1 thinness, normal weight, overweight, and obesity were 0.70%, 4.30%, 15.60%, 69.90%, 7.40%, and 2.10%, respectively. In the early pubertal group, they were found to be 0%, 0%, 1.60%, 20.80%, 48.80%, and 28.80%, respectively. Significant differences in weight distribution existed between the two groups (p < 0.001). In the normal maturation group, individuals with normal weight accounted for the highest percentage (69.90%). However, in the early pubertal group, overweight subjects were the most (48.80%). In addition, females who lived in suburban areas and studied in private schools were more likely to exhibit early puberty (p < 0.001).
The Relationship between BF% and Puberty Development
Significant differences were noted in age, weight, height, BMI, WC, WHtR, BF%, living districts, and school type between the two groups. In the correlation analysis, there were strong correlations between those variables (Supplementary Table S1). So before the logistic regression analysis, we did univariate analysis and collinear diagnostics (results not shown), and we only included age, weight, WC, living district, and school type into the logistic regression model as independent variables. The results are shown in Table 2. Model 1 adjusting age and BF% showed that higher BF% was significantly related to a higher risk of early puberty (OR = 1.316, 95% CI = 1.242–1.395). In addition, model 2 adjusting anthropometry data (weight, WC) was based on model 1 (OR = 1.148, 95% CI = 1.061–1.243), and model 3 adjusting sociodemographic characteristics was based on model 2 (OR = 1.152, 95% CI = 1.062–1.250). Based on logistic regression analysis, we found that BF% was a risk factor of early puberty, even after adjustment for other factors.
Association of Body Fat Percentage and Pubertal States by Binary Logistic Regression
p < 0.05 was marked in bold.
Normal maturation as the reference.
Model 1—adjust BF%, age.
Model 2—adjust BF%, age, WC, WHtR.
Model 3—adjust BF%, age, WC, WHtR, type of school, residency.
CI, confidence interval; OR, odd ratio.
In model 3, we also found that the risk of early puberty was increased with weight. In addition, students who lived in urban areas and studied in public schools had a lower risk of precocious puberty (OR = 0.461, 95% CI = 0.210–0.767; OR = 0.401, 95% CI = 0.247–0.861). Relationships were not found between pubertal states and WC (OR = 1.025, 95% CI = 0.943–1.114), or between pubertal states and age (OR = 0.797, 95% CI = 0.527–1.206).
Relationships between Various Anthropometric Indexes, Sex Hormones, and BF%
As illustrated in Table 3, a positive correlation was found between weight, BMI, WC, and BF% (r = 0.686, 0.875, 0.753). However, the correlations between BMI and sex hormones (E2, FSH, LH) as well as between BF% and sex hormones were not significant (p > 0.005).
Relationships between Various Anthropometric Indexes, Sex Hormones, and Body Fat Percentage as Assessed by Spearman Correlation
p < 0.05 was marked in bold.
β, regression coefficient; r, Spearman's correlation coefficient.
Percentile Curves of BF% Estimated by the LMS Method
Of all the participants, 117 (28.75%) were aged 6 years, 130 (31.94%) aged 7 years, 134 (32.9%) aged 8 years, and 26 (6.39%) aged 9 years. The smoothed estimates for the 5th, 10th, 15th, 20th, 25th, 50th, 75th, 80th, 85th, 90th, and 95th percentiles of BF% for females in each age group are presented as values (Supplementary Table S2) and percentile curves (Fig. 2). We found that BF% continually increased with age in 6- to 9-year-old girls.
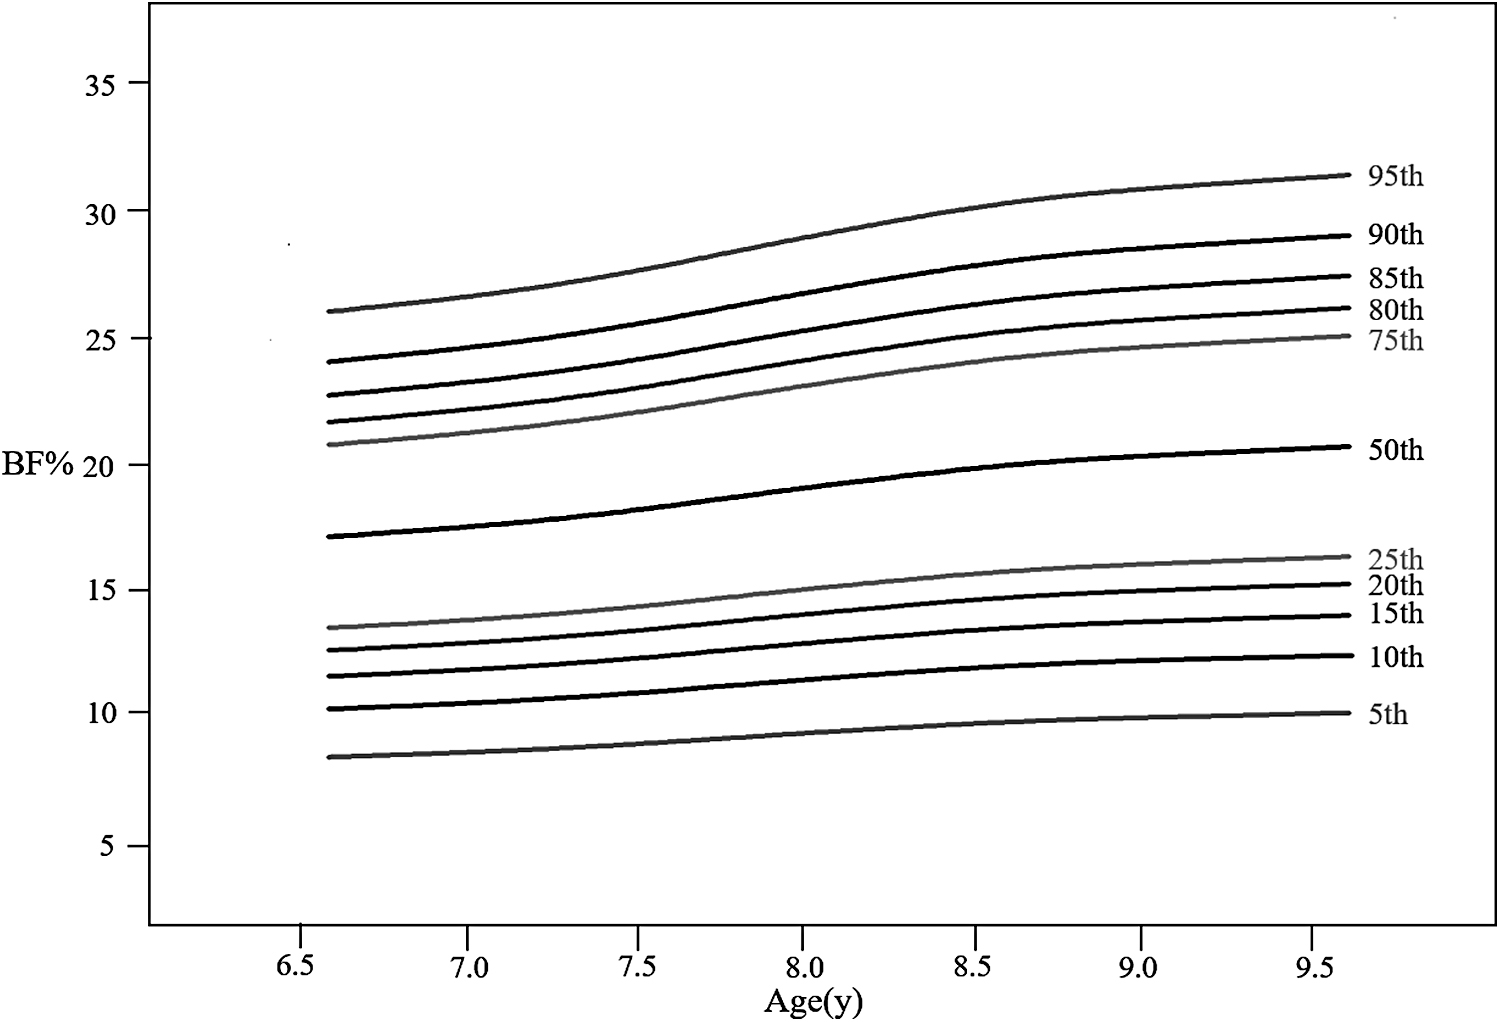
Percentile curves for BF% of females by the LMS method. BF%, body fat percentage; LMS, Lambda-Mu-Sigma.
Discussion
Our study examined the relationship between obesity and pubertal development; assessed the correlations between BMI, BF%, and sexual hormones; and estimated the percentile curves of BF% for our subjects. We found that females with overweight or obesity were more likely to exhibit early puberty, a result consistent with those reported in other studies.7–10 All anthropometry data were found to be higher in the early pubertal group than the normal maturation group.
In the linear correlation analysis, we found that there was a positive correlation between weight, BMI, WC, and BF%; it showed that girls with higher BF% might have higher weight, BMI, or WC than girls in the same age group, but not all the students with high weight, BMI, and WC have high BF%.
In the logistic regression analysis, we found that females with higher BF% had a higher risk of early puberty. This result was consistent with many studies. Benedet et al. found that early matured females had a higher prevalence of excess weight. 9
Regulating Mechanism of Sexual Hormones
Although the relationship between obesity and precocious puberty in females is undeniable, the mechanism has not been fully elucidated. Sexual hormones, such as E2, FSH, and LH, as a part of the HPG axis, play an important role in the process of pubertal development. Whether sexual hormones play a role in precocious puberty in females is worth discussion. Some studies have shown that in adolescent females with obesity, peripheral adiposity can express aromatase, which can convert adrenal androgens to E1 and E2.33,34 Data from adults suggest a strong positive relationship between body weight and capacity to convert androgens to E1 and E2. 35 Thus, obesity may lead to E1 and E2 release earlier, before the activation of the gonadal axis.8,10 As a result, for obese females, E1 levels increase earlier, making precocious puberty more likely.
However, studies in pubertal premenarchal females have not identified a correlation between obesity and serum E1 or E2 concentrations. 8 These results were mirrored in the current study, as we did not find any association between BMI, BF%, and E1. A potential reason could be that the peripheral adipose tissue, especially mammary adipose, can release estrogen and act locally to induce thelarche, but it would not be detected in the circulation.
Association of Socioeconomic Factors with Pubertal State
Although no differences in ethnicity were noted, different distributions of residencies and school type between the two groups were observed in our study. Females who lived in suburban areas and studied in private schools were more likely to exhibit early puberty than those in urban areas and public schools, which was contrary to the findings in a previous study 36 that found that the age at menarche in urban areas was earlier than in suburban areas. This was possibly due to urban females having higher socioeconomic status and improved nutrition compared with rural females. 36 However, in our study, we found that students who lived in suburban areas had a higher risk of early puberty. This may be related to national conditions, because, in China, urban residents typically have higher socioeconomic status than suburban residents, and parents who live in urban areas almost always have a higher education level, receive more relevant information, and pay more attention to children's health.
Further, we found that school type could influence pubertal development. One of the possible explanations is that students in previous studies exhibit higher weight. 37 This may be related to factors such as diet provided by school cafeteria and the differing family socioeconomic level distribution of children in different school types.
Percentile Curves of BF%
We found that the median BF% in females continuously increased by ∼22% from 6 to 9 years. BF% in some populations was higher than our subjects. 38 BF% is related to several factors, including measurement methods and ethnicity. Some previous studies have calculated BF% by measuring skinfold thickness, because it is quick and convenient. However, the accuracy of this method is questionable, as even the calculation formulas used have differed among studies. 38 Some previous studies have used the gold standard to measure BF%, which is dual-energy X-ray absorptiometry. 18 In our study, we used BIA. These different measuring methods may be the reason for the different standards of BF% in children with obesity.
To our best knowledge, compared with BMI, fat mass and fat distribution are more commonly used for assessing overweight/obesity and cardiovascular risk. However, as BF% is related to age, gender, ethnicity, region, measuring method, and other factors, it is hard to formulate a standard of overweight and obesity for children and adolescents. Williams et al. 39 identified thresholds of 30% for females, because this percentage was correlated with a significantly increased risk of cardiovascular disease in white and black children and adolescents. Many researchers, such as McCarthy et al. 40 recommended that BF% between the 85th and 95th percentile should be viewed as overweight and over the 95th percentile as obesity, which is applied to the IOTF cutoffs. A Chinese study proposed 70th values as a superior measure to judge obesity for children, because this value can better predict abnormal blood pressure and blood glucose metabolism. 41 Therefore, despite the calculation of the percentile curve of BF%, we lacked evidence to suggest a consistent cutoff value for judging overweight and obesity.
The strengths of our study include the use of BF%, rather than BMI, to analyze the association between obesity and precocious puberty. Moreover, we assessed the breast stages of females with overweight and obesity by ultrasound, rather than inspection alone, which can better distinguish breast tissue and fat tissue.
The main limitation of this study was it being a cross-sectional study and a baseline of a prospective cohort study. Cross-sectional studies can only establish correlations of weight state and puberty development, not causality. In the follow-up study, we will analyze the causal relationship between adiposity and precocious puberty. Further, for the first-grade children, the basic weight classification was based on the height and weight data reported by the parents, which was vulnerable to reporting error. Finally, we only analyzed the data of females from grades one to three in a city of Guangdong Province, which reduces the generalizability of the current findings to other populations.
In summary, our findings suggest that obesity is highly associated with precocious puberty, and the risk of precocious puberty increases with BF%. In addition, residencies and the types of school can also influence puberty development. The percentile curves of BF% for 6- to 9-year-old females were estimated by the LMS method. We will further explore the causal relationship between obesity and puberty developments in our following prospective cohort study, and we will extend our study to males, which has had mixed results in other studies.
Footnotes
Authors' Contributions
X.Y., S.F., C.L., and S.L. designed the study. X.L., S.F., J.L., S.H., T.Y., X.L., D.P., Y.L., Y.C., J.P., B.Z., X.F., C.L., and S.L. performed the research, including participants' enrollment, data collection. X.L., T.Y., and S.L. were responsible for data analysis. X.L. and S.L. drafted the main manuscript. C.L. and S.L. have full responsibility for the content of this article, which follows the writing rules of the STROBE Statement ( ) checklist studies, and approved its submission.
Data Availability Statement
Data are available after publication on reasonable request.
Funding Information
This study was supported by the National Science Foundation of China (81872637, 81903341, 81771630), Shanghai Municipal Commission of Health and Family Planning (201840324), Program of National Science and Technology Commission for association of diabetes and nutrition in adolescent (2016YFC1305204), Key discipline construction project of the 3-year action Plan of Shanghai Public Health System (GWV-10.1-XK07), Shanghai Professional and Technical Services Platform (18DZ2294100), Key Subject Program for Clinical Nutrition from Shanghai Municipal Health Commission (2019ZB0103), Chinese Translational Medicine Basic Instructure Project (TMSK-2020-124) and A Non-randomized Controlled Trial Based on gonadotropin-releasing hormone analogs in the treatment of different intervention models on behavioral norms and self-weight management in central precocious puberty and fast-progressing adolescent girls (2019B1017).
Author Disclosure Statement
The authors declare no conflicts of interest.
References
Supplementary Material
Please find the following supplemental material available below.
For Open Access articles published under a Creative Commons License, all supplemental material carries the same license as the article it is associated with.
For non-Open Access articles published, all supplemental material carries a non-exclusive license, and permission requests for re-use of supplemental material or any part of supplemental material shall be sent directly to the copyright owner as specified in the copyright notice associated with the article.
