
Abstract
Dear Editor:
In their recent article “The relation of adiposity rebound to subsequent BMI in a large electronic health record database,” Freedman et al. 1 report that both age at adiposity rebound (AR) and BMI at rebound are independently related to BMI after age 10 years and suggest that BMI at ages 5–7 years may be more practical to predict subsequent obesity. This article confirms the predictive value of the AR demonstrated years ago 2 but reiterates previously expressed misconceptions that tend to undermine the value of the concept of AR for which a clarification was recently published. 3
As described earlier, BMI increases during the first year of life and then decreases to a minimum. In the article by Freedman et al., the beginning of the second rise originally termed “Adiposity rebound” 2 is referred to as “BMI rebound.” The reason for this change of denomination is not given. It might be because BMI does not only represent adiposity. In fact, BMI curves reflect fatness variations and, even if lean body mass can contribute to the second rise in BMI, no rebound exists in the development of lean mass. Of note, the similarity between BMI and skinfold curves, showing ascending and descending phases, was an argument to validate the first published BMI charts. 4 The term “Adiposity Rebound” is then appropriate. Besides, “BMI rebound” can generate confusions as it could correspond to either BMI value at AR (kg/m2) or to the age at AR (years). Consequently, the usual terms “age at AR” and “BMI at AR” are clearer and there is no justification to rename a classic concept proposed about 40 years ago.
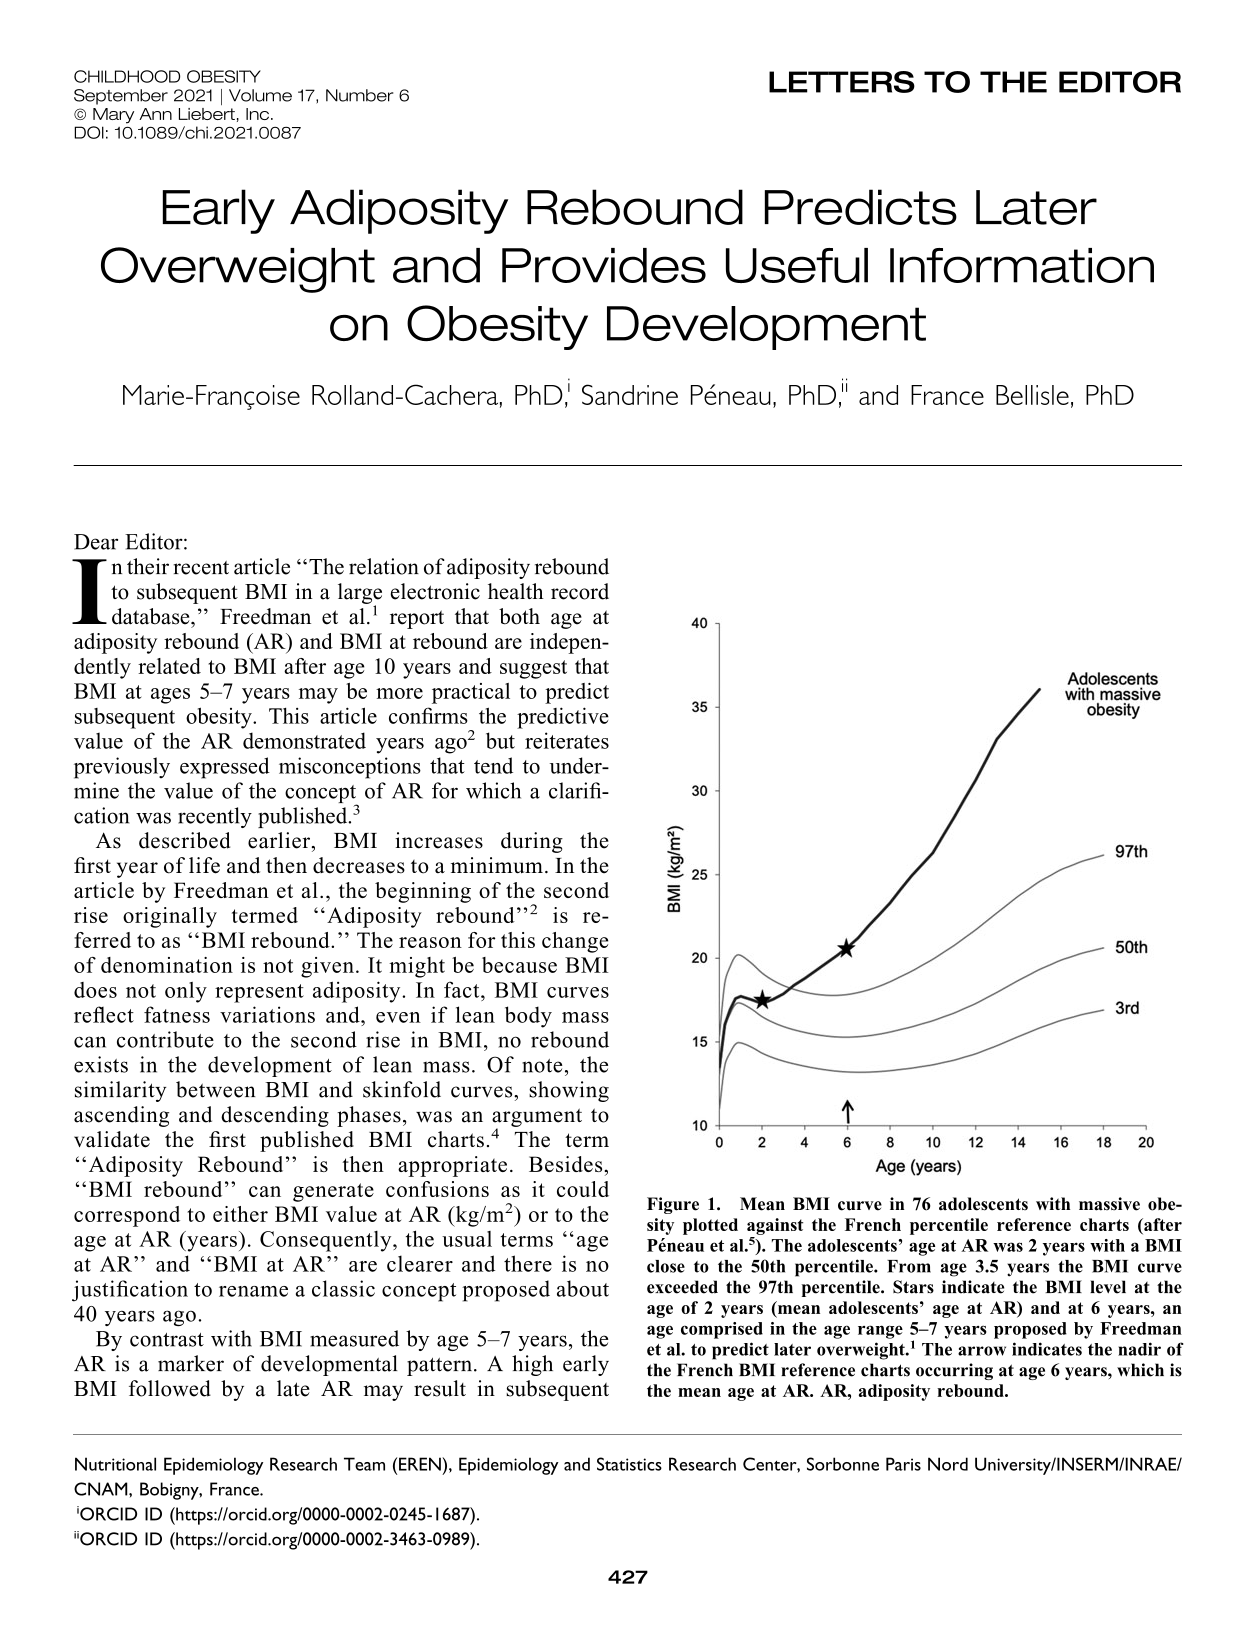
By contrast with BMI measured by age 5–7 years, the AR is a marker of developmental pattern. A high early BMI followed by a late AR may result in subsequent normal or low body weight, whereas a low BMI at the time of an early AR can be associated with later overweight. This latter pattern is particularly associated with metabolic diseases. 3 It is generally observed that most individuals with obesity were not overweight in childhood. In a study of adolescents with massive obesity, 5 AR occurred at mean age 2 years. At this age, BMI value was not high and overweight developed only later on (Fig. 1).

Mean BMI curve in 76 adolescents with massive obesity plotted against the French percentile reference charts (after Péneau et al. 5 ). The adolescents' age at AR was 2 years with a BMI close to the 50th percentile. From age 3.5 years the BMI curve exceeded the 97th percentile. Stars indicate the BMI level at the age of 2 years (mean adolescents' age at AR) and at 6 years, an age comprised in the age range 5–7 years proposed by Freedman et al. to predict later overweight. 1 The arrow indicates the nadir of the French BMI reference charts occurring at age 6 years, which is the mean age at AR. AR, adiposity rebound.
An early AR is a marker of advanced maturation (measured by bone age) 2 characteristic of childhood obesity, but it appears well before pubertal markers such as early menarche. 3 Furthermore, the BMI pattern associated with an early AR suggests that determinants of future risks operate in early life, a domain widely explored nowadays. BMI values collected by age 5–7 years, although they strongly correlate with BMI after age 10 years, offer no comparable early predictive power and provide only limited information.
Consequently, we believe that replacing “adiposity rebound” by “BMI rebound” is not justified and even misleading, and that using BMI values to predict overweight rather than considering the age at AR (when data are available), deprives research of useful information on the development of obesity.