




Abstract
Background:
Child weight status is inversely associated with fitness, but less is known about this relationship across fitness domains. This study examined the longitudinal association between weight status and fitness domains in a large, diverse sample of children.
Methods:
Data were drawn from the New York City Fitnessgram (2010–2011 to 2017–2018). Height and weight were collected annually and converted to weight status using Centers for Disease Control and Prevention growth charts. Aerobic capacity, muscular strength, and endurance were measured as age and sex standardized z-scores based on the fitness performance tests. Repeated-measures multilevel models were run testing the association between weight status and 1-year lagged fitness domains.
Results:
The sample included 917,554 children (51.8% male, 39.3% Hispanic, 29.9% non-Hispanic Black, 13.9%, 4.7%, and 1.7% class I, II, and III obesity, respectively). For each fitness domain, fitness scores decreased with increasing weight status across all demographic categories, with the lowest fitness scores observed in children with the most severe obesity, and highest magnitude of effects for aerobic capacity, and particularly among boys, non-Hispanic Whites, and older youth. For example, compared with youth with healthy weight, youth with overweight had 0.28 standard deviation lower aerobic capacity performance [confidence interval (95% CI): −0.29 to −0.28], followed by class 1 obesity (β = −0.57, 95% CI: −0.58 to −0.57), class 2 obesity (β = −0.88, 95% CI: −0.88 to −0.88), and class 3 obesity (β = −1.19, 95% CI: −1.20 to −1.18).
Conclusions:
Compared with youth with healthy weight, youth at every other weight status had lower subsequent fitness, with the magnitude of the relationship increasing as weight status increased. Future research should examine interventions targeting aerobic capacity to reduce fitness disparities.
Introduction
Physical fitness is a strong, independent predictor of both current and future health in children and adolescents.1,2 Greater physical fitness is associated with improved cardiometabolic health, cognition, musculoskeletal development, and academic performance in youth.3,4 Evidence indicates that both cardiorespiratory and muscular fitness are associated with reduced adiposity and improved cardiometabolic outcomes, whereas muscular fitness is especially important for bone health in children.5–9 As such, the Physical Activity Guidelines for Americans and World Health Organization recommend 60 minutes of moderate to vigorous physical activity per day and muscle/bone strengthening activities at least three times per week for children and adolescents to support cardiorespiratory and muscular fitness.10,11
Despite these recommendations, many children are not obtaining optimal fitness. For instance, in the United States, only 42% of children 12–15 years obtain optimal cardiorespiratory fitness levels, a decline from previous years. 12 Furthermore, data from 19 countries indicate that cardiorespiratory fitness has declined worldwide, with a plateau in recent years. 13 Studies examining trends in muscular fitness have also shown declines over time.14,15 With population level declines in children and adolescents' cardiorespiratory and muscular fitness, it is essential to understand differences in children's fitness among the different fitness domains as well as population subgroups that are most in need of intervention.
Children with obesity are at greater risk for low fitness compared with their healthy weight peers as a result of lower physical activity participation owing to mobility challenges (difficulty or discomfort) and weight-based stigma.12,16–18 This is further exacerbated by wide disparities in fitness and obesity across sex, age, race/ethnicity, and income categories.13,19–25 To date, much of the work examining the association between obesity and fitness in children has focused on a single category of obesity. However, recent recommendations suggest classifying children with obesity based on the severity of obesity, similar to adult obesity. 26 This is particularly important given increases in the prevalence of severe obesity among youth, as well as evidence indicating that children with severe obesity are at greater risk for various cardiometabolic risk factors.25,27
Few studies have simultaneously examined fitness domains in children with obesity within demographic subgroups. Understanding differences in cardiorespiratory fitness and muscular strength and endurance in children with obesity is particularly important to ensure interventions can effectively target the domains of fitness where these children may be lagging. Therefore, the aims of this study were to (1) longitudinally examine the association between weight status and 1-year lagged cardiorespiratory and muscular fitness, and (2) examine these associations stratified by sex, age, and race/ethnicity using a dataset containing 7 years of weight and fitness data from New York City (NYC) public school children. Building on prior research demonstrating declines in obesity and improvements in fitness among NYC youth,24,28 findings from this study will identify domains of fitness that may be targeted to reduce fitness disparities among high-need youth subgroups.
Methods
This study uses longitudinal data from the NYC Fitnessgram dataset jointly managed by the NYC Department of Education (DOE) and Department of Health and Mental Hygiene (DOHMH).28–32 All protocols were approved by the DOHMH Institutional Review Board, which determined this study was exempt from obtaining written informed consent.
NYC Fitnessgram
The NYC Fitnessgram dataset includes annual assessments of height, weight, and fitness for all NYC school children enrolled in a general education public school beginning in 2006–2007. Students at private, charter, or special education schools were not included. As part of the annual Fitnessgram assessment, height and weight were assessed for all students (K-12) and complete fitness assessments for students in 4th–12th grade. Assessments were administered by teachers during physical education classes using a standard protocol based on the Cooper Institute's Fitnessgram, a reliable and valid assessment of child fitness. 33 For this study, students were included if they were enrolled in grades 4–12 during the 2010–2011 through 2017–2018 school years and were between the ages of 9–19 years at the end of the first eligible school year. In addition, students had to have at least 1 year with both height and weight measurements, scores for each of the three fitness assessments of interest [i.e., Progressive Aerobic Cardiovascular Endurance Run (PACER), push-ups, and curl-ups], nonmissing date of birth, and nonmissing sex.
Child Weight Status
Calibrated scales were used to collect weight data (Seca Model 869; Seca North America East Medical Scales & Measuring Devices, Hanover, MD). A stadiometer (Seca 217 Mechanical Telescopic; Seca North America East Medical Scales & Measuring Devices) was used to collect height data. Age- and sex-specific BMI was computed based on the following formula: BMI = [(weight [kg])/(height [m]) 2 ]. Children's height and weight were used to calculate age- and sex-specific BMI using CDC criteria.34,35 Age in months was calculated from the measurement date and students' date of birth was drawn from school enrollment records. Weight status was defined according to CDC growth chart-derived norms for sex and age and used to compute the BMI percentile for each child as follows: underweight (<5th percentile), healthy weight (5th to <85th percentile), overweight (85th to <95th percentile), and obese (≥95th percentile). Children with obesity were further classified in accordance with previous reports.26,35 Specifically, class I obesity was defined as BMI ≥95th percentile or a BMI >30; class II obesity was defined as a BMI ≥120% of the 95th percentile or a BMI of ≥35; and class III obesity was defined as a BMI ≥140% of the 95th percentile or a BMI of ≥40 or greater.
Child Fitness Outcomes
The primary outcomes included age- and sex-specific z-scores for the PACER, push-up and curl-up tests. 33 The PACER is a multistage shuttle run designed to measure aerobic capacity. The objective was to run back and forth across a 20-m course to a pace that increases incrementally after each minute. Push-ups are performed at a 90° elbow angle, and sit-ups are conducted with knees flexed and feet free. Both are completed without rest and set to a specified standard pace. Sit and reach is performed with legs extended in front of the body and feet flat against the bottom of a built-in foot plate. After a proper warm-up, participants slowly reach forward with one hand over the other and hold their maximum reach for a few seconds. Scores were converted to z-scores to account for expected improvements in performance with increasing age and sex. All z-scores were created by pooling youth actively enrolled in the NYC DOE during the study period, and pooling PACER, curl-up, and push-up valid scores and accounting for the sex × age in months. Only valid PACER, curl-up, and push-up scores were included for each year of data from each child.
Covariates
Children's sex, grade, race/ethnicity, country of birth, English language learner status, and poverty status were drawn from NYC DOE student enrollment records linked to Fitnessgram data by a unique identifier. These variables were shown to be associated with both weight status and fitness in prior literature.28,36–38 Grade level was categorized into 4th–8th grade or 9th–12th grade. Race/ethnicity was grouped into five categories: non-Hispanic White, non-Hispanic Black, Hispanic, Asian/Pacific Islander, and other (including multiple races and refusal to provide). Country of birth was categorized into foreign born or US born. English language learner status was categorized as a binary (yes/no) variable. To categorize children in terms of poverty status, individual child household poverty was based on baseline child eligibility/noneligibility for free/reduced price school meals through the National School Lunch Program, which provides meal assistance according to household income at or <185% of the federal poverty level. 39 Time (calendar year) was included to account for potential cohort effects.
Statistical Analyses
Descriptive statistics were computed to summarize sample characteristics. Means and standard deviations (SD) were calculated for the PACER, push-up, and curl-up z-scores by weight status across sex, grade level, and race/ethnicity. Next, repeated-measures mixed models with random intercepts were fit to the data to test the longitudinal association between weight status and 1-year lagged fitness for PACER, push-up, and curl-up z-scores by clustering annual observations at the census tract level. We lagged fitness to weight status to account for temporality between exposure and outcome. Crude and adjusted models were also run stratifying analyses by sex, grade level, and race/ethnicity. All adjusted models included sex, grade level, race/ethnicity, English language learner status, eligibility for free/reduced price meals, country of birth, and time as covariates. Statistical analyses were performed using SAS v.9.4.
Results
The sample included 917,554 students representing 3,602,374 observations from 2010–2011 through 2017–2018 school years. Sample characteristics are provided in Table 1. Half of children were male (51.8%) and the majority were either Hispanic (39.3%) or non-Hispanic Black (29.9%), eligible for free/reduced price meals (70.5%) and foreign born (72.1%). During the study period, the majority of observations were obtained during elementary and middle school years (54.1%) and 18.6%, 13.9%, 4.7%, and 1.7% of children had overweight, class 1, class 2, and class 3 obesity, respectively.
Sample Characteristics for New York City Public School Children in Grades 4–12, 2010–2017 (N = 917,554)
Missing: gender (n = 1); weight status (n = 113,998).
Students contributed 3,602,374 observations from 2010 to 2017.
Because there were multiple observations at different time points, these categories are presented for all observations.
Table 2 presents the mean PACER, push-up, and curl-up z-scores by weight status, sex, grade level, and race/ethnicity. Children with healthy weight had the highest z-scores for each fitness domain compared with all other weight categories.
Mean (Standard Deviation) PACER, Push-Up, and Curl-Up z-Scores by Sample Characteristics and Weight Status for New York City Public School Children, 2010–2017
NH, non-Hispanic; PACER, progressive aerobic cardiovascular endurance run; SD, standard deviation.
Estimates from adjusted analyses show that for each fitness domain, z-scores decreased with increasing weight status across all demographic categories, with the lowest fitness scores observed in children with the most severe obesity. For example, compared with youth with healthy weight, youth with overweight had 0.28 SD lower PACER performance [confidence interval (95% CI): −0.29 to −0.28], followed by class 1 obesity (β = −0.57, 95% CI: −0.58 to −0.57), class 2 obesity (β = −0.88, 95% CI: −0.88 to −0.88), and class 3 obesity (β = −1.19, 95% CI: −1.20 to −1.18; Fig. 1). In addition, the magnitude of effects for the relationship between weight status and fitness performance was highest for the PACER test, followed by the push-up test and curl-up test.
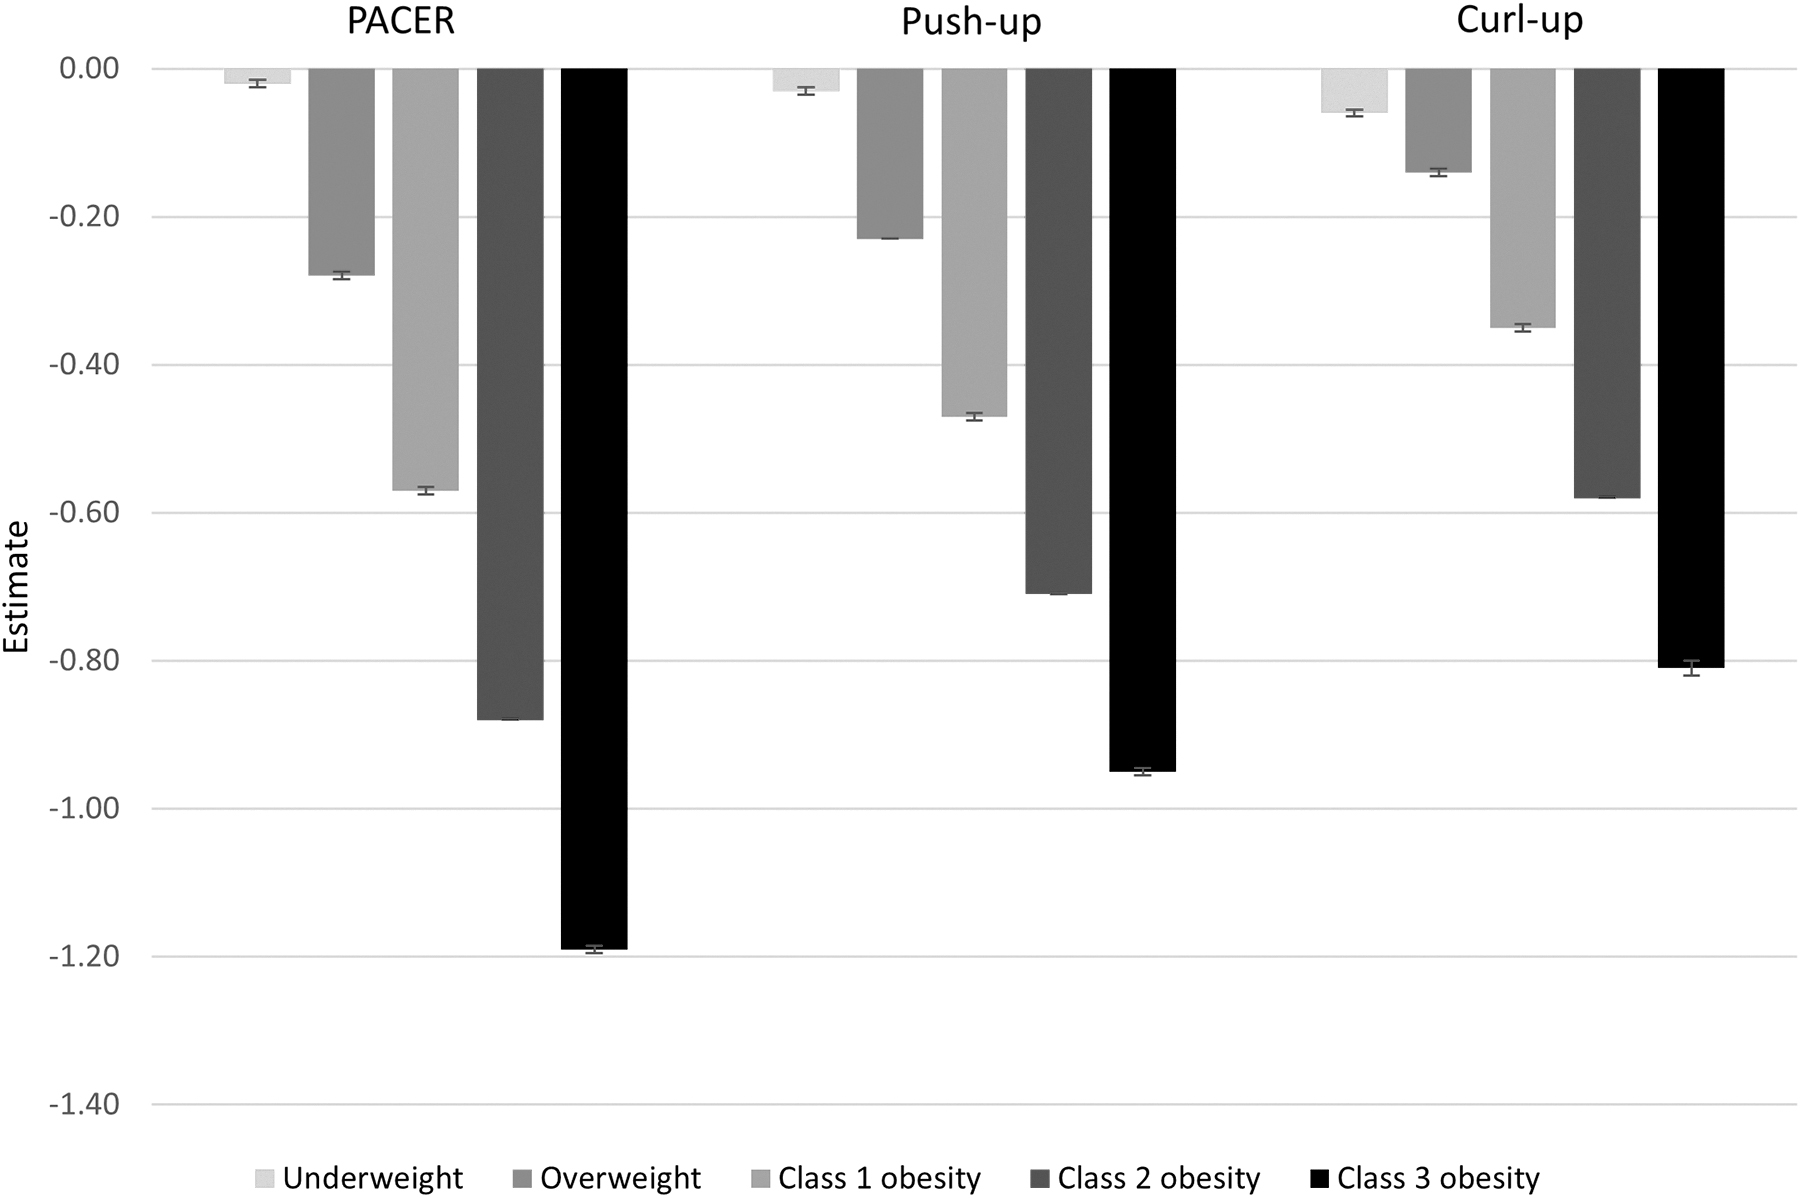
Point estimates with 95% confidence intervals for the association between weight status, PACER, push-up, and curl-up z-scores (reference: healthy weight) among NYC public school children 2010–2017 controlling for sex, grade level, race/ethnicity, English language learner status, eligibility for free/reduced price meals, country of birth, and time. NYC, New York City; PACER, progressive aerobic cardiovascular endurance run.
Figures 2–4 provide estimates from adjusted analyses stratified by sex, grade level, and race/ethnicity, respectively. Consistent with unstratified models, children with higher weight status compared with healthy weight showed greater declines in fitness z-scores for the PACER, push-up, and curl-up tests across sex, grade level, and race/ethnicity. For each domain of fitness, the strength of the association increased for boys compared with girls across all weight categories, with the magnitude of the difference increasing with increasing weight status. For example, compared with boys with healthy weight, boys with overweight had 0.29 SD lower PACER performance (95% CI: −0.30 to −0.29), followed by class 1 obesity (β = −0.60, 95% CI: −0.61 to −0.60), class 2 obesity (β = −0.92, 95% CI: −0.93 to −0.92), and class 3 obesity (β = −1.25, 95% CI: −1.26 to −1.24). In contrast, compared with girls with healthy weight, girls with overweight had 0.27 SD lower PACER performance (95% CI: −0.28 to −0.27), followed by class 1 obesity (β = −0.53, 95% CI: −0.54 to −0.53), class 2 obesity (β = −0.82, 95% CI: −0.83 to −0.82), and class 3 obesity (β = −1.11, 95% CI: −1.13 to −1.10). Older youth (grades 9–12) demonstrated a stronger weight category fitness association for both the PACER and push-up tests (Fig. 3). Non-Hispanic White children also had the strongest negative association between weight status and fitness z-scores for the PACER, push-up, and curl-up tests (Fig. 4). Across all weight categories, the negative association was most attenuated for non-Hispanic Black children for both the push-up and curl-up tests. For all sex, grade level, and race/ethnicity categories, the strongest negative association between weight status and fitness was observed for the PACER test.
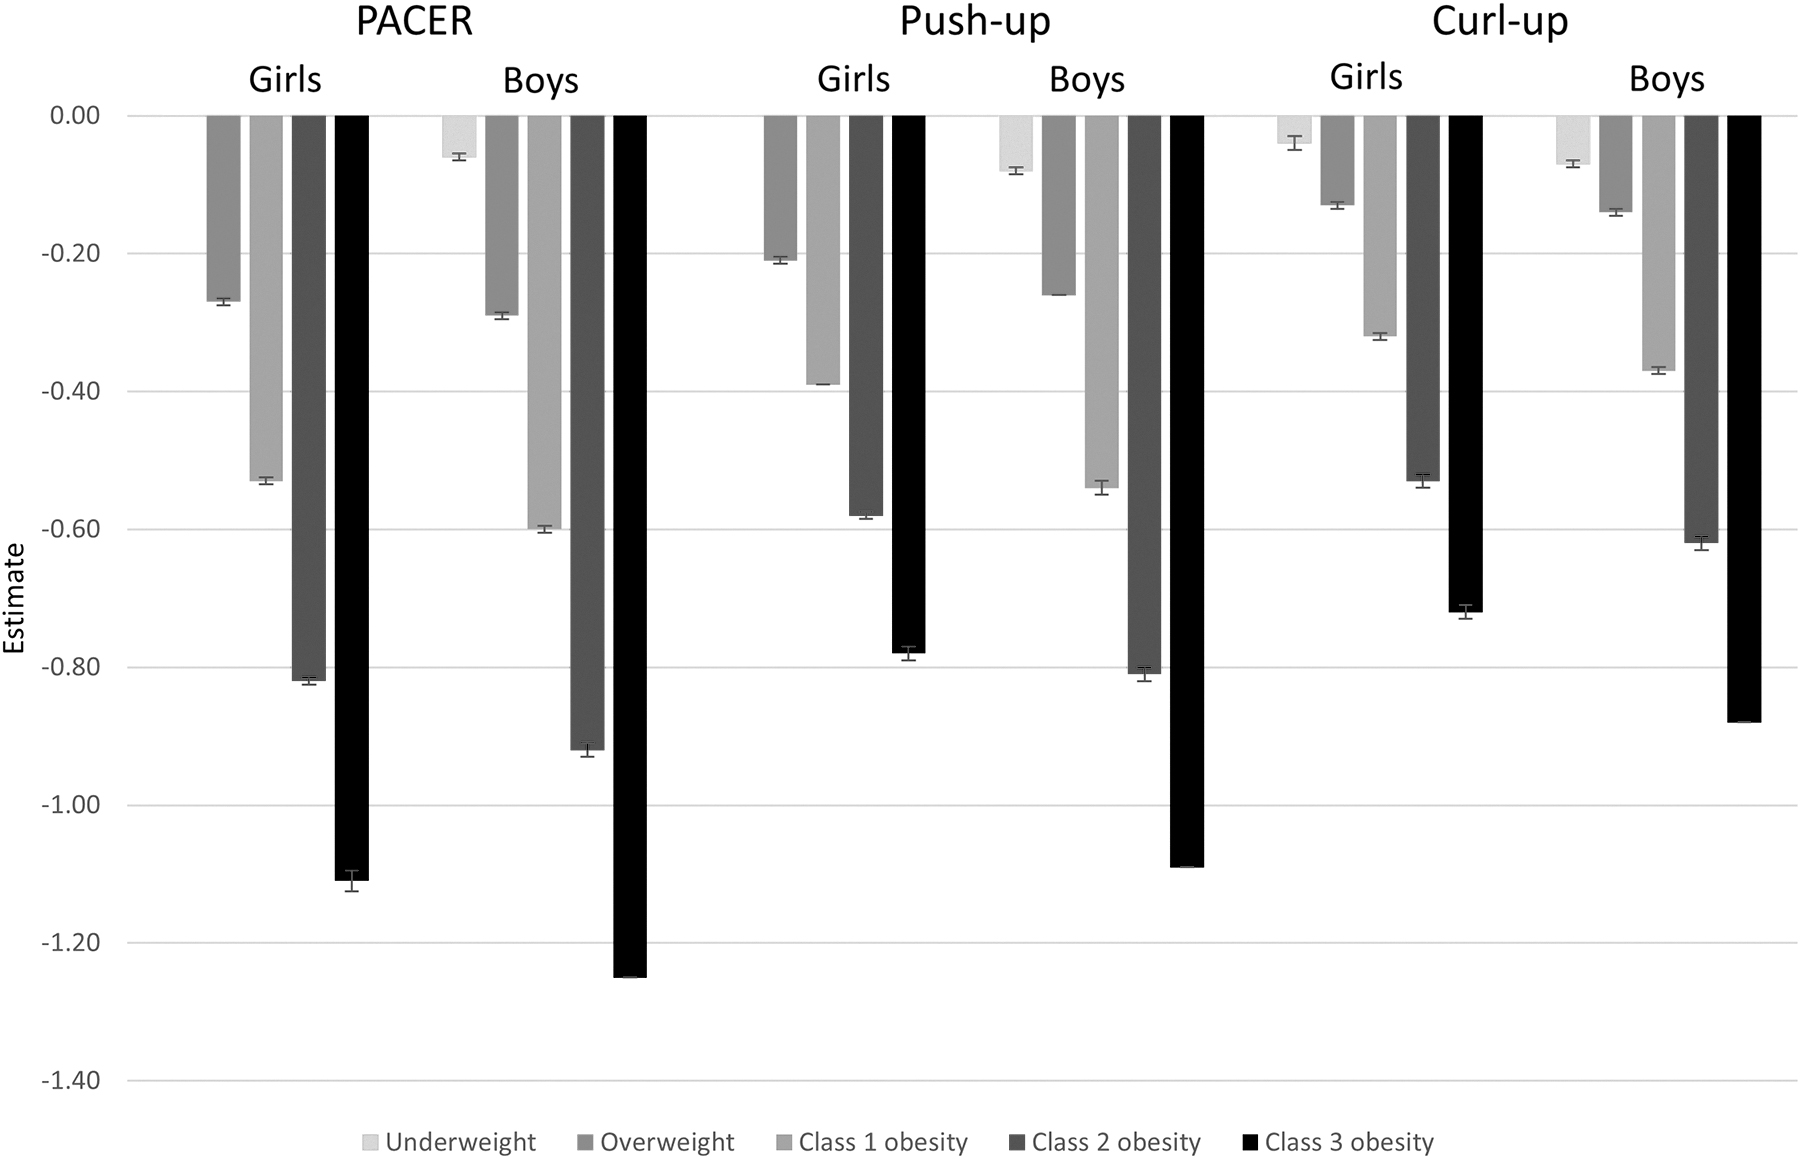
Point estimates with 95% confidence intervals for the association between weight status, PACER, push-up, and curl-up z-scores (reference: healthy weight) stratified by sex among NYC public school children 2010–2017 controlling for grade level, race/ethnicity, English language learner status, eligibility for free/reduced price meals, country of birth, and time. NYC, New York City; PACER, progressive aerobic cardiovascular endurance run.
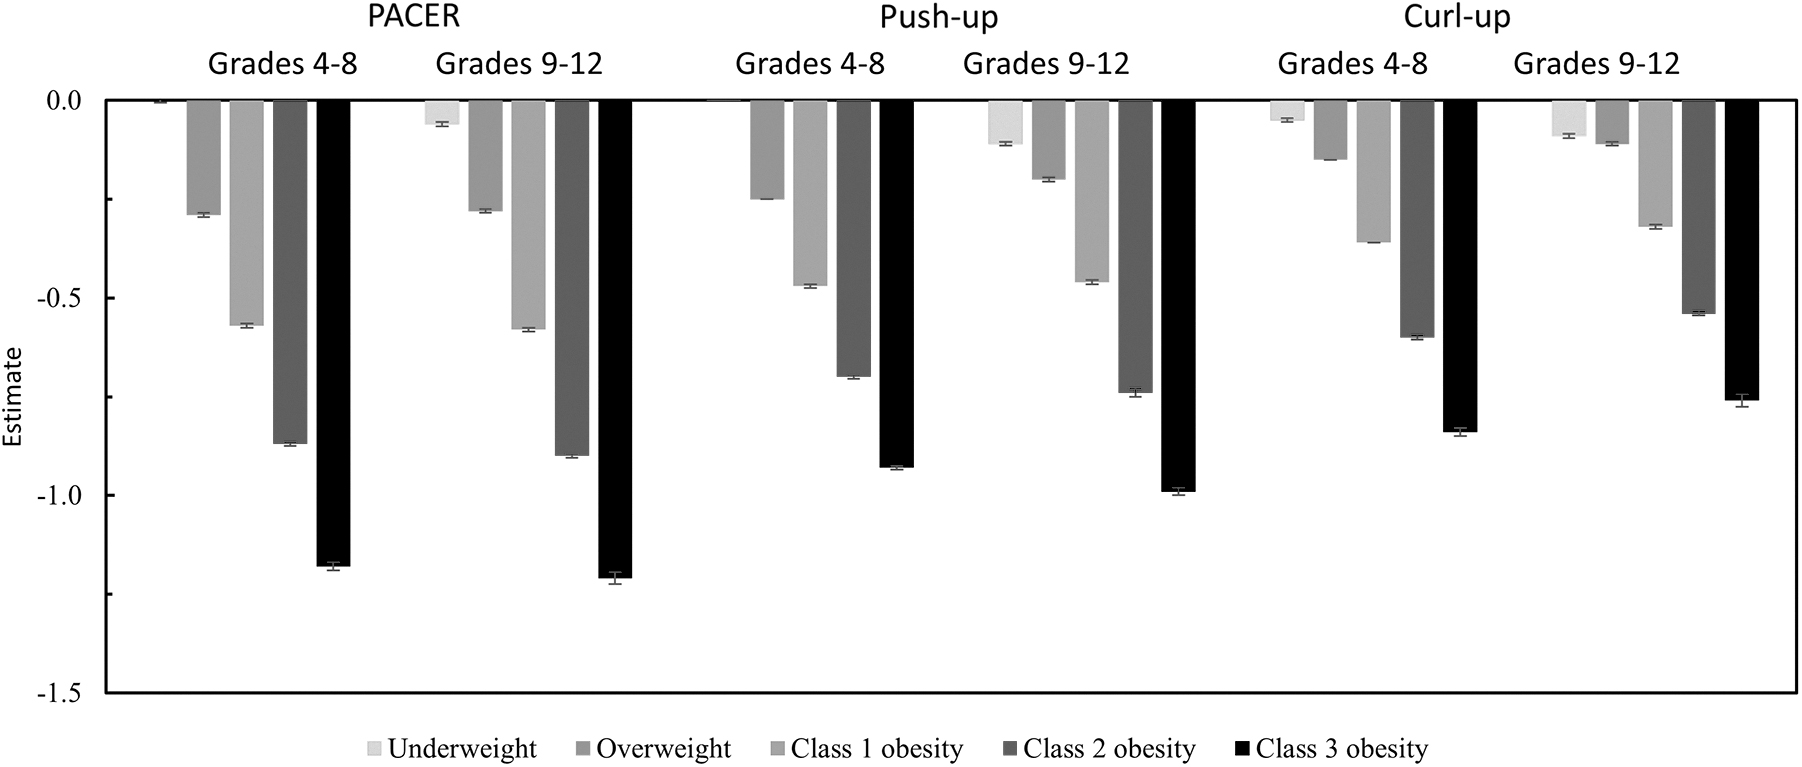
Point estimates with 95% confidence intervals for the association between weight status, PACER, push-up, and curl-up z-scores (reference: healthy weight) stratified by grade among NYC public school children 2010–2017 controlling for sex, race/ethnicity, English language learner status, eligibility for free/reduced price meals, country of birth, and time. NYC, New York City; PACER, progressive aerobic cardiovascular endurance run.
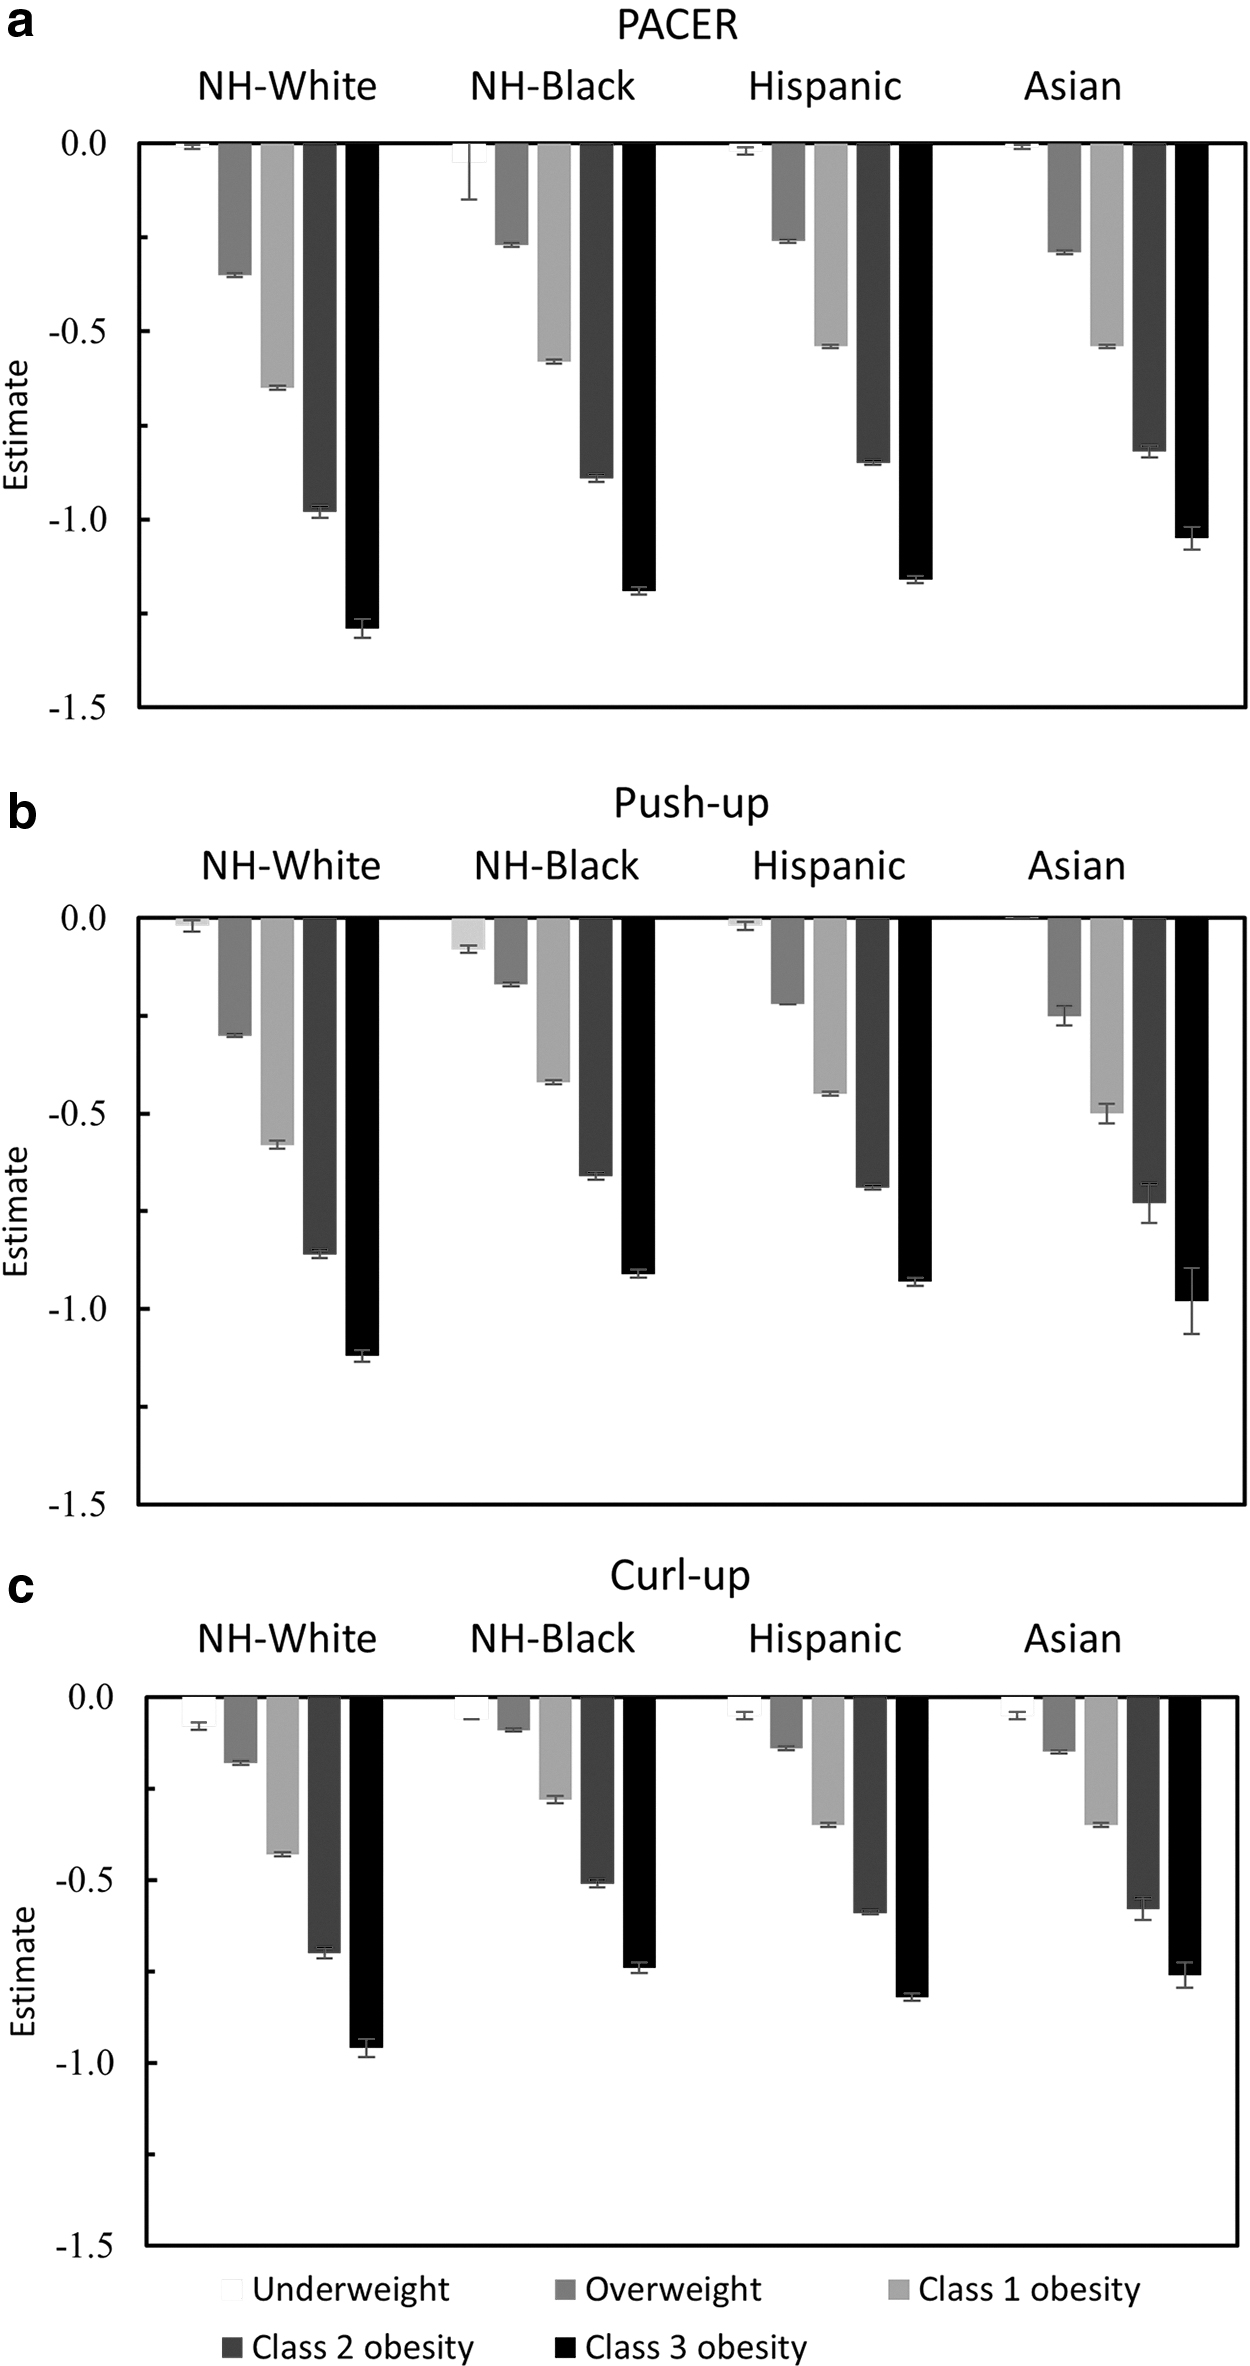
Point estimates with 95% confidence intervals for the association between weight status, PACER
Discussion
Given population level declines in children and adolescents' cardiorespiratory and muscular fitness, it is essential to identify subgroups that are most in need of intervention. In this study, analyzing 7 years of longitudinal data from almost 1 million NYC youth, we found an inverse relationship between weight status, aerobic capacity, and muscular strength and endurance, with the greatest magnitude of effects observed for aerobic capacity. Stratified analyses revealed that the relationship between increasing weight status and poorer fitness scores was strongest among boys and non-Hispanic White students for all domains, and older youth for the PACER and push-up tests. Public health interventions to combat youth fitness declines require targeted interventions to promote aerobic capacity, particularly among youth with obesity.
A key finding from this study was the inverse relationship between weight status and each domain of fitness, with the strongest inverse relationship observed for the PACER test measuring aerobic capacity. Cardiorespiratory fitness is an independent predictor of present and future health, including metabolic syndrome, coronary heart disease, type 2 diabetes, and breast and colon cancer.40–42 BMI is also strongly associated with youth cardiorespiratory fitness. More specifically, obesity is inversely associated with moderate to higher levels of cardiorespiratory fitness, and small increases in cardiorespiratory fitness can have large health impacts on children and adolescents. 43 Moreover, although muscular strength and endurance training is associated with insulin resistance among adults with obesity, 44 less is known about this relationship among youth. Earlier research has shown that youth with higher weight status perform less well on muscular strength and endurance tests compared with normal weight peers. 45 Pilot studies have also established a relationship between participation in resistance training and decreases in systemic inflammation in obese youth, 43 although additional research is needed to compare these effects across youth in different weight classes to better address findings reported in this study. Earlier research has also suggested that youth with obesity may be less able to participate in aerobic activities that would increase their cardiorespiratory fitness, 43 reinforcing findings from this study (i.e., that the higher weight status–lower fitness association was most pronounced for the PACER vs. push-up and curl-up tests).
Stratified analyses revealed that there was a stronger weight status–fitness relationship among boys and non-Hispanic White children. In other words, among youth with overweight and obesity, fitness was lower among White youth and boys compared with non-White youth and girls. Earlier research indicates that, ignoring weight status, both overall physical activity and fitness are higher among White youth compared with minority youth, 36 and also that White youth have lower obesity prevalence compared with their minority counterparts. 25 These patterns have been attributed in part to neighborhood-level disparities in access to healthy foods and physical activity recreation that is safe and accessible.46,47 However, earlier studies have found that minorities participate in more school-related active transport than nonminorities. 48 Perhaps youth with a higher weight status are less likely to take advantage of neighborhood amenities that promote fitness unless they are necessitated, such as active transportation to and from school. Similarly, perhaps psychosocial factors might account for a stronger relationship between weight status and fitness among boys compared with girls. 49 Earlier work indicates that boys have lower obesity and higher fitness overall than girls.24,25 This is in part related to higher physical activity self-efficacy, and lower impact of perceived crime/safety on physical activity participation among boys compared with girls. 49 However, perhaps among youth with increasing weight status, boys with obesity no longer have higher physical activity self-efficacy and lower perceived safety compared with girls. Findings from this analysis may in this sense suggest a leverage point for reducing fitness disparities among youth with overweight and obesity by promoting additional active transportation, physical activity self-efficacy, and neighborhood safety. Future research should examine the weight status–fitness relationship among youth demographic subgroups taking into account neighborhood factors.
The findings in this study highlight the importance of promoting both cardiorespiratory and muscular fitness in children of all ages, particularly those with obesity, and provide evidence for subpopulations where intervention may be particularly helpful. Of importance, for children with obesity, improvements in fitness even in the absence of weight loss can have beneficial effects on current and future cardiometabolic health.50,51 Clinical screening and intervention may be especially important for children with obesity to provide children with access to resources such as physical therapists who can help children set safe, achievable, and sustainable goals for improving fitness. Weight-related quality of life and health-related quality of life also have potential to be improved through fitness promotion interventions that provide physical activity for youth with obesity. 52
Future research should also address the relationship between structural and social factors, particularly school programs and amenities on youth fitness, particularly for youth with increasing weight status. School-based programs and policies, for example, can promote fitness and address disparities by providing fitness opportunities for all youth. For instance, within the NYC DOE, the Move-to-Improve program incorporates fitness breaks into the academic curriculum for children in kindergarten through third grade. 53 In addition, the Cooperative, Healthy, Active, Motivated, Positive Students program provides middle school children with sports and fitness resources outside of school hours, 54 whereas HealthCorps is a peer mentorship program for high school students that includes discussions around fitness and an activity curriculum. 55 At the policy level, PE Works is a multiyear initiative to remove barriers and improve the physical education curriculum for students of K-6. 56 This is especially important given that evidence indicates children actually accumulate little Moderate to Vigorous Physical Activity during physical education classes, despite the focus on physical activity. 57
Community initiatives may also hold promise for improving child fitness and reducing disparities. Exercise-focused afterschool programs and community programs operated through organizations like Parks and Recreation and the Young Men's Christian Association are often embedded in high-risk communities and have the potential to provide fitness promoting opportunities for diverse populations of youth.52,58–59 For instance, an evaluation of an afterschool physical activity and fitness intervention found improved fitness and body fat percentage among participants. 60 Another study examining the Fit2Play program delivered through Miami Dade Parks and Recreation showed improvements in cardiorespiratory fitness and reductions in adiposity and blood pressure in children with severe obesity. 61
Although this study used longitudinal weight and fitness measures, assessed multiple domains of fitness, included a large, diverse sample of children and adolescents, and had adequate representation of children with severe obesity, there were several limitations. First, because data come from NYC public school children, the findings may not be applicable to children in nonpublic schools as well as children in suburban or rural settings. Second, the NYC Fitnessgram testing was completed by public school teachers rather than researchers, making it possible that there may have been differences in the administration of the assessment. However, all NYC Fitnessgram administrators are provided with training and educational materials before administering the tests. Finally, although we included individual level covariates, we did not account for community and built environment level variables that may influence the weight status–fitness relationship.
Conclusion
Fitness is a strong predictor of current and future health among youth, although population-level youth fitness is in decline. This study examined the longitudinal relationship between weight status and fitness domains for NYC students from 2010 to 2018. Compared with youth with healthy weight, youth at every other weight status had lower subsequent fitness, with the magnitude of the relationship increasing as weight status increased. Children with the most severe obesity, boys, non-Hispanic Whites, and older youth may be particularly vulnerable. These findings indicate the need for physical activity and fitness promotion that target aerobic fitness among youth at a population level. Furthermore, specific subpopulations may benefit from targeted interventions to reduce disparities and improve the health and well-being of children.
Footnotes
Impact Statement
Compared with youth with healthy weight, youth at every other weight status had lower subsequent fitness, with the magnitude of the relationship increasing as weight status increased. Physical activity and fitness promotion that target aerobic fitness have potential to reduce disparities and improve the health and well-being of children.
Funding Information
No funding was received for this work.
Author Disclosure Statement
No competing financial interests exist.