
Abstract
Background:
This study examined the associations between BMI trajectories and emerging cardiometabolic risk (CMR) in children living in low-income and racially and ethnically diverse households in the United States.
Methods:
Data were drawn from NET-Works randomized intervention trial and NET-Works 2 prospective follow-up study (N = 338). BMI was measured across 6 follow-up visits and biomarkers of cardiometabolic risk (CMR) at the sixth visit. Group-based trajectory modeling identified child BMI trajectories. Adjusted multivariable linear regressions evaluated the associations between BMI trajectories and CMR.
Results:
We identified two BMI trajectories: 25% followed a trajectory of steep BMI increase, and 75% followed a moderate decreasing BMI trajectory over time. Relative to children in the moderate decreasing trajectory, children in the increasing trajectory had higher adjusted mean levels of C-reactive protein [CRP; 3.3; 95% confidence interval (CI): 1.6 to 5.0], leptin (63.1; 95% CI: 44.3 to 81.8), triglycerides (35.4; 95% CI: 22.1 to 48.6), triglyceride/high-density lipoprotein (HDL) ratio (1.2; 95% CI: 0.8 to 1.6), hemoglobin A1c (HbA1C; 0.1; 95% CI: 0.03 to 0.2), fasting glucose (1.8; 0.1 to 3.5) and insulin (8.8; 95% CI: 6.5 to 11.0), overall CMR score (0.7; 95% CI: 0.5 to 0.9), and lower adiponectin (−1.3; 95% CI: −2.5 to −0.1) and HDL (−10.8; 95% CI: −14.3 to −7.4).
Conclusions:
Children with high BMIs early in childhood were more likely to maintain an accelerated BMI trajectory throughout childhood, which was associated with adverse CMR in pre-adolescence. To advance health equity and support children's healthy weight and cardiovascular health trajectories, public health efforts are needed to address persistent disparities in childhood obesity and CMR.
Introduction
Childhood obesity is highly prevalent in the United States. 1 Over 21% of children 2–19 years of age currently live with obesity, which is a risk factor for cardiometabolic disease as children age.1–3 Premature obesity-related complications, such as accelerated atherosclerosis, hypertension, and type 2 diabetes, can also be observed in children living with obesity. 4 While these conditions are most frequently observed during adulthood, the pathophysiological processes for the development of these diseases are believed to start early in life, manifesting as disturbances in biomarkers of cardiometabolic risk (CMR) resulting from complex interactions between individual biological and genetic predisposition and the influence of behavioral, socioeconomic, and environmental factors.4,5
Racially and ethnically minoritized populations and children who are economically and socially disadvantaged are disproportionately affected by childhood obesity and emerging CMR.6,7 These populations have been marginalized by socially constructed racial hierarchies (e.g., structural racism), which leads to added stress and consequent hormonal changes and inflammation in the body [weathering hypothesis (i.e., wear and tear of the body's biological mechanisms)], thus contributing to the aforementioned disparities in obesity and CMR during childhood.8,9
Studies have shown that abnormalities in cardiovascular risk factors and higher weight status during childhood tend to track into adulthood and increase future cardiometabolic disease risk.10–12 Yet, it is not well established how early childhood obesity develops and when childhood obesity becomes persistent. This underscores the need to understand how longitudinal patterns of adiposity over time influence emerging cardiometabolic disease risk in childhood.
A few longitudinal studies have investigated BMI trajectories during childhood,13–15 and how it relates to CMR in pre-adolescence. 16 Although these studies have provided important insights into developmental trajectories of BMI during childhood, these studies have very limited socioeconomic, racial, and ethnic diversity in their samples. In fact, very few studies have available data to investigate long-term, longitudinal patterns of change in BMI during childhood and emerging CMR in pre-adolescence, in racially and ethnically diverse groups because they are often underrepresented in clinical trials and cohort studies.
Failure to include these diverse groups in trials and cohorts is likely to aggravate health disparities among those who are disproportionately burdened by health conditions and diseases. 17 There is a paucity of research examining how BMI trajectories during early and middle childhood influence emerging CMR factors in pre-adolescence among a sample of children living in predominantly low-income and racially and ethnically diverse households. These data can inform the development of interventions during critical periods of development to address childhood obesity and CMR disparities and promote health equity.
The objective of this study was to identify distinct BMI trajectories during childhood, 2–11 years of age, and to evaluate their associations with emerging biomarkers of CMR at 7–11 years of age. We hypothesized distinct BMI trajectory groups exist within our sample, and that children in the trajectory group characterized by higher BMI over time would have worse cardiometabolic profiles than children in the trajectory group characterized by lower BMI over time.
Methods
Study Design
Data for this study come from the NET-Works studies. The original NET-Works study was a 3-year, two-arm, randomized controlled trial designed to test the efficacy of a multilevel intervention program to prevent childhood obesity among children (2–7 years of age) and families living in low-income and racially and ethnically diverse households (N = 534) in Minneapolis, MN (2012–2017). A detailed description of the NET-Works study methods and main findings has been published elsewhere.18,19 NET-Works 2 was a follow-up longitudinal study that leveraged the existing cohort of children and families who were previously enrolled in the NET-Works trial.
Sixty-six months after the NET-Works baseline assessment, a subset of participants (N = 338 children, 7–11 years of age) took part in the NET-Works 2 study, which investigated early environmental stressors and emerging CMR in children. Data collection was completed in Fall 2020 for the NET-Works 2, with 97% of data collected before the COVID-19 pandemic and stay-at-home orders in MN (March 27, 2022) (Supplementary Fig. S1). Institutional Review Boards of the University of Minnesota and Health Partners Institute approved all study procedures, parents provided informed consent before starting data collection, and child assent was obtained (ClinicalTrials.gov Identifier: NCT01606891).
Measures
Exposure: Percent of the 95th Percentile of BMI from 2–11 Years of Age
BMI values were represented as a percentage above or below the 95th percentile of BMI [percent of the 95th percentile of BMI (%BMIp95)]. This measure is less susceptible to the compression of very high BMIs than BMI percentile or BMI z-scores, and has thus been recommended for tracking and evaluating change in BMI, in particular among children with high BMIs (Supplementary Table S1).20–22 To calculate child %BMIp95, weight and height data were measured at each time point following a standardized protocol. Weight was measured to the nearest 0.1 kg using a calibrated electronic scale and height was measured to the nearest 0.1 cm using a standing stadiometer (Seca Corp., Hanover, MD). Participants were measured wearing light clothing and no shoes. These measures were conducted in duplicates and averaged.
Outcomes: Cardiometabolic Measures at 7–11 Years of Age
Pulse wave velocity
Carotid-anterior tibial artery pulse wave velocity (PWV) was measured noninvasively using the SphygmoCor MM3 system (AtCor Medical, Sydney, Australia).23–25 Children rested quietly in a supine position for ∼10 minutes before measurement. A trained technician placed a tonometer over the participant's carotid and anterior tibial artery pulse points, and waveform measurements were recorded for ∼10 seconds each. Given that pulse wave transit time increases in stiffer arterial segments, higher values of PWV in meters per second (m/s) represent increased arterial stiffening.
Blood pressure measurements
Systolic blood pressure (SBP) and diastolic blood pressure (DBP) were assessed by a trained study nurse using a Welch Allyn ProBP 3400 automated blood pressure device (Welch Allyn, Skaneateles Falls, NY) and following standardized protocols to ensure appropriate cuff size for participants' arm circumference. Children sat quietly without legs crossed and resting blood pressure was measured three consecutive times. The final two readings were averaged. Blood pressure percentiles for age, sex, and height were calculated using normative tables published in the 2017 American Academy of Pediatrics (AAP) clinical practice guideline. 26
Metabolic parameters and biomarkers of inflammation and oxidative stress
A fasting (≥8 hours) blood sample was collected from venipuncture by a trained pediatric phlebotomist for the measurement of lipids [total- and low-density lipoprotein (LDL), high-density lipoprotein (HDL)-cholesterol, and triglycerides], glucose, insulin, and hemoglobin A1c (HbA1C), assayed by the Fairview Diagnostics Laboratories (Fairview-University Medical Center, Minneapolis, MN). Fasting serum samples of C-reactive protein (CRP), leptin, adiponectin, and oxidized low-density lipoprotein (oxLDL) were evaluated from the same blood draw. Samples were stored at −80°C for batch analysis at the University of Minnesota Cytokines Laboratory using enzyme-linked immunosorbent assay (ELISA) and multiplex methods.
CMR score
Following previous research 27 and metrics recommended by the AAP to guide pediatricians to targeted interventions for children at the highest risk for cardiometabolic disease, 28 we created a composite measure of CMR based on elevated levels using four continuous components: SBP or DBP, triglyceride/HDL ratio, HbA1C or fasting glucose, and CRP. BMI was not included in this risk score because it is already included in the BMI trajectories. First, we dichotomized each measure based on their clinical risk (i.e., SBP ≥95th percentile, triglyceride/HDL ratio ≥3, HbA1C ≥ 5.7, and CRP ≥3). 29 Then, we summed these parameters to create an overall CMR score (range 0: optimal cardiometabolic health and 4: clustered cardiometabolic dysregulation), with higher scores indicating higher CMR.
Analysis
We applied a group-based trajectory modeling (GBTM) 30 approach with a censored normal distribution to identify child %BMIp95 trajectory groups from 2 to 11 years of age (n = 338). GBTM is a specialized application of finite mixture modeling and is intended to provide a flexible approach for identifying distinctive clusters of individuals following similar developmental trajectories within a given population. 30 To identify the best-fitting trajectories, we used the Bayesian information criterion, number of participants in each trajectory, average posterior probability, and the shapes of trajectories (Supplementary Tables S2 and S3). 30 There was minimal missing data for the %BMIp95 measure across follow-up (range: 0.5%–3% missing).
The associations between the child BMI trajectory groups and the biomarkers of CMR were examined using multivariable linear regressions. All outcomes were visually inspected to assess linear regression model assumptions and data points were inspected for biological plausibility.
The skewed distributions of CRP, leptin, triglycerides, and fasting insulin were log-transformed. Selected covariates (66-month follow-up) were adjusted in the regression models for their potential confounding roles, including child sex, pubertal stage, household indicators of socioeconomic status (annual household income, parent educational attainment), baseline-reported birth weight, and self-reported race and ethnicity, to reflect how the social constructions of race might affect children's BMI and emerging CMR. Regression models also included treatment group assignment (intervention and control) as a covariate. We did not include mean arterial pressure (MAP), calculated as MAP = DBP + [1/3 × (SBP − DBP)], as a covariate because we hypothesized it to be on the causal pathway between BMI trajectories and PWV. Results were not corrected for multiple testing. 31
Results
%BMIp95 Trajectories and Sample Characteristics
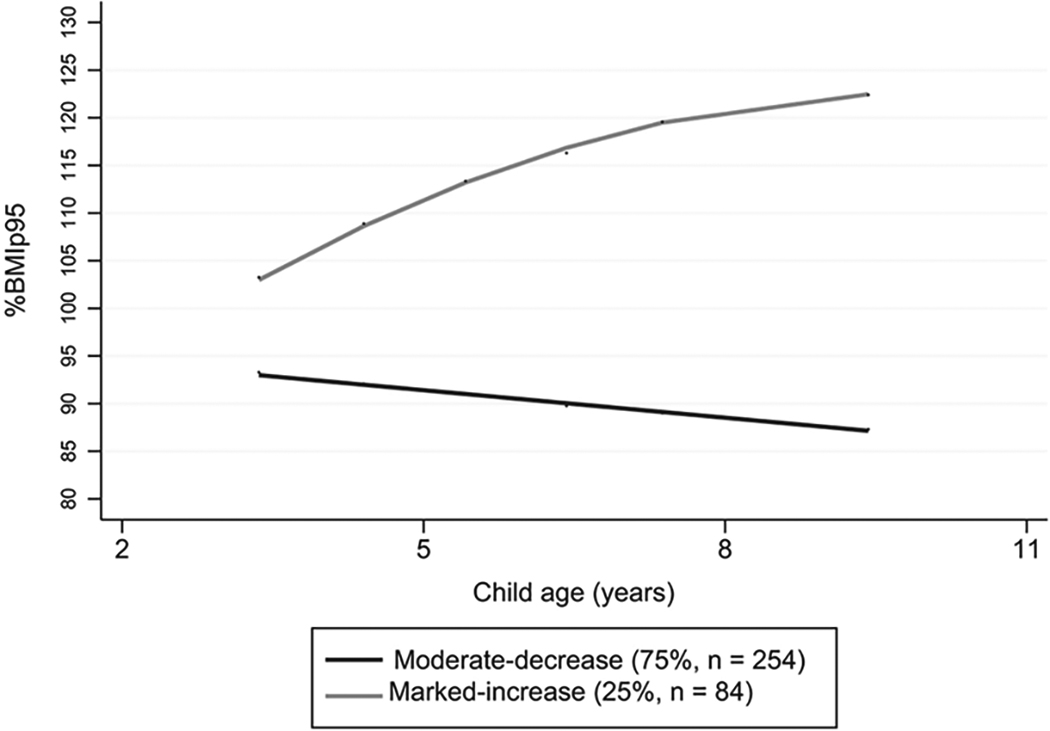
Two distinct trajectory groups above and below the 95% percentile of BMI were identified from 2 to 11 years of age among children participating in the NET-Works studies (Fig. 1). These two trajectories were named “moderate decrease” (75%, n = 254), and “marked increase” (25%, n = 84) to reflect children's BMI evolution over time. The moderate-decrease trajectory represents children whose %BMIp95 was <100%BMIp95 at 2–4 years of age and decreased over time. The marked-increase trajectory represents children whose %BMIp95 was higher or equal to 100%BMIp95 at 2–4 years of age and increased over time, reaching 120% or more of the 95th percentile of BMI at 7–11 years of age.
We observed a higher %BMIp95 among the marked-increase trajectory group relative to the moderate-decrease trajectory group across follow-up (Table 1). Overall, children across the two trajectory groups had similar ages and pubertal status, and were similar in predominantly living in racially and ethnically diverse and low-income households, with the primary caregiver reporting low levels of educational attainment.
Columns may not add up to 100% because of missing values.
%BMIp95, percent of the 95th percentile of BMI; CMR, cardiometabolic risk; CRP, C-reactive protein; DBP, diastolic blood pressure; HbA1C, hemoglobin A1C; HDL, high-density lipoprotein; LDL, low-density lipoprotein; MAP, mean arterial pressure; oxLDL, oxidized low-density lipoprotein; PWV, carotid-anterior tibial artery pulse wave velocity; SBP, systolic blood pressure; SD, standard deviation.
Associations Between %BMIp95 Trajectories and Biomarkers of CMR
Table 2 shows the unadjusted and adjusted mean differences in CMR measures at 7–11 years of age by %BMIp95 trajectory groups. After adjustment for covariates, children in the marked-increase relative to the moderate-decrease trajectory had higher adjusted mean differences for CRP [3.3 mg/L; 95% confidence interval (CI): 1.6 to 5.0], leptin (63.1 ng/mL; 95% CI: 44.3 to 81.8), triglycerides (35.4 mg/dL; 95% CI: 22.1 to 48.6), triglyceride/HDL ratio (1.2; 95% CI: 0.8 to 1.6), HbA1C (0.1 mg/dL; 95% CI: 0.03 to 0.2), fasting glucose (1.8; 95% CI: 0.1 to 3.5) and insulin (8.7 μU/mL; 95% CI: 1.1 to 6.5), SBP (9.2 percentile; 95% CI: 3.7 to 14.8), DBP (7.6 percentile; 95% CI: 2.7 to 12.5), and lower adiponectin (−1.3 μg/mL; 95% CI:, −2.5 to −0.1) and HDL cholesterol (−10.8 mg/dL; 95% CI: −14.3 to −7.4). Differences in the remaining biomarkers, including PWV by trajectory groups, were small and not statistically significant.
Unadjusted and Adjusted Mean Differences in Cardiometabolic Risk Measures at 7–11 Years of Age by Trajectories of Percent of the 95th Percentile of BMI from 2–11 Years of Age
%BMIp95, percent of the 95th percentile of BMI; CMR, cardiome-tabolic risk; CRP, C-reactive protein; DBP, diastolic blood pressure; HbA1C, hemoglobin A1C; HDL, high-density lipoprotein; LDL, lowdensity lipoprotein; MAP, mean arterial pressure; oxLDL, oxidized low-density lipoprotein; PWV, carotid-anterior tibial artery pulse wave velocity; SBP, systolic blood pressure; SD, standard deviation.
Associations Between %BMIp95 Trajectories and CMR Score
After adjustment for covariates, children in the marked-increase relative to the moderate-decrease trajectory had higher adjusted mean differences for CMR score (0.7; 95% CI: 0.5 to 0.9) (Table 2).
Discussion
In a cohort of children living in low-income and racially and ethnically diverse households, GBTM revealed that children with higher %BMIp95 at early ages followed a trajectory of increasing BMI over time, whereas children with lower %BMIp95 at early ages followed a trajectory of decreasing BMI over time. Moreover, relative to children in the moderate-decrease %BMIp95 trajectory during early and middle childhood, children with an increasing trajectory had a more unfavorable cardiometabolic and inflammatory biomarker profile at 7–11 years of age, as indicated by higher CRP, leptin, triglycerides, triglyceride/HDL ratio, HbA1C, fasting glucose and insulin, SBP, DBP, and CMR score, and lower adiponectin and HDL-cholesterol levels. We did not find evidence for greater arterial stiffness among children with an increased %BMIp95 trajectory.
Our study showed that children with high BMI as early as 2–4 years of age were likely to maintain an accelerated weight trajectory throughout childhood. Consistent with our findings, several studies assessing BMI trajectories during childhood showed a distinct cluster of children following an ascending BMI trajectory pattern over time.32–35 However, unlike our study, the proportion of children following a trajectory of increased BMI over time was very small in these studies. This discrepancy with our findings is likely due to two main reasons. First, our study included a sample of children who are disproportionately affected by obesity, that is, children from racially and ethnically minoritized groups and who are living in socioeconomically disadvantaged households.6,36 Second, a large proportion of children was already living with overweight (25%) or obesity (21%) at baseline because of the original NET-Works study BMI entry criteria (i.e., BMI ≥50th percentile). 19
Findings from this study also showed that cumulative exposure to elevated BMI over the course of childhood was strongly associated with biomarkers of CMR and a composite CMR score in pre-adolescence. Our findings are consistent with a descriptive longitudinal cohort study of Mexican American children, demonstrating that trajectories of increasing BMI at 2–7.5 years of age showed elevated CMR at 7.5 years of age. 35 A longitudinal study that investigated BMI trajectories during childhood also demonstrated a higher CMR score for children living with overweight and obesity over the course of their childhood years. 16 Previous cross-sectional studies have also shown higher levels of biomarkers of CMR among children living with obesity relative to children with lower weight status.37,38
Other studies that examined single time-point measures of adiposity during childhood also showed associations with future cardiovascular disease risk 39 and cardiometabolic outcomes in adulthood. 40 These past studies were limited to single time-point BMI assessments in childhood and therefore, the longitudinal burden of high BMI from early childhood to other life-course stages has been inadequately described in low-income and racial and ethnic minoritized populations.41,42 The results from this study extend these studies because the repeated measurements of BMI during childhood were predictive of emerging CMR in pre-adolescence.
We did not find evidence of arterial stiffness in relation to BMI trajectories in our sample. These findings are in contrast to a recent study that reported associations between persistently high BMI z-score trajectory and greater arterial stiffness, measured by PWV and carotid artery intima-media thickness in older children (11–12 years of age). 16 Of note, our sample included children as young as 7 years of age at the 66-month follow-up, which might be too early to detect these associations. The findings from this study related to PWV also differ from studies indicating that obesity and severe obesity during childhood are associated with arterial stiffness and future cardiac events.43,44 Although it is unclear why our PWV findings differ from the aforementioned studies, some past studies have also shown a lack of association between high BMI and markers of arterial stiffness or vascular function. 45
It has been hypothesized that the lower indicators of arterial stiffness or vascular function among children living with obesity or severe obesity relative to children with lower weight status might be due to a hemodynamic adaptation of the physiological structure and function of conduit arteries to high adiposity. 46 However, future studies are needed to elucidate the potential hemodynamic factors in mediating changes in arterial stiffness, when such changes start to occur (e.g., later vs. earlier in adolescence), and the influence of pubertal status on the stiffening of arteries, 47 given that age-related changes in arterial structure and function over the life course may increase arterial stiffness and the risk for cardiovascular events later in life. 48
Our results suggest that routine monitoring of BMI trajectories beginning in early childhood is clinically meaningful because it can help identify children at high risk for the development of CMR factors early and provide opportunities for discussing with their families potential intervention avenues. For example, intensive, family-based behavioral intervention approaches have been recommended as the first-line treatment for reducing accelerated weight gain in children with CMR factors, with no evidence of harm. 49
Clinicians need to consider structural barriers, such as a families' exposure to structural racism and discrimination, low socioeconomic status, and environmental factors (i.e., access to healthy food options and safe green spaces for physical activity), and use culturally appropriate and nonstigmatizing approaches in intervention delivery.50–52 Findings from our study demonstrate that the childhood years, as early as 2–4 years of age, may provide a potential window of opportunity for multilevel prevention and treatment efforts designed to mitigate accelerated weight gain before adverse cardiometabolic changes manifest.
Strengths and Limitations
Strengths of this study include a longitudinal cohort of children from 2 to 11 years of age living in low-income and racially and ethnically diverse households, with rigorous follow-up over 5 years and the use of objective measures. This study also has limitations. First, the application of the GBTM to a relatively small sample size precluded the evaluation of associations between more than two trajectory groups on emerging CMR in children, and trajectories stratified by indicators of socioeconomic status and race and ethnicity. Future studies with larger sample sizes and with a racially and ethnically diverse sample of children and adolescents are needed to confirm our findings, explore whether a trajectory of accelerated weight gain is more likely in socioeconomically disadvantaged and racially and ethnically minoritized populations compared with more privileged groups, and investigate potentially different BMI trajectories among racial and ethnic groups and relationships with CMR.
Furthermore, additional research is needed to examine socioeconomic, environmental, and health behavior factors as potential determinants of these trajectories and emerging CMR in children, and the role these factors may play in the underlying mechanisms of observed associations. 53 Second, since biomarkers of CMR were evaluated at only one time point, our findings may reflect associations that emerge close to the time of the outcome assessment. Repeated measures are warranted for determining when to best intervene. Third, we had limited information on the child's and family's medical history that may impact emerging CMR in children.
Due to the low numbers reported of cardiometabolic conditions, such as diabetes, heart attack, and stroke, among the participating biological parents, we were unable to assess the impact of these factors on the children's CMR. Future studies should explore these variables for their potential to affect children's CMR. Finally, BMI metrics have the limitation of not differentiating muscle and adipose tissue or fat distribution. 54 Moreover, body fat may vary by age, sex, race, and ethnicity. However, there is no consensus among researchers about specific BMI cut points for different racial and ethnic groups as the evidence supporting these lower BMI cutoffs is scarce, particularly among children and adolescents.55–57 When feasible, researchers should include more precise measures of adipose tissue [e.g., dual-energy X-ray absorptiometry (DXA)]. 58
Conclusions
Results indicated that a trajectory of increased BMI from early to middle childhood was associated with a more unfavorable biomarker profile in pre-adolescence in a cohort of children living in low-income and racially and ethnically diverse households. Findings suggest that early multilevel intervention efforts may aid in the prevention of emerging cardiometabolic disease risk as children age.
Impact Statement
Longitudinal BMI trajectories from early to middle childhood were associated with emerging cardiometabolic risk in pre-adolescence in a cohort of children living in low-income and racially and ethnically diverse households. Results suggest the importance of early intervention efforts to support healthy weight trajectories and reduce emerging CMR.
Footnotes
Acknowledgment
Portions of this article have been previously deposited on ProQuest as a dissertation. The dissertation is available at https://www.proquest.com/openview/54818ee5ae571fe394a4bd154c76f44a/1?pq-origsite=gscholar&cbl=18750&diss=y
Authors' Contributions
J.N.d.B.: conceptualization, methodology, visualization, formal analysis, writing—original draft, and writing—review and editing. M.A.P.: conceptualization, methodology, supervision, and writing—review and editing. A.S.K.: conceptualization, methodology, and writing—review and editing. D.J.E.: methodology and supervision. N.E.S.: funding acquisition and writing—review and editing. S.M.M.: writing—review and editing. K.A.L.: writing—review and editing. S.F.: funding acquisition, writing—review and editing. N.G.E.: writing—review and editing. D.R.D.: writing—review and editing. A.K.-B.: conceptualization, methodology, funding acquisition, supervision, and writing—review and editing.
Funding Information
This work was supported by the Eunice Kennedy Shriver National Institute of Child Health and Human Development of the National Institutes of Health under award numbers U01HD068990 [principal investigators (PIs): S.F., N.E.S.] and R01HD090059 (PI: A.K.-B.). Research reported in this publication was supported by the Eunice Kennedy Shriver National Institute of Child Health & Human Development of the National Institutes of Health under Award Number K12HD055887 (J.N.d.B.). The funders had no role in the design and conduct of the study; collection, management, analysis, and interpretation of data; preparation, review, or approval of the article; and decision to submit the and for publication. The content is solely the responsibility of the authors and does not necessarily represent the official views of the National Institutes of Health.
Author Disclosure Statement
A.S.K. engages in unpaid consulting and educational activities for Novo Nordisk, Vivus, Eli Lilly, and Boehringer Ingelheim, as well as receives donated drug/placebo from Vivus for an NIDDK-funded clinical trial. The remaining authors have no conflicts of interest to disclose.
References
Supplementary Material
Please find the following supplemental material available below.
For Open Access articles published under a Creative Commons License, all supplemental material carries the same license as the article it is associated with.
For non-Open Access articles published, all supplemental material carries a non-exclusive license, and permission requests for re-use of supplemental material or any part of supplemental material shall be sent directly to the copyright owner as specified in the copyright notice associated with the article.