
Abstract
Background:
The role of neighborhood factors in the association between adverse childhood experiences (ACEs) and body mass index (BMI) has not been widely studied. A neighborhood ACEs index (NAI) captures neighborhood environment factors associated with ACE exposure. This study examined associations between BMI and an NAI among New York City (NYC) youth. An exploratory objective examined the NAI geographic distribution across NYC neighborhoods.
Methods:
Data for students attending NYC public general education schools in kindergarten-12th grade from 2006–2017 (n = 1,753,867) were linked to 25 geospatial datasets capturing neighborhood characteristics for every census tract in NYC. Multivariable hierarchical linear regression tested associations between BMI and the NAI; analyses also were conducted by young (<8 years), school age (8–12 years), and adolescent (>12 years) subgroups. In addition, NAI was mapped by census tract, and local Moran’s I identified clusters of high and low NAI neighborhoods.
Results:
Higher BMI was associated with higher NAI across all sex and age groups, with largest magnitude of associations for girls (medium NAI vs. low NAI: unstandardized β = 0.112 (SE 0.008), standardized β [effect size] = 0.097, p < 0.001; high NAI vs. low NAI: unstandardized β = 0.195 (SE 0.008), standardized β = 0.178, p < 0.001) and adolescents (medium NAI vs. low NAI: unstandardized β = 0.189 (SE 0.014), standardized β = 0.161, p < 0.001, high NAI vs. low NAI: unstandardized β = 0.364 (SE 0.015), standardized β = 0.334, p < 0.001 for adolescent girls; medium NAI vs. low NAI: unstandardized β = 0.122 (SE 0.014), standardized β = 0.095, p < 0.001, high NAI vs. low NAI: unstandardized β = 0.217 (SE 0.015), standardized β = 0.187, p < 0.001 for adolescent boys). Each borough of NYC included clusters of neighborhoods with higher and lower NAI exposure, although clusters varied in size and patterns of geographic dispersion across boroughs.
Conclusions:
A spatial index capturing neighborhood environment factors associated with ACE exposure is associated with higher BMI among NYC youth. Findings complement prior literature about relationships between neighborhood environment and obesity risk, existing research documenting ACE-obesity associations, and the potential for neighborhood factors to be a source of adversity. Collectively, evidence suggests that trauma-informed place-based obesity reduction efforts merit further exploration as potential means to interrupt ACE-obesity associations.
Introduction
Adverse childhood experiences’ (ACEs) association with elevated body mass index (BMI) has been studied much less frequently than specific health behaviors such as dietary choices and physical activity. Experiences commonly considered ACEs include sexual, physical, or emotional abuse, physical and emotional neglect, parental separation, domestic violence against a caregiver, and a household member’s alcohol or substance use disorder or mental illness1,2 occurring before the age of 18 years. Neighborhood-level and social exposures, such as witnessing violent crime or experiencing racism, also are considered ACEs. While estimates vary by population, research suggest that most (60%−62%) of the Americans experience at least one ACE, with populations affected by health inequities experiencing higher rates of ACE exposure.2–7
Numerous studies have documented that ACEs are associated with higher BMI and obesity during youth and adulthood.4,8–32 The relationship is believed to arise from physiological, neuroendocrine, behavioral, and psychosocial sequelae secondary to ACEs’ chronic or severe stress that persists lifelong. For example, ACE-associated stress can contribute to hypothalamic pituitary access dysregulation, changes in insulin and hunger hormone levels, and immunometabolic changes that lead to higher BMI.14–17 Mental health conditions associated with ACE exposure, including depression and binge eating disorder, are well-established risk factors for obesity.8,11–13 ACE-associated stress may also contribute to unhealthy coping behaviors, such as eating highly palatable, calorically-dense comfort foods.8–10 Household dysfunction associated with ACEs may detract from establishing family routines and behaviors associated with maintaining a healthy weight. 8 Collectively, these sequelae of ACEs may synergize with one another to contribute to associations with higher BMI.
Extensive prior work demonstrates that neighborhood factors are also associated with pediatric and adult obesity.33–45 For example, neighborhood characteristics, such as lack of green space, lower walkability, poverty, and limited healthy food access, have been shown to be associated with higher BMI.33–45 A rich history of research has studied the association of neighborhood environment with weight status and has developed and tested multilevel, place-based interventions and policies to support a healthy weight.46–48
Individuals who experience high ACEs are more likely to live in neighborhoods with more obesogenic characteristics, such as less green space and worse access to healthy food. 49 A recent study demonstrated that controlling for a key obesity-related neighborhood factor (i.e., green space) decreases the magnitude of the point estimate and removes the statistical significance of the association between ACEs and obesity. 50 Collectively, this work suggests a need for novel research that examines the relationships between neighborhood factors associated with ACEs and BMI. The logic pathway connecting ACEs, neighborhood, and higher BMI is shown in Figure 1. Work illuminating these pathways can guide development and evaluation of trauma-informed place-based obesity reduction efforts; such efforts would aim to reduce obesity in a manner sensitive to the needs of people and communities affected by trauma, while being tailored for a particular community’s context, history, strengths, and needs.
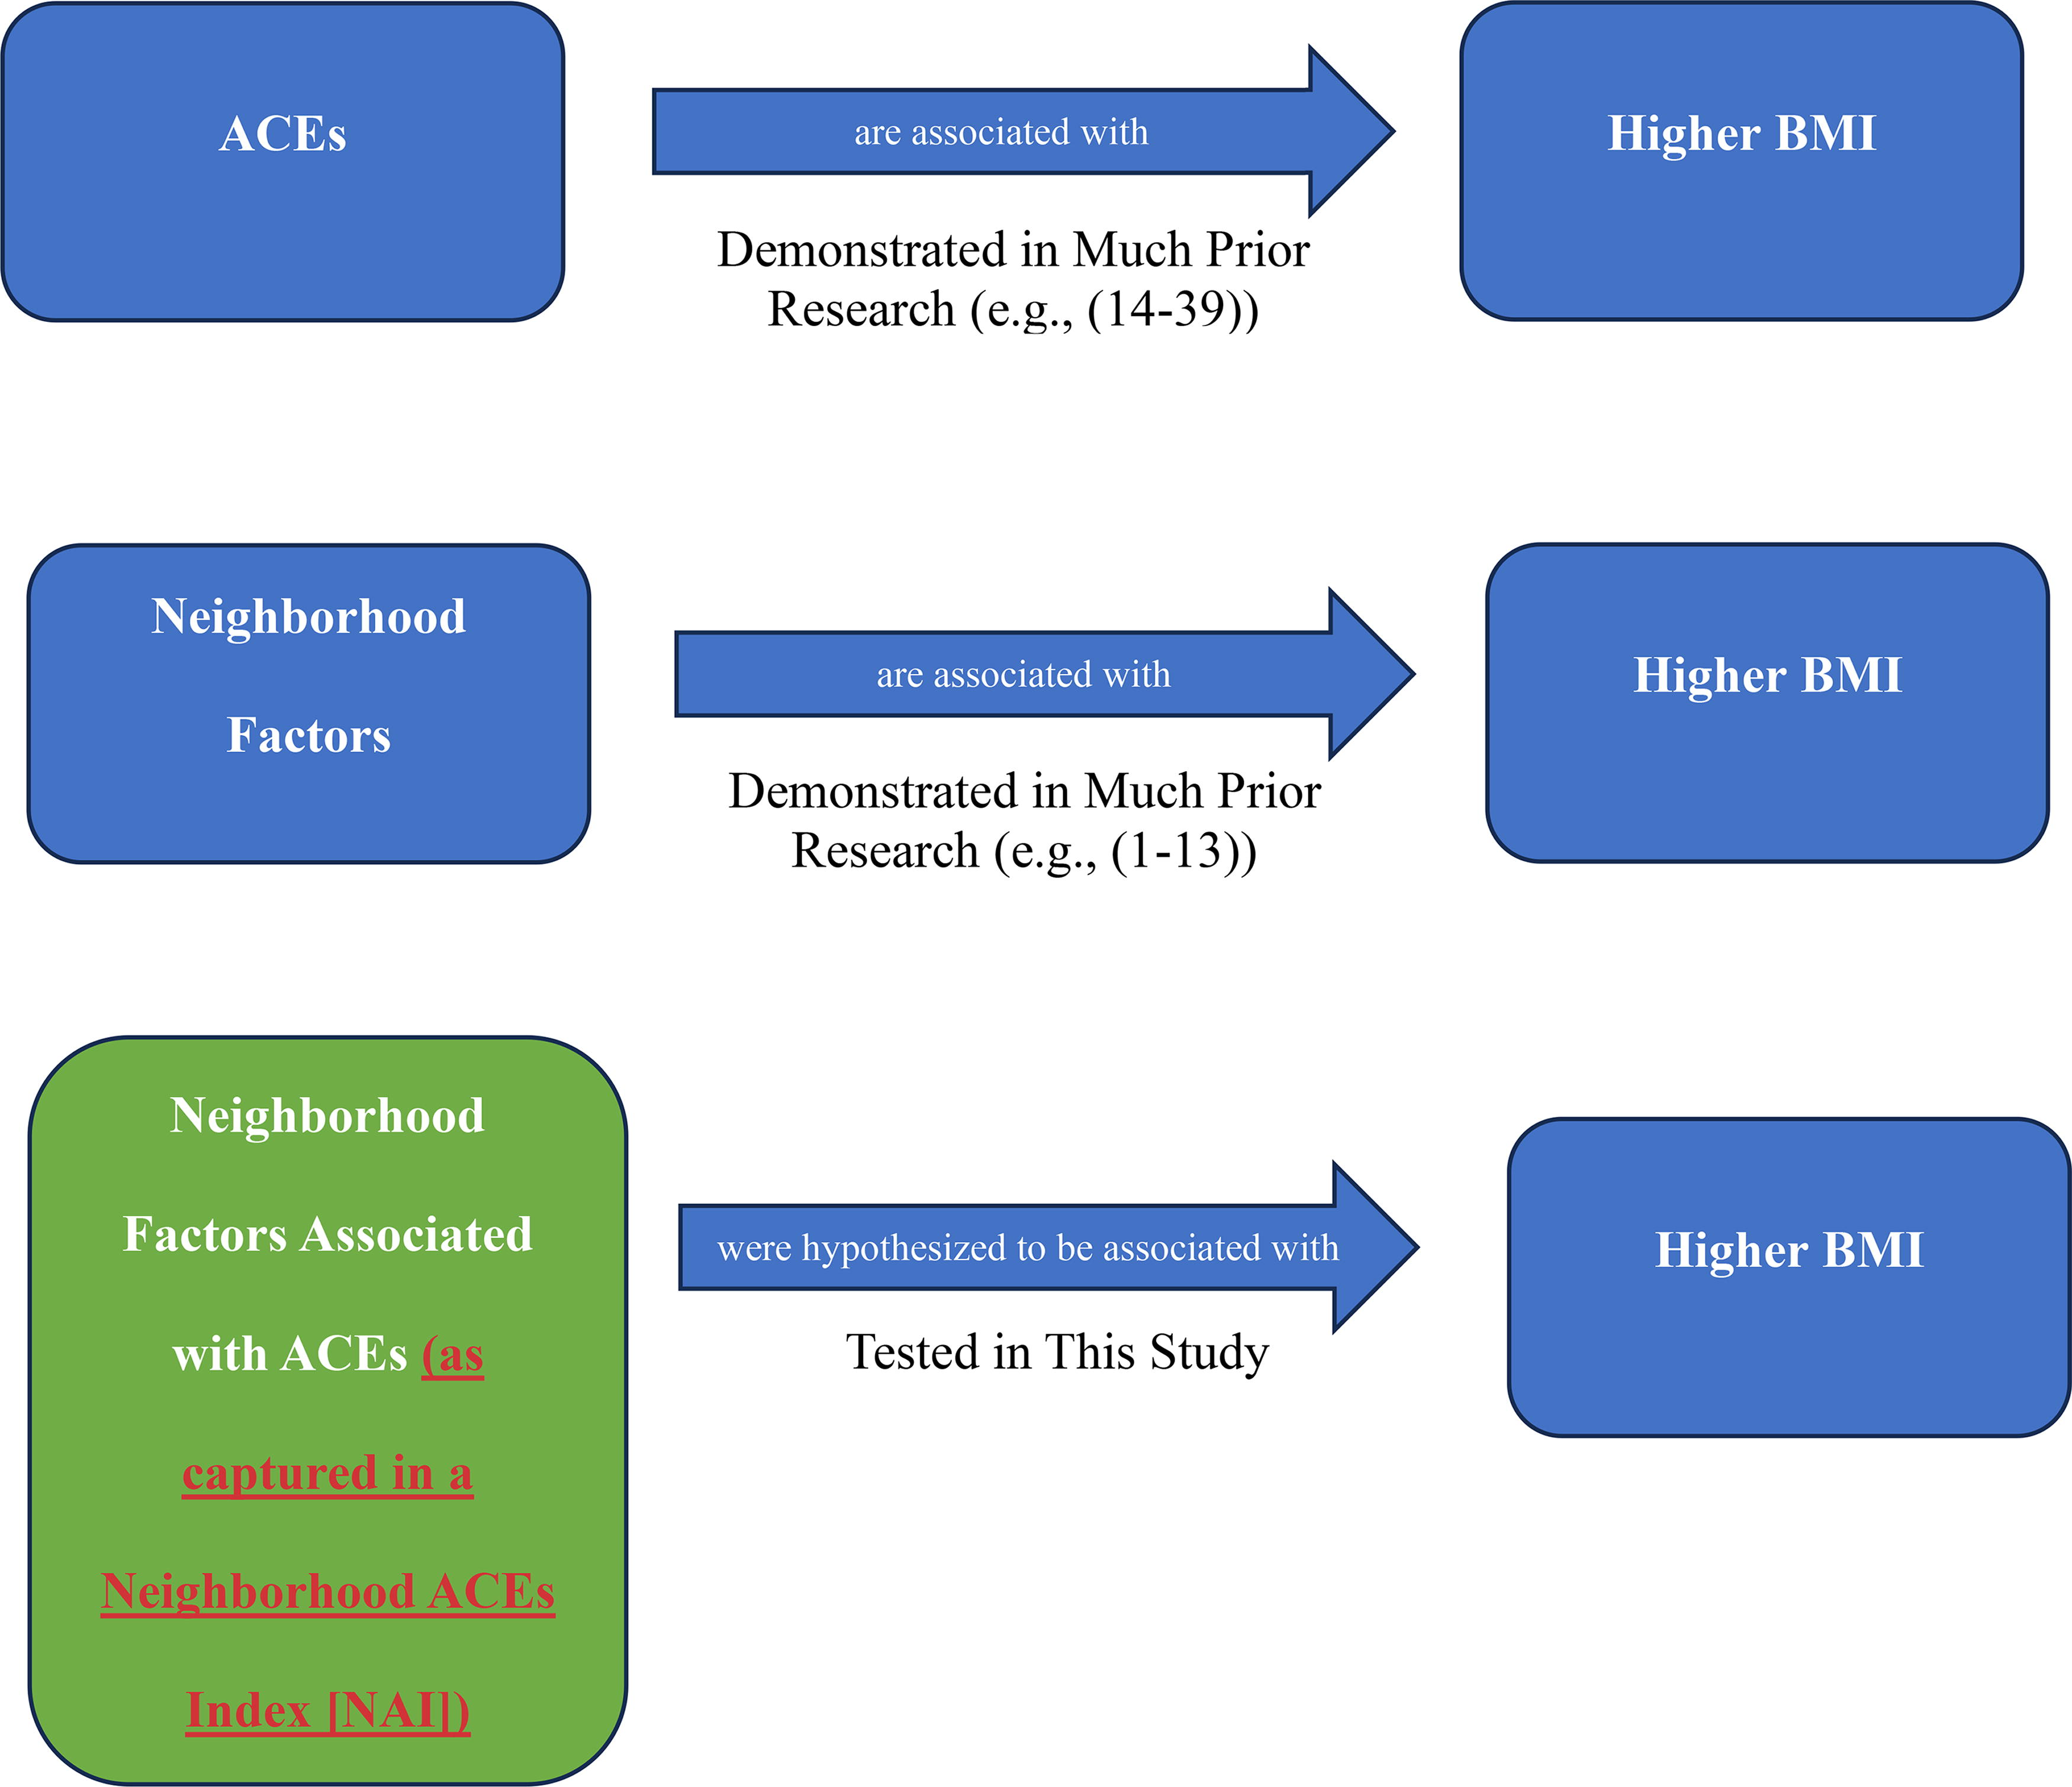
Visualization of association between adverse childhood experiences (ACEs), neighborhood, and elevated body mass index (BMI).
To better understand how neighborhood factors are associated with ACEs, recent research validated geospatial analytic methods for creating a Neighborhood ACEs Index (NAI). 51 An NAI is a geospatial index that answers the question “what is the neighborhood environment of individuals with high ACEs exposure?” It serves as a single-item individual-level proxy for collective neighborhood exposures associated with high (≥4)14,50 ACE burden. 51 This geospatial index approach aligns with the understanding of neighborhoods as complex environments composed of multiple collinear and synergistic characteristics associated with ACEs that could be relevant to obesity risk. An NAI is similar to a neighborhood deprivation index, but instead of capturing neighborhood environment characteristics associated with deprivation, it captures neighborhood environment characteristics associated with high ACE burden. An individual with a higher NAI score lives in a neighborhood with more neighborhood factors associated with ACE exposure. Using geocoding and geospatial methods, NAI creation methods were validated by connecting individual-level ACE data with rich geospatial data that included numerous neighborhood factors such as crime, poverty, food environment, alcohol access, and health care access. 51 Prior cross-sectional work found that an NAI provides new information for understanding ACE-obesity associations 51 in Philadelphia adults. An NAI’s association with BMI has not yet been tested among youth.
Collectively, prior work suggests a need to better understand associations between ACEs, neighborhood factors, and BMI. The NAI presents a new tool for doing so, as it captures neighborhood factors associated with experiencing high ACEs. Thus, the primary objective of this study was to examine if and how BMI associated with an NAI was associated among youth living in New York City (NYC). A higher BMI was hypothesized to be associated with living in a neighborhood with a higher NAI (e.g., more neighborhood factors associated with ACEs). An exploratory objective was to examine the geographic distribution of the NAI across NYC and to identify if and where clusters of higher or lower NAI-related risk existed.
Methods
Study Design, Setting, and Participants
The study design was a secondary analysis. The sample included all students attending NYC public general education schools in grades kindergarten through 12 who had BMI and home address measures during 2006–2017. Public general education schools include NYC schools excluding charter schools, schools in which the entire population has special education needs, and continuing education schools that serve primarily adults. Rigorous BMI validation processes and home addresses’ geocoding and imputation are described elsewhere and have demonstrated that the majority of students (94%) have valid data for these measures.52,53 The study received Institutional Review Board approval.
Variables and Data Sources
The outcome of interest was BMI, which was obtained for each student using NYC Fitnessgram data. The NYC Fitnessgram program entails annual collection of height and weight of all children attending NYC public schools in grades kindergarten through 12 by trained physical education teachers.52–54 BMI was calculated based upon height and weight as per CDC standards, 55 with biologically implausible values excluded that used a rigorously developed process described elsewhere. 53
The exposure of interest was the NAI. As detailed above, an NAI is a single-item individual-level proxy for collective neighborhood exposures associated with high ACE burden. Prior research validated NAI creation methods by testing several different approaches; Bayesian index regression was demonstrated to be the best approach. 51 Bayesian index regression is a method for variable selection that includes a weighted index of correlated component scores as quantiles; it has recently been used to illuminate the effects of neighborhood with other health-related exposures and has shown promise as a more effective method for working with correlated data than traditional methods such as Principal Component Analysis.51,56–65 Bayesian index regression is well-suited to capture numerous collinear and synergistic neighborhood characteristics (e.g., high crime often co-occurs with high poverty which often co-occurs with worse healthy food access and so on). Index development with Bayesian index regression results in a weight for each included neighborhood variable (including near zero weight for variables that prove irrelevant). Weights are applied to individual-level data to create a single NAI score for each participant. In Bayesian index regression, weights are constrained to sum to 1 and be between 0 and 1, thus reducing dimensionality and collinearity.
NAI creation for NYC included 25 geospatial variables demonstrated to be relevant to ACE-obesity association for every census tract in NYC using 2010 census tract boundaries. 51 Geospatial variables included measures related to neighborhood demographic makeup and socioeconomic resource access, healthy and unhealthy food and alcohol availability, health care access, health status, crime, transit environment, and outdoor environmental quality. Variable selection was based on prior NAI validation 51 and driven by prior research and theory about what neighborhood characteristics would be relevant to ACEs and obesity. See Table 1 for neighborhood geospatial variables, including each variable’s data source. Data were sourced for time period closest to 2006–2017 data midpoint (e.g., 2011/2012). For data in which that exact year was not available, the closest available year was chosen. In this study, NAI was operationalized as a high/medium/low, with the bottom one-third of NAI scores considered low NAI, middle one-third of NAI scores considered medium NAI, and the top one-third of NAI scores considered high NAI. This operationalization was chosen because no a priori threshold for high vs. low NAI exists and a one unit change in NAI was not felt to be theoretically meaningful (whereas a relative ranking of NAIs was). Furthermore, categorized a neighborhood-level index by quantiles has precedent for other indexes, such as the widely used neighborhood deprivation index. 66 Sensitivity analyses were executed using NAI as a continuous variable. Census tract was used as a proxy for neighborhood. (Census tracts are small, relatively permanent statistical subdivisions of a county that include an average of 4,000 residents). 67 An NAI was assigned to each youth for each year that they were in the data, based on the youth’s address in that year of the data.52,53
Operationalization and Data Source for Neighborhood Variables Included in Neighborhood Adverse Childhood Experiences Index
Data sourced through PolicyMap geospatial data and analytics platform.89
Covariates for multivariable hierarchical linear models included age and race/ethnicity, collected from NYC school records. Age was operationalized as a continuous variable in years at the time of BMI measurement. Sex was operationalized as binary (male, female) as per data constraints. Race/ethnicity was operationalized as nominal (Asian/Pacific Islander, non-Hispanic Black, Hispanic, Native American or Alaskan Indian, non-Hispanic White, other/unknown) as per data constraints. Academic year was also included in the model as an ordinal variable.
Analyses
Descriptive statistics was used to describe the study sample. As repeated measurements of students were nested within academic year, hierarchical linear regression was used to test cross-sectional associations between BMI (outcome) and the NAI (exposure). Specifically, a hierarchical approach was used to account for the repeated measures nature of the data (e.g., time [level I] is clustered within student [level II]), including autoregressive covariance structure. Primary models were run stratified by sex to account for sex as a biological variable. Hypothesis-generating models repeated primary models stratified by sex and developmental stage subgroup (young boys [<8 years], school age boys [8–12 years], adolescent boys [>12 years], and so forth for girls). Standardized betas were calculated as measures of effect size.
In addition, NAI was mapped by census tract, and local Moran’s I using Queen contiguity was used to identify clusters of high NAI and low NAI neighborhoods (e.g., census tracts) across NYC. Clusters of neighborhoods can be conceptualized as geographic groupings that exist in contrast to geospatial randomness. Put more simply, clusters are statistically significant groups of neighboring census tracts where NAIs are mostly high (high-high clusters), mostly low (low-low clusters), or juxtaposed (high-low or low-high clusters). Cluster identification denotes geographic regions (e.g., groups of neighborhoods) that may be best or least suited for intervention and policy implementation. More specifically and relevant to this study, high-high clusters represent groups of neighborhoods in which NAIs are highest and thus may be best suited for trauma-informed place-based obesity interventions, whereas low-low clusters represent groups in which NAIs are lowest and thus may benefit least from trauma-informed place-based obesity interventions.
Descriptive statistics and regression analyses were conducted using R 4.2.3 computing environment. 68 Local Moran’s I was conducted using GeoDa. 69 Mapping of the NAI and Moran’s I results was done using ESRI ArcGIS Pro. 70 Statistical significance for all analyses was assessed at the p < 0.001 level. For Moran’s I, 99,999 Monte Carlo replications were executed in order to ensure robustness of results.
Results
Sample Demographics
The sample included the n = 1,753,867 youth who attended NYC schools during 2006–2017. Mean age was 11.38 ± 1.78 years, and 859,803 (49.02%) were male and 894,064 (50.98%) were female. Regarding race/ethnicity, 690,736 (39.38%) were Hispanic, 475,180 (27.09%) were Black/African American, 291,482 (16.62%) were Asian/Pacific Islander, 271,622 (15.49%) were White, 123,220 (0.70%) were Native American/Alaskan Indian, and 12,525 (0.01%) were other or unknown race. Mean BMI was 20.38 ± 1.88 kg/m2, and 616,537 (35.15%) met criteria for overweight (BMI percentile ≥85%) and 325,149 (18.54%) met criteria for obesity (BMI percentile ≥95%). BMI by sex, age, and race/ethnicity subgroup is detailed in Supplementary Table S1, and demographic characteristics by NAI tertile are presented in Supplementary Table S2.
Analyses
Statistically significant associations between BMI and the NAI were found (Table 2). For girls, living in a medium NAI and high NAI neighborhood was associated with a higher BMI of β = 0.112 ± 0.008 and β = 0.195 ± 0.008, respectively (p < 0.001). For boys, living in a medium NAI and high NAI neighborhood was associated with a higher BMI of β = 0.085 ± 0.007 and β = 0.118 ± 0.008, respectively (p < 0.001). Hypothesis-generating analyses by sex and age subgroups demonstrated that magnitude of associations was larger with increasing youth age. More specifically, associations were larger for school age than young youth and larger for adolescent youth than school age youth. Associations were larger for girls than boys across all age subgroups. Adolescent girls were the subgroup with the largest association (Table 2). Collectively, results of sensitivity analyses in which NAI was operationalized as a continuous variable were similar to that of the analyses in which it was operationalized categorically (Supplementary Table S3). Demographic characteristics for high, medium, and low NAI neighborhoods are detailed in Supplementary Table S2.
Associations between Neighborhood Adverse Childhood Experiences Index (NAI) Tertiles and Body Mass Index among New York City Youth (n = 1,753,867)
Local Moran’s I identified statistically significant clusters of neighborhoods with higher and lower NAI across NYC (Fig. 2). Each borough included clusters, although clusters differed in size and demonstrated variation in patterns of geographic dispersion across boroughs. The high-high clusters indicate groups of neighborhoods potentially best suited for trauma-informed place-based obesity intervention and policy implementation. While visual inspection of the mapped clusters is intended to be hypothesis generating, potential insights were gleaned based upon a review of data summarizing NYC neighborhood characteristics.1–3,6,9 For example, it is notable that high NAI neighborhoods generally are more densely populated areas, with lower household incomes, higher crime rates, and racial/ethnic disparities in exposure to economic stress and residential inequality. In contrast, neighborhoods with lower NAI generally have low violent crime rates and higher income; in Staten Island, Queens, and Bronx, the neighborhoods have higher car ownership and lower population density than the neighborhoods in those boroughs areas with higher NAI.
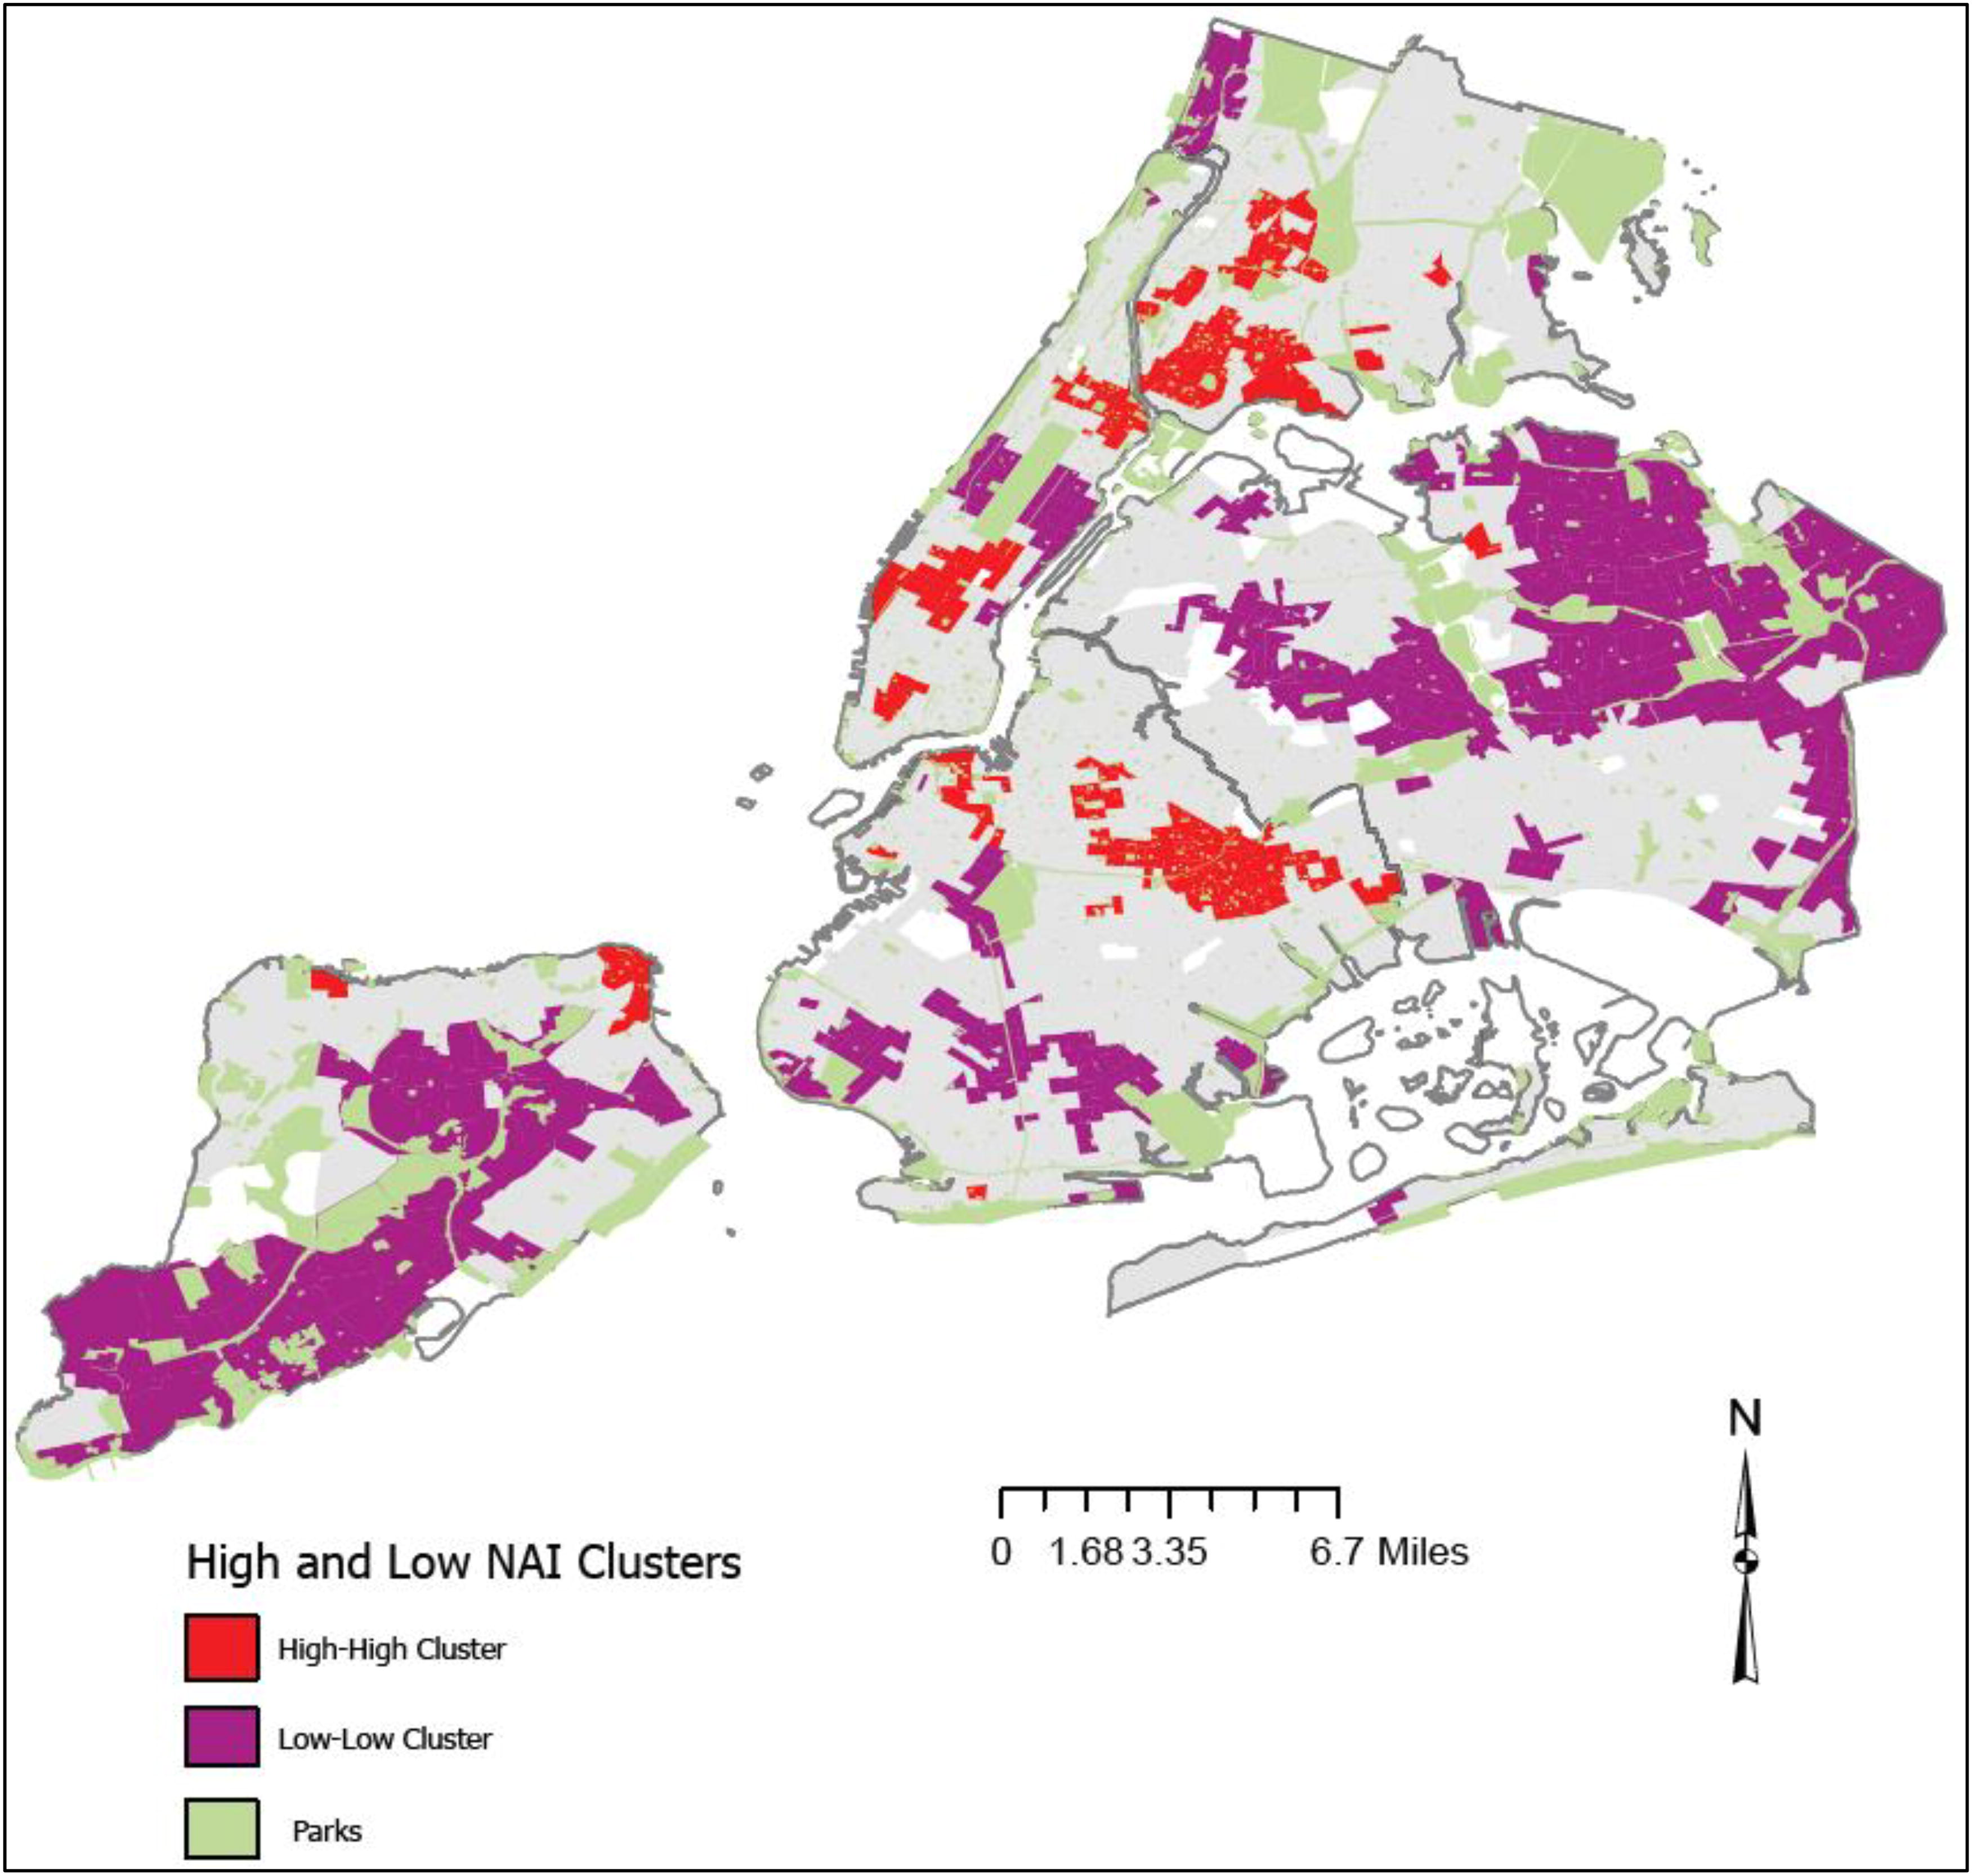
Clusters of high and low Neighborhood ACEs Index (NAI) Scores, by census tract, across New York City, per local Moran’s I testa. aAs with many cities, NYC neighborhood naming conventions are not firmly established; however census tracts demonstrated that highest NAI (e.g., neighborhoods with most factors associated with ACEs) can be considered to be located in West Brighton, St. George, Stapleton/Rosebank, and Mariner’s Harbor/Graniteville, Staten Island; Flushing, Queens; Mott Haven, Hunt’s Point, Fordham, and Van Nest/Morris Park, Bronx; Central/East Harlem, Midtown, and SoHo/Tribeca Manhattan; and Northern Brooklyn, Coney Island, Ocean Hill, Brownsville, Bed Stuy, and Bedford, Brooklyn. Census tracts with lowest NAI are seen in neighborhoods such as Great Kills, Todt Hill, Tottenville, and Annadale, Staten Island; Bensonhurst, Bay Ridge, Dyker Heights, and Canarsie/Mill Basin, Brooklyn; Forest Hills, Rego Park, Bayside, Queens Village, Flushing Heights, and Whitestone, Queens; Riverdale and Kingsbridge, Bronx; and Upper East Side, Lenox Hill, Yorkville, Lincoln Square, and Murray Hill/Kips Bay, Manhattan.
Discussion
Study analyses using 11 years of data from a large, racially diverse sample of youth found that an NAI is positively associated with higher BMI among youth. Youth who lived in neighborhoods with the highest NAI had a higher BMI. Associations were larger for girls compared to boys and for adolescents compared to young and school age youth, suggesting that those populations might be most susceptible to neighborhood-related aspects of ACE-obesity associations.
While the change in BMI associated with an NAI was small, it is consistent with the magnitude of other neighborhood-level exposures, as well as that of ACEs. For example, prior meta-analyses have found that factors such as low neighborhood safety are associated with 0.02 higher BMI, 2 low neighborhood socioeconomic status with a 1.09 higher BMI, 39 and higher neighborhood air traffic pollution with 0.05 higher BMI, 71 whereas neighborhood grocery store access, 72 fast food access, 73 and neighborhood green space 74 have null associations with BMI (albeit they do have associations with overweight/obesity or obesity-related behaviors). Neighborhood-level exposures—despite their small magnitude—can be relevant at the population level given their broad reach. In addition, prior reviews of ACEs’ association with BMI during childhood demonstrate similarly modest associations. 30
Findings are consistent with prior research suggesting that adolescence is a critical period for interrupting ACE-obesity associations—especially for girls. While reasons are not firmly established, girls are thought to be more sensitive to trauma exposure for a complex interaction of factors, including having higher rates of anxious and depressive disorders, hormonal differences, unique social stressors associated with female gender socialization, and high rates of exposure to uniquely traumatic types of traumas (e.g., sexual abuse).31,75–77 Adolescence is a developmental phase during which girls are especially susceptible to trauma exposure.75–77 Adult women who experienced childhood trauma begin to develop obesity in adolescence. 31 Furthermore, the association of ACEs with obesity can take several years to manifest, making later adolescence (vs. early childhood) a period of greater ACE-associated obesity risk. 30 Understanding ACE-BMI associations during adolescence is particularly important, as adolescence is a critical period for prevention of adult obesity.10,19–25
This study complements prior literature about the relationship between neighborhood environment and obesity risk, ACE-obesity associations, and the potential for neighborhood factors to be a source of adversity and trauma. Collectively, all suggest that trauma-informed place-based obesity interventions and policies might be a promising way to interrupt ACE-obesity associations and merit further exploration. The map identifying clusters of high NAI suggests geographies in which such interventions might be best suited to be tested in one particular city (NYC). The specific mechanisms of trauma-informed place-based obesity interventions are not yet known, because trauma-informed obesity interventions have been called for but are not yet widely used.21,78 However, the field can build from rich literature on trauma-informed care and trauma-informed communities79–84 and combine that with best practices for pediatric healthy weight management.85,86 Trauma-informed care is often considered to have six tenants—safety, trustworthiness and transparency, peer support, collaboration and mutuality, empowerment and choice, and attention to cultural, historical, and gender issues; 87 it is possible to imagine how each could be applied to pediatric obesity care. Table 3 provides the authors’ suggestions for strategies for obesity reduction efforts that would align with each tenant of trauma-informed care, including strategies that consider the role of neighborhood environment in a youth’s experience, based on existing guidance for implementing trauma-informed practices (e.g., references80,82,88,89). The suggestions are meant to generate hypotheses and ideas that can be implemented in future trauma-informed place-based interventions and policies. However, given the early state of this evidence, future efforts would require careful development and efficacy testing before being considered “trauma-informed.” The potential to apply trauma-informed approaches to the physically built environment at the neighborhood level (e.g., creating “trauma-informed neighborhoods”86,87) might be relevant to population-level pediatric obesity rates as well, but this has not yet been explored.
When targeting healthy weight interventions to youth who have experienced trauma or neighborhoods with higher NAIs, it is critical that such efforts be strength based, community driven, and minimize stigma.79–84 Any interventions should be developed collaboratively in partnership with the people affected, with the voices of youth and families affected by obesity, and trauma centered and healing focused.79–84 Furthermore, such efforts must be carefully constructed to avoid perpetuating (and actively work to eradicate) stigma associated with obesity and ACEs.79–84 All trauma-informed place-based interventions and policies should be strength based; youth, families, and neighborhoods affected by trauma have many strengths and resilience-fostering factors, and a focus only on challenges or deficits is not appropriate. A strength-based approach can avoid promoting a deficit perspective for both the affected youth and the stakeholders who are implementing the interventions. 84
While there is a robust body of prior research on the neighborhood-obesity association,33–45 the ACE-obesity association, and how neighborhoods can be relevant to experiences of trauma, research on ACE-obesity-neighborhood associations is lacking. Future research should examine these associations in samples that can build upon existing work in Philadelphia adults49–51 and NYC youth, in order to illuminate how these associations manifest in diverse geographies, cultures, and populations. Studies that examine these associations in using more recent data would be needed as well, particularly given thoughts that the COVID-19 pandemic may have served as a collective trauma.88 Work that uses repeated measures data to tease apart whether NAI-BMI associations are cumulative over time would be informative as well, particularly when identifying key windows in which to intervene to reduce obesity among communities affected by trauma. Furthermore, while this study was a secondary analysis focused purely on neighborhood factors, future research can incorporate other aspects of these associations, such as how family factors play a part in neighborhood-ACE-BMI associations, tease apart roles of timing, or identify potential mediators or moderators. An additional future step to build from this study would be to examine which neighborhood variables from the NAI have the strongest association with youth BMI, in order to develop targeted interventions; such work would complement prior NAI development work which identified which neighborhood variables have the strongest association with ACEs 51 and could be used to explore, develop, and test trauma-informed multilevel obesity interventions. This would be best coupled by qualitative studies that examine the lived experience of youth, families, and communities that have experienced ACEs and obesity. Finally, studies that examine associations between obesity-related health outcomes (e.g., hypertension, cardiovascular health) and an NAI would further add to the evidence base in this area.
This study has limitations, including that it is a secondary analysis of data not collected for research purposes and that findings might not be generalizable to geographies that differ from NYC. Data are from 2006 to 2017 and thus do not reflect most recent (e.g., postpandemic) years which may have changed results, particularly given that the pandemic has been considered a collective trauma.88 BMI was the only health endpoint examined, and its association with NAI was examined cross-sectionally. In addition, any trivial group difference may be found significant (p < 0.001) with this study’s large sample size; the statistical significance noted may not be an indication of real-world meaningfulness. Furthermore, variability in BMI increases with age, and thus, the demonstrated difference across age groups could be artifacts of how BMI is related to age and sex. Finally, while our address data were updated annually, duration of time at each address (at a level more granular than year) is not known. These weaknesses are mitigated by strengths, including a robust sample, 11 years of data, use of a rigorously developed NAI, and objectively measured BMI.
Conclusions
This study is, to our knowledge, the first to examine the association between neighborhood factors associated with ACEs (captured in an NAI) and BMI among youth. A better understanding of these associations can inform future exploration of trauma-informed place-based efforts to reduce obesity. Such efforts would directly align with recent calls for trauma-informed obesity interventions and policies, 78 as well as build from extensive prior work on multilevel place-based approaches to a healthy weight. While pediatric obesity research has a long history of considering neighborhood factors, efforts to reduce obesity have not widely explored the intersecting role of neighborhood environment and ACEs. Greater attention is needed in order to help support a healthy body weight among youth affected by ACEs.
Impact Statement
Neighborhood characteristics associated with adverse childhood experiences (ACEs) can be captured using a “neighborhood ACEs index.” A neighborhood ACEs index was associated with higher BMI among NYC youth (n = 1,753,867), with strongest associations among adolescents and girls. The role of neighborhood-level factors into ACE-obesity associations merits further exploration.
Footnotes
Authors’ Contributions
K.S.: Conceptualization, methodology, analysis, writing—original draft, and funding acquisition; L.D.: Methodology and writing—review and editing; S.D.: Conceptualization, data curation, and writing—review and editing; K.K.: Conceptualization and writing—review and editing; J.G.N.: Conceptualization, writing—review and editing, and funding acquisition; K.A.H.: Methodology and writing—review and editing; S.S.: Conceptualization and writing—review and editing; D.C.W.: Methodology and writing—review and editing; K.A.: Data curation and writing—review and editing; D.B.S.: Conceptualization and writing—review and editing.
Funding Information
This research was supported by the
Author Disclosure Statement
The authors declare no conflicts of interest.
References
Supplementary Material
Please find the following supplemental material available below.
For Open Access articles published under a Creative Commons License, all supplemental material carries the same license as the article it is associated with.
For non-Open Access articles published, all supplemental material carries a non-exclusive license, and permission requests for re-use of supplemental material or any part of supplemental material shall be sent directly to the copyright owner as specified in the copyright notice associated with the article.