




Abstract
Background:
We examined the independent and joint prospective associations of screen time, sleep disturbance, and sleep duration with body mass index (BMI) and waist circumference (WC) stratified by sex.
Methods:
Data are from 7445 participants (47.3% females) aged 9–10 years at baseline (2016–2018) in the Adolescent Brain Cognitive Development Study. Missing data were imputed, and weighted multivariable linear regression models estimated the independent and joint effects of screen time and sleep disturbance or sleep duration on BMI and WC after 2 years. Joint associations grouped participants by combinations of screen time and sleep, with low screen time and sufficient sleep or no sleep disturbance as the reference groups.
Results:
Screen time was significantly associated with higher BMI (B = 0.32; 95% CI: 0.19, 0.45; p < 0.001) and WC (B = 0.40; 95% CI: 0.23, 0.56; p < 0.001). Sleep disturbance was associated with higher BMI (B = 1.23; 95% CI: 0.14, 2.33; p 0.026) in males. Insufficient sleep (<9 hours) (B = 1.30; 95% CI: 0.53, 2.07; p < 0.001) was associated with higher BMI. Medium screen time without sleep disturbance or insufficient sleep, and medium and high screen time with either sleep problem were associated with higher BMI and WC. Low screen time with insufficient sleep and high screen time with sufficient sleep were associated with higher BMI. Associations were generally stronger among males, particularly with high screen time.
Conclusion:
Screen time and insufficient sleep were independently and jointly associated with higher BMI and WC 2 years later, especially when both were present.
Introduction
Obesity affects one in five U.S. youth and is associated with adult chronic diseases, including cardiovascular disease, diabetes, and cancer.1,2 Approximately 18% of adolescents have abdominal obesity, defined as waist circumference (WC) percentile ≥90, which is associated with elevated blood pressure and abnormal lipid levels.3,4
Associations between screen time and measures of adiposity in adolescents are well-studied, yet findings remain inconsistent. Proposed mechanisms include reduced physical activity, high food intake, and insufficient sleep. 5 Evidence on the association between screen time and obesity is mixed; while some studies report significant associations with BMI,6–9 others find weak or null results.8,9
Fewer studies have examined screen time and abdominal obesity, and findings remain inconsistent.10–12 Some cross-sectional studies found significant associations between screen time and WC, 13 whereas a meta-analysis found no such association. 10 The discrepancies may be explained by differences in study design (cross-sectional versus longitudinal) and age groups of the participants.10,14
Associations between specific types of screen time and physical health indicators vary. Prolonged television viewing is associated with higher BMI, central obesity, and elevated blood pressure.15,16 Evidence on video game use is mixed: some studies report associations with poor sleep and increased obesity risk, while others suggest that active video games may support weight regulation and reduce anxiety and stress. 17
Sleep disturbance and short sleep duration are associated with obesity through behavioral, metabolic, and activity-related pathways. 18 Although many studies have examined associations with BMI, few have focused on WC. Findings on sleep and BMI are mixed.19–24 A dose-response meta-analysis of longitudinal studies reported a positive relationship between short sleep duration and obesity, particularly among children and adolescents aged 3–13 years. 25 Inconsistencies in findings may reflect differences in sleep assessment tools.19,26,27
Although most studies have focused on sleep duration, sleep disturbance has also been identified as a potential obesity risk factor.23,28 These two dimensions of sleep are closely interconnected, and it has been reported that sleep quality, including sleep disturbance, and sleep duration effects may interact, emphasizing the need to consider both. 29
The 24-hour movement behavior framework emphasizes examining screen time, sleep, and physical activity together, given their interrelated nature and mutual influence. 30 Prolonged screen time and insufficient sleep may contribute to obesity by promoting sedentary behavior and disrupting appetite regulation. 31 Sleep has frequently been proposed as a mediator in the association between screen time and obesity,32,33 although some studies, particularly those examining mental health outcomes, have questioned this role. 34 A study among European children aged 2–11 years suggested that screen time and poor sleep may mutually reinforce behaviors contributing to obesity, supporting the possibility that sleep acts as a moderator; however, WC was not assessed, indicating a gap in the literature. 35
To date, no studies have examined the joint associations of screen time and sleep disturbance, or screen time and sleep duration with BMI and WC among U.S. adolescents. Such studies are crucial for understanding how reducing screen time and improving adolescent sleep hygiene may contribute to lower BMI and WC. This study aims to address the gap by assessing the independent and joint prospective associations of screen time with sleep disturbance and duration in relation to BMI and WC in early adolescence, including potential sex differences.
Methods
Participants
We analyzed prospective data from 7445 adolescents in the longitudinal Adolescent Brain Cognitive Development (ABCD) Study. 36 To reduce response bias, the ABCD Study uses standardized protocols, validated tools, trained interviewers, and confidential data collection procedures (Supplementary Data S1). 37 The COVID-19 pandemic affected the collection of anthropometric measurements at year 2. Reducing the number of participants with complete measurements. For the current study, we included 7445 participants with complete data for screen time, sleep disturbance, and sleep duration at baseline, and BMI and WC at year 2 of follow-up (Supplementary Table S1 compares included and excluded participants).
Measures
Anthropometric measurements
Body weight and height were measured three times, and the average was used. BMI was calculated as body weight (kg) divided by height squared (m2). BMI percentiles were based on age- and sex-specific guidelines from the Centers for Disease Control and Prevention (CDC). 38 WC was measured twice, and the average was computed. We excluded implausible anthropometric data from baseline and year 2 based on established criteria: (1) BMI z-scores ≤−4 SDs or ≥8 SDs, (2) WC z-scores <−4 SDs or >4 SDs.39,40
Screen time
Participants completed the ABCD Youth Screen Time Survey at baseline (2016–2018), reporting the total time spent across all screen-based activities on a typical weekday and weekend day. Screen time was treated as a continuous variable, representing the weighted average in hours. Total recreational screen time was categorized using 4-hour intervals, based on studies linking ≥4 hours/day to obesity and poor mental health among adolescents.41–45 Screen time was grouped into three categories: 0–4 hours/day (low; reference), >4–8 hours/day (medium), and >8 hours/day (high). In addition, screen time was also categorized by type: TV shows/movies, video games, and socializing (texting, video chatting, and social media).
Sleep disturbance
At baseline, parents/caregivers completed the Sleep Disturbance Scale for Children (SDSC) to assess sleep problems in their adolescents over the preceding 6-month period. An overall score ranging from 26 to 130 points was calculated. Higher scores indicate an increased severity of sleep disturbance. Sleep disturbance was defined as a score ≥39. 46
Sleep duration
Adolescents’ sleep duration was estimated using the SDSC at baseline. We analyzed caregiver responses to the question, “How many hours of sleep does your child get on most nights in the past six months? Responses were grouped into five categories (9–11, 8–9, 7–8, 5–7, and <5 hours/day). Sleep duration was categorized into two groups: <9 hours/day (insufficient) and ≥9 hours/day (sufficient). 47 Further details on measurement procedures are provided in Supplementary Data S2.
Covariates
We adjusted for baseline sociodemographic variables, including age, sex (male, female), race and ethnicity (Asian, Black, Latino/Hispanic, Native American, White, and other), household income (USD: <$25,000, $25,000–$49,999, $50,000–$74,999, $75,000–$99,999, $100,000–$199,999, and ≥$200,000), and parental education (high school or less vs. college or above). Additional covariates included physical activity (number of days with ≥1 hour of physical activity in the preceding week), study site, baseline BMI and WC, and self-reported puberty status (prepubertal, early pubertal, mid-pubertal, late pubertal, and post-pubertal) (Supplementary Data S3).48,49
Statistical Analysis
Missing data were imputed using multiple imputation by chained equations (Supplementary Data S4). Baseline sex differences were examined, and weighted multivariable linear regression models estimated the independent and joint associations of screen time and sleep disturbance or sleep duration with BMI and WC at year 2.
Assumptions for multiple linear regression were tested for and all met. Statistical models adjusted for sociodemographic covariates and baseline BMI or WC (depending on the outcome). Sleep disturbance and sleep duration were analyzed in separate models due to multicollinearity concerns. Interaction terms between screen time and sleep disturbance or duration were tested and were nonsignificant. We also examined associations of screen time subtypes (TV/movies, video games, socializing) with BMI and WC, adjusting for confounders. Sensitivity analyses were conducted using complete-case data.
For joint associations of screen time and sleep disturbance with BMI and WC, participants were grouped into six categories (low screen time and no sleep disturbance/sufficient sleep (reference), low screen time and sleep disturbance/insufficient sleep, medium screen time and no sleep disturbance/sufficient sleep, medium screen time and sleep disturbance/insufficient sleep, high screen time and no sleep disturbance/sufficient sleep, high screen time and sleep disturbance/insufficient sleep). Similarly, the joint association of screen time and sleep duration model used low screen time and sufficient sleep as the reference category. Models were also stratified by sex. Data were analyzed using Stata 18 (College Station, TX). To account for complex survey design and potential nonresponse bias, we incorporated sampling weights derived from the American Community Survey, reflecting the study’s complex design (Supplementary Data S5).50,51 Statistical significance was set at p < 0.05.
Ethics
This study was approved by the University of California, San Diego review board (160091) (October 7, 2024) and by the relevant IRBs at each study site. Participants provided written assent, while their caregivers gave written informed consent.
Results
A total of 7445 participants (3511 females and 3934 males) aged 9–10 years at baseline (2016–2018) were included in this study. Compared with females, males were slightly older, reported more daily screen time, were more physically active, and had a lower BMI at year 2 (Table 1).
Sociodemographic Characteristics of Participants at Baseline in the Adolescent Brain Cognitive Development Study (n = 7,445)
Sampling weights were applied to yield estimates based on the American Community Survey from the U.S. Census.
BMI, body mass index; WC, waist circumference.
Bold data indicates p < 0.05.
Tables 2 and 3 show overall and sex-stratified associations of screen time, sleep disturbance, and sleep duration with BMI and WC. Screen time (continuous) was associated with higher BMI (B = 0.32; 95% CI: 0.19, 0.45) and WC (B = 0.40; 95% CI: 0.23, 0.56). The association with BMI was stronger in males (B = 0.47; 95% CI: 0.29, 0.64) than in females (B = 0.14; 95% CI: −0.05, 0.33). Screen time was also associated with higher WC in females (B = 0.26; 95% CI: 0.01, 0.52) and males (B = 0.50; 95% CI: 0.27, 0.73). Among males, sleep disturbance was associated with higher BMI (B = 1.23; 95% CI: 0.14, 2.33). Insufficient sleep was associated with higher BMI overall (B = 1.30; 95% CI: 0.53, 2.07), in females (B = 1.44; 95% CI: 0.34, 2.54), and in males (B = 1.16; 95% CI: 0.08, 2.24).
Associations of Screen Time, Sleep Disturbance, and Sleep Duration with Body Mass Index, Overall and Stratified by Sex
Outputs represent the abbreviated output for linear regression models with screen time, sleep disturbance, and sleep duration as the independent variables and BMI as the dependent variable.
Boldface indicates p < 0.05.
Covariates: age, race and ethnicity, sex, household income, parent education, study site, physical activity, baseline BMI, and pubertal status.
BMI, body mass index.
Associations Between Screen Time, Sleep Disturbance, and Sleep Duration with Waist Circumference (WC), Overall and Stratified by Sex
Outputs represent the abbreviated output for linear regression models with screen time, sleep disturbance, and sleep durations as the independent variables and WC as the dependent variable.
Boldface indicates p < 0.05.
Covariates: age, race/ethnicity, sex, household income, parent education, study site, physical activity, baseline WC, and pubertal status.
WC, waist circumference.
Figure 1 shows the joint associations of screen time and sleep disturbance with BMI. Compared with the reference group (low screen time and no sleep disturbance), those with medium screen time and no sleep disturbance (B = 1.72; 95% CI: 0.54, 2.91), medium screen time and sleep disturbance (B = 2.10; 95% CI: 0.45, 3.76), and high screen time and sleep disturbance (B = 3.47; 95% CI: 1.26, 5.69) had higher BMI. In sex-stratified analysis, females with medium screen time and no sleep disturbance had higher BMI (B = 2.42; 95% CI: 0.59, 4.25). Males with medium screen time and no sleep disturbance (B = 2.90; 95% CI: 0.49, 5.30), and high screen time with or without sleep disturbance (B = 2.95; 95% CI: 0.23, 5.67; B = 4.50; 95% CI: 1.70, 7.30, respectively), had the highest BMI.
Joint associations of screen time and sleep disturbance with BMI stratified by sex. Low screen time (0–4 hours per day) and no sleep disturbance were set as a reference group. The model was adjusted for age, race/ethnicity, household income, highest parent education, physical activity, study site, and baseline BMI. The overall model was additionally adjusted for sex. BMI, body mass index.
Figure 2 shows the joint associations with WC. Compared with participants with low screen time and no sleep disturbance, those with medium screen time and no sleep disturbance (B = 2.61; 95% CI: 1.04, 4.17), and medium screen time and sleep disturbance (B = 4.09; 95% CI: 2.10, 6.08), had higher WC. Among females, medium screen time and no sleep disturbance were associated with a higher WC (B = 2.72; 95% CI: 0.17, 5.13). Among males, medium screen time with or without sleep disturbance (B = 2.62; 95% CI: 0.55, 4.68; B = 5.50; 95% CI: 2.82, 8.19, respectively), and high screen time and sleep disturbance (B = 3.95; 95% CI: 0.16, 7.74) were associated with higher WC.
Joint associations of screen time and sleep disturbance with WC stratified by sex. Low screen time (0–4 hours per day) and no sleep disturbance were set as a reference group. The model was adjusted for age, race/ethnicity, household income, highest parent education, physical activity, study site, and baseline WC. The overall model was additionally adjusted for sex. WC, waist circumference.
Figure 3 shows the joint associations of screen time and sleep duration with BMI. Compared to participants with low screen time and sufficient sleep, those with low or medium screen time and insufficient sleep (B = 1.43; 95% CI: 0.40, 2.47; B = 3.05; 95% CI: 1.68, 4.42, respectively) had higher BMI. Participants with high screen time with or without insufficient sleep (B = 3.35; 95% CI: 0.52, 6.17; B = 2.88; 95% CI: 1.13, 4.64, respectively) also had higher BMI. In sex-stratified analysis, females with low and medium screen time and insufficient sleep (B = 2.05; 95% CI: 0.62, 3.48; B = 3.28; 95% CI: 1.30, 5.26, respectively), and those with high screen time and sufficient sleep (B = 3.88; 95% CI: 0.02, 7.75) had higher BMI. Males with medium or high screen time and insufficient sleep (B = 2.61; 95% CI: 0.73, 4.47; B = 4.21; 95% CI: 1.80, 6.61, respectively) also had high BMI.
Joint associations of screen time and sleep duration with BMI. Sufficient sleep ≥9 hours, insufficient sleep <9 hours. Low screen time (0–4 hours per day) and normal sleep were set as a reference group. The model was adjusted for age, race/ethnicity, household income, highest parent education, physical activity, study site, and baseline BMI. The overall model was additionally adjusted for sex. BMI, body mass index.
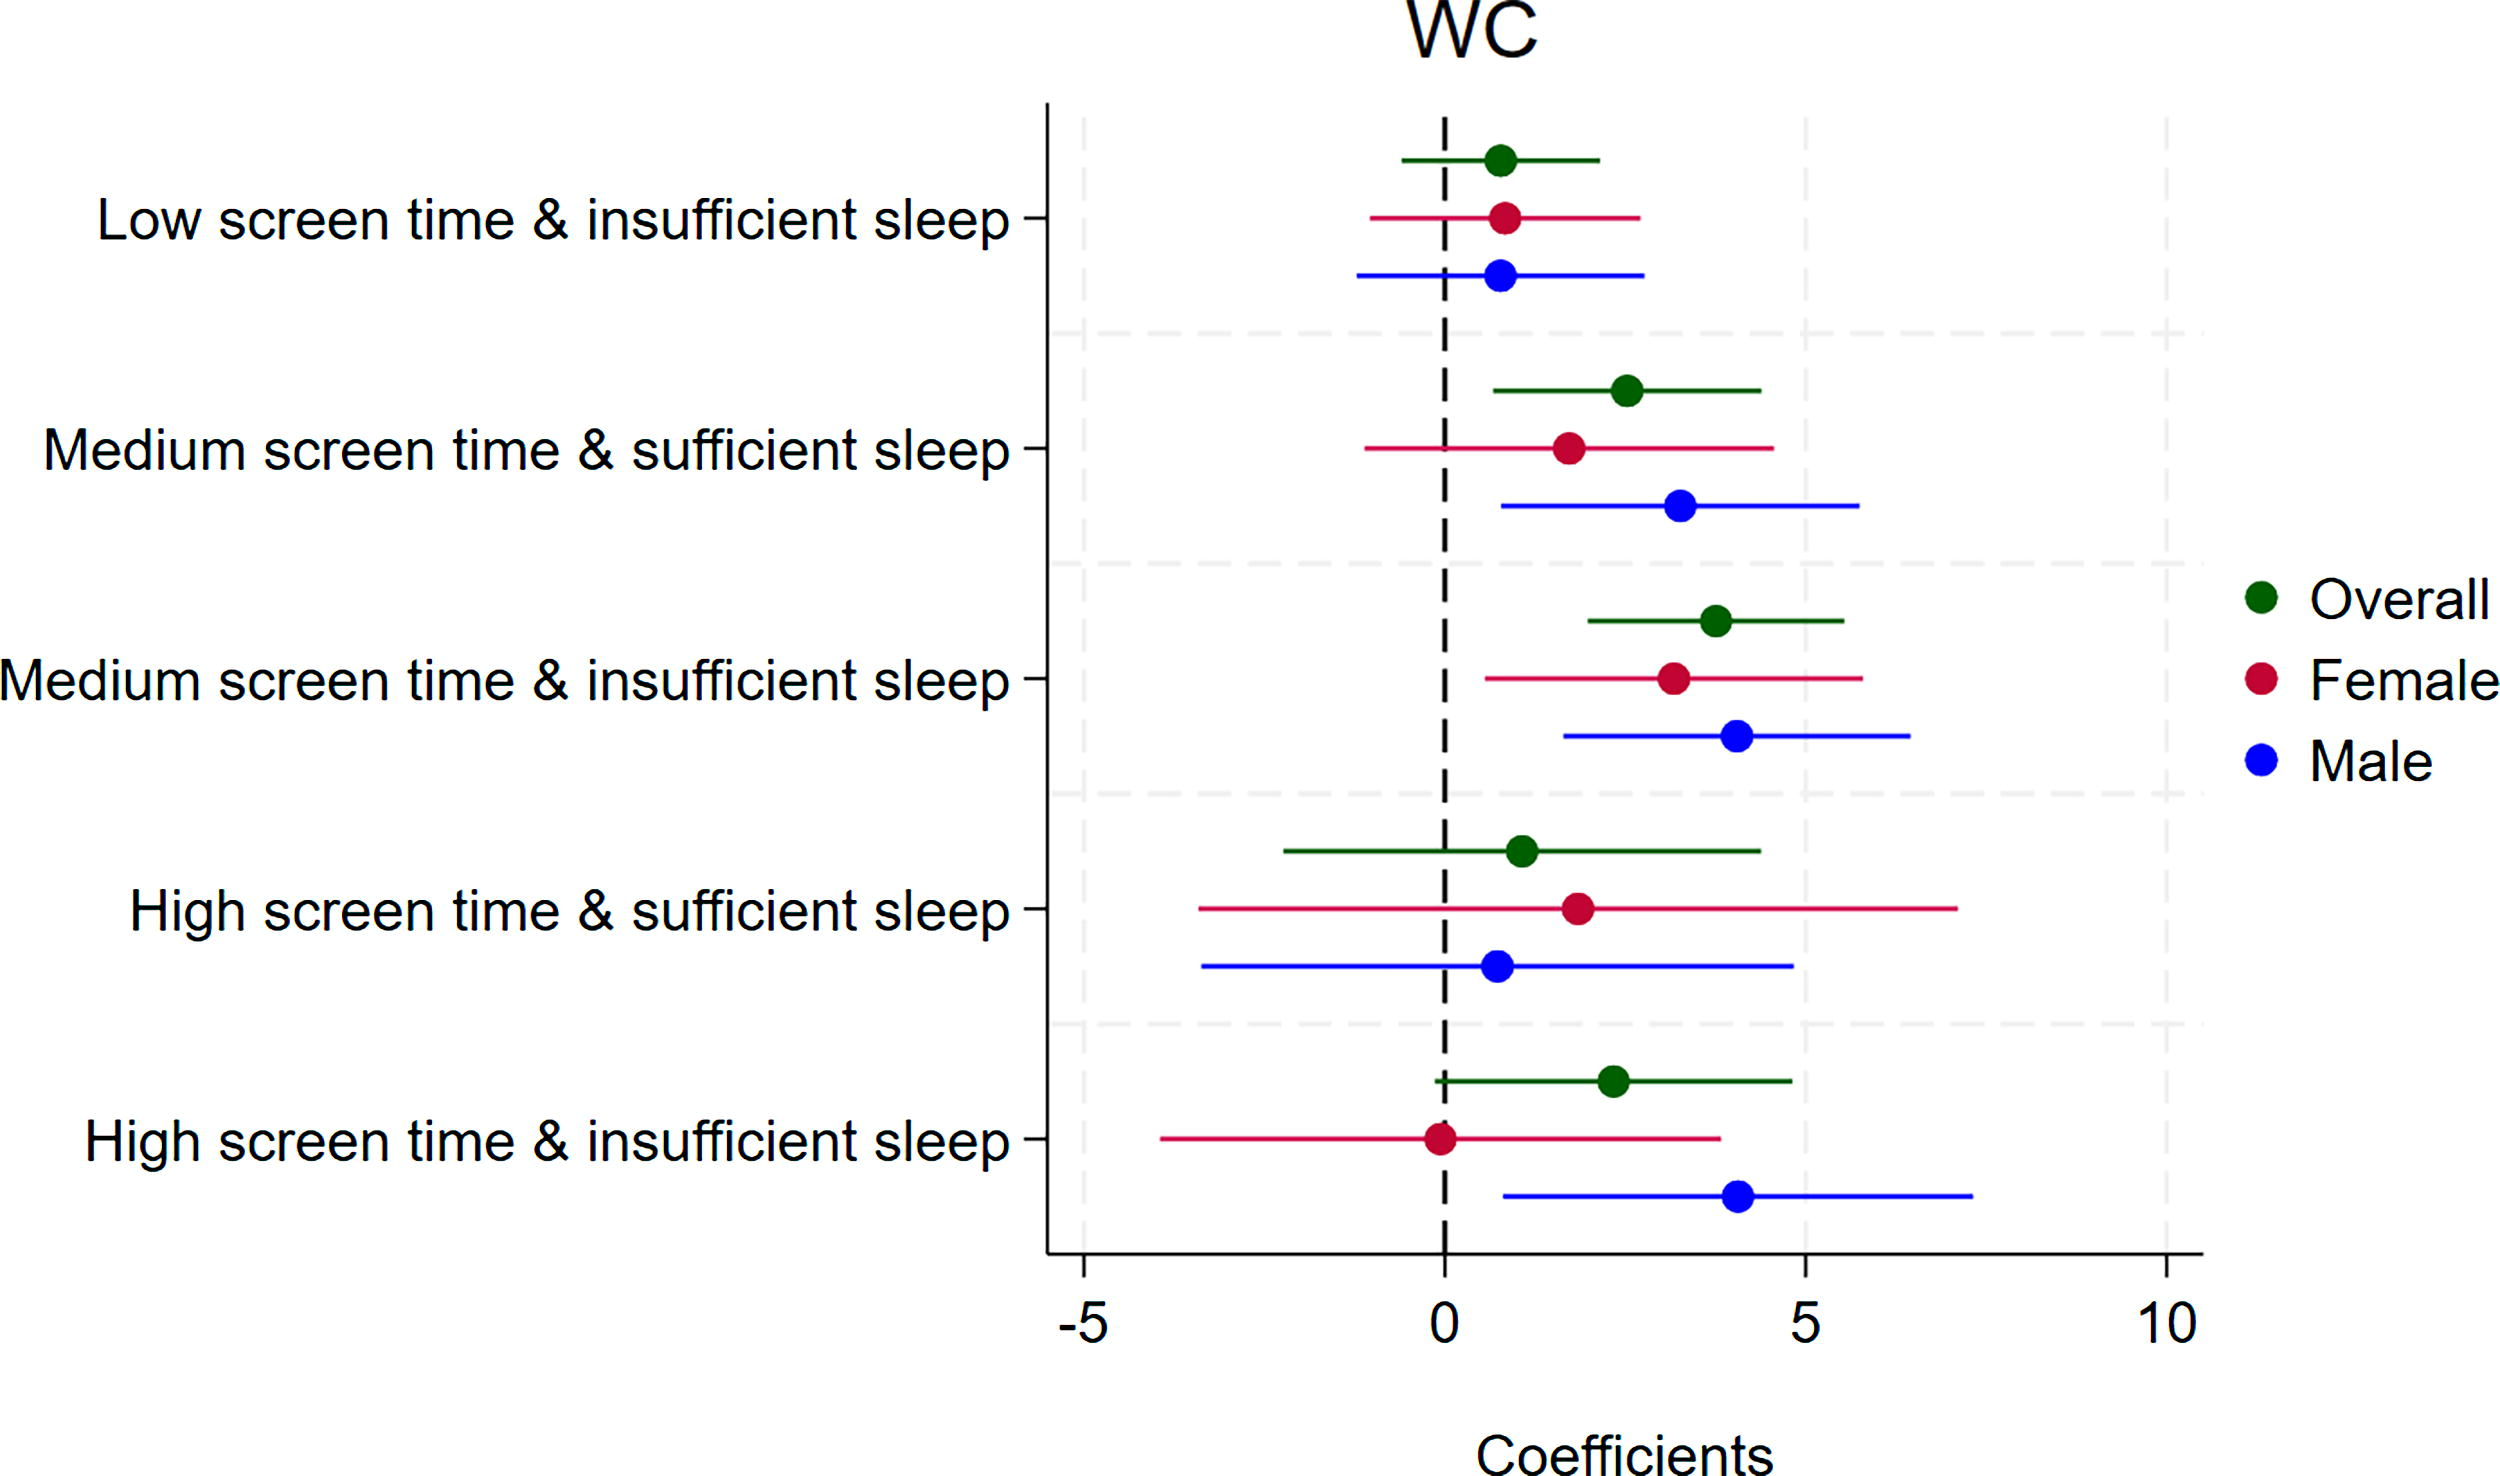
Figure 4 shows the joint associations of screen time and sleep duration with WC. Compared to participants with low screen time and sufficient sleep duration, participants with medium screen time and sufficient or insufficient sleep (B = 2.52; 95% CI: 0.67, 4.38; B = 3.75; 95% CI: 1.98, 5.53, respectively) had higher WC. Among females, medium screen time and insufficient sleep (B = 3.17; 95% CI: 0.55, 5.79) was associated with higher WC. Among males, medium screen time with or without insufficient sleep (B = 3.26; 95% CI: 0.77, 5.74; B = 4.04; 95% CI: 1.64, 6.45, respectively), and high screen time and insufficient sleep (B = 4.06; 95% CI: 0.81, 7.31) were associated with higher WC. Detailed results are provided in Supplementary Tables S2, S3, S4, and S5.
Joint associations of screen time and sleep duration with WC. Sufficient sleep ≥9 hours, insufficient sleep <9 hours. Low screen time (0–4 hours per day) and normal sleep were set as a reference group. The model was adjusted for age, race/ethnicity, household income, highest parent education, physical activity, study site, and baseline WC. The overall model was additionally adjusted for sex. WC, waist circumference.
Supplementary Tables S6 and S7 show the associations of specific screen time modalities with BMI and WC, with results consistent with the main findings. Sensitivity analyses using subjects without missing values (Supplementary Tables S8, S9, S10, S11, S12, and S13) yielded comparable findings.
Discussion
In this prospective cohort study using data from the ABCD Study, which included a diverse sample of U.S. adolescents aged 9–10 years at baseline (2016–2018), the magnitude and direction of the associations of screen time, sleep disturbance, and sleep duration with BMI and WC varied over 2 years. These findings highlight the interrelated nature of these behaviors and support examining them jointly rather than in isolation. Sex differences were evident, with medium or high screen time combined with sleep disturbance or insufficient sleep showing stronger associations with higher BMI and WC in males than females. Although no significant interactions were observed between screen time and sleep disturbance or between screen time and sleep duration, these findings contribute to a better understanding of their combined association with BMI and WC.
Screen time was associated with higher BMI, particularly in males, and WC in both sexes. Specific modalities, TV/movies and video games, were particularly associated with higher BMI and WC, especially among males. These findings align with previous studies reporting associations between screen time and high BMI and WC6,9,17 but differ from studies reporting null or inconsistent associations across screen modalities, likely reflecting differences in measurement approaches and study populations.8,10,14,52 Differences may also relate to age differences. Previous studies included older adolescents (10–17 53 or 11–20 54 years), whereas our study focused on pre/peripubertal children (9–10 years at baseline), a developmental period marked by hormonal changes, increased emotional volatility and social needs, all of which may influence screen behaviors and their related health outcomes.
Differences in screen time measurement may partly explain discrepancies across studies.10,14 For example, our study assessed screen use across multiple modalities, while other studies used either social media 53 or computers, cell phones, handheld video games, and other electronic devices. 54 Prolonged screen time is associated with sedentary behavior and unhealthy eating habits, leading to weight gain through increased snacking, exposure to unhealthy food advertisements, and reduced energy expenditure. It may suppress melatonin production due to screen light exposure, disrupting sleep quality and duration. 55 Poor sleep can alter appetite-regulating hormones and reduce energy use, potentially amplifying the effect of screen time on BMI and WC. 5 However, evidence on this interaction remains limited; for example, one study using 2016–2017 NSCH data found no moderating effect of sleep. 54
We also found that sleep disturbance and insufficient sleep were associated with higher BMI, among males, but not WC. These findings align with some studies reporting associations between sleep parameters and elevated BMI and WC, but not with others reporting null associations.20,56–59 Inconsistencies may reflect variation in the sleep assessment methods.19,26,27 Poor sleep may contribute to BMI through biological pathways, including altered metabolic processes, reduced leptin, increased ghrelin, and heightened appetite.18,21 Behavioral mechanisms also play a role, as poor sleep can lead to reduced physical activity and altered eating habits.18,21
This study further examined the joint associations of screen time with sleep disturbance and sleep duration. Participants with sleep disturbance or insufficient sleep and medium or high screen time had higher BMI, particularly among males. Both medium screen time combined with sleep disturbance and medium or high screen time with either insufficient or sufficient sleep were associated with higher WC, with stronger associations observed in males. These findings suggest that poor sleep may exacerbate the association between screen time and BMI, especially among males, although effects on WC were less consistent.
The observed sex differences may partly reflect higher daily screen time and greater sleep disturbance among males. Differences in energy balance regulation may also contribute to the observed sex differences. Ghrelin and leptin, hormones that regulate appetite, increase and suppress hunger, respectively. Sleep deprivation raises ghrelin and lowers leptin, promoting weight gain; however, whether these hormonal responses differ by sex remains unclear. 60
At baseline, males reported higher average daily screen time but had lower average BMI at year 2 compared with females. This may reflect sex-specific patterns of pubertal development, whereby males tend to gain more lean mass and females more body fat, leading to differences in BMI despite similar lifestyle behaviors. 61 In addition, although males reported greater screen time, they are more likely to engage in high-intensity physical activities, such as sports, resulting in greater short-term energy expenditure. 62
This study has several strengths. First, it jointly considers screen time and sleep, recognizing their co-occurrence and potential combined effects on adiposity. Second, the use of a large, diverse, population-based sample enhances generalizability. Third, the prospective design allows examination of temporal relationships between screen time, sleep disturbance, and sleep duration with BMI and WC. However, some limitations should be noted. First, screen time was self-reported, introducing potential recall and reporting bias. Second, screen time was not classified as discretionary or nondiscretionary at baseline. Third, caregiver-reported sleep measures may be affected by recall bias, with potential overestimation of sleep duration. Fourth, self-report measures do not capture the content of screen time and are generally less precise. Fifth, sleep duration was categorized into five broad groups, limiting evaluation of potential nonlinear (e.g., U-shaped) associations.
Conclusion
This prospective cohort study found that screen time was independently associated with BMI and WC 2 years later. Sleep disturbance and duration were associated with high BMI, but not WC, among early adolescents in the U.S. Joint associations suggested that prolonged screen time combined with poor sleep, either disturbance or insufficient duration, may further increase the risk of high BMI and WC, among males. These findings support the potential benefit of interventions that reduce screen time and improve sleep hygiene, especially in adolescent males. While this study explored sleep as a moderator in the screen time-adiposity relationship, future research should assess whether sleep also mediates this association as a pathway through which screen time may contribute to obesity risk.
Impact Statement
We found that high screen time, sleep disturbances, and short sleep duration were independently and jointly associated with higher body mass index and waist circumference among adolescents 2 years later, with stronger effects in males. These findings highlight the need for interventions that reduce screen time and improve sleep quality to offset the risk of obesity.
Footnotes
Acknowledgments
The authors thank Anthony Kung for editorial assistance.
Authors’ Contributions
A.A.A.: writing—original draft, writing—review and editing, formal analysis, data curation, conceptualization. C.K.H.: writing—review and editing. J.S.: writing—review and editing. W.C.: writing—review and editing. E.E.D.: writing—review and editing. H.C.G.: writing—review and editing. K.P.G.: writing—review and editing. F.C.B.: writing—review and editing, data curation. J.M.N.: writing—review and editing, supervision, conceptualization. All authors approved the final article as submitted and agree to be accountable for all aspects of the work.
Author Disclosure Statement
The authors have no conflict to declare.
Funding Information
The research was supported by the National Institutes of Health (K08HL159350 and R01MH135492) and the Doris Duke Charitable Foundation (2022056). The funders had no role in the study analysis, decision to publish the study, or the preparation of the article. The authors have no conflicts of interest to declare. The ABCD Study was supported by the National Institutes of Health and additional federal partners under award numbers U01DA041022, U01DA041025, U01DA041028, U01DA041048, U01DA041089, U01DA041093, U01DA041106, U01DA041117, U01DA041120, U01DA041134, U01DA041148, U01DA041156, U01DA041174, U24DA041123, and U24DA041147. A full list of supporters is available at https://abcdstudy.org/federal-partners/. A listing of participating sites and a complete listing of the study investigators can be found at  . ABCD consortium investigators designed and implemented the study and/or provided data, but did not necessarily participate in the analysis or writing of this report. Role of Funder Sponsor: The funders had no role in the study analysis, the decision to publish the study, or the preparation of the article.