
Abstract
Abstract
Multipotent skin-derived progenitors (SKP) can produce both neural and mesodermal progeny in vitro, sharing the characteristics of embryonic neural crest stem cells. However, the molecular basis for the property of multiple lineage potential and neural crest origin of SKPs is still elusive. Here we report the cooperative expression of pluripotency related genes (POU5F1, SOX2, NANOG, STAT3) and neural crest marker genes (p75NTR, TWIST1, PAX3, SNAI2, SOX9, SOX10) in GFP-transgenic porcine skin-derived progenitors (pSKP). The proportion of cells positive for POU5F1, nestin, fibronectin, and vimentin were 12.3%, 15.1%, 67.9% and 53.7%, showing the heterogeneity of pSKP spheres. Moreover, pSKP cells can generate both neural (neurons and glia) and mesodermal cell types (smooth muscle cells and adipocytes) in vitro, indicating the multiple lineage potency. Four transcription factors (POU5F1, SNAI2, SOX9, and PAX3) were identified that were sensitive to mitogen (FBS) and/or growth factors (EGF and bFGF). We infer that POU5F1, SNAI2, SOX9, and PAX3 may be the key players for maintaining the neural crest derived multipotency of SKP cells in vitro. This study has provided new insight into the molecular mechanism of stemness for somatic-derived stem cells at the level of transcriptional regulation.
Introduction
The transcriptional regulation of stemness may contribute to the genetic program for the multipotency and self-renewal of stem cells, wherein the key transcription factors seem to have the potential to regulate the stemness and cell fate determination in stem cell development (Boyer et al., 2005; Ivanova et al., 2006; Loh et al., 2006; Ramalho-Santos et al., 2002). The pluripotency of embryonic stem (ES) cells is maintained by autoregulated circuitry in virtue of three key transcription factors: POU5F1, SOX2, and NANOG (Boyer et al., 2005). Recently this transcriptional network for pluripotency has been extended to nine factors (Kim et al., 2008). On the other hand, the importance of transcriptional regulation for pluripotency is further verified by reprogramming fibroblast cells and even terminally differentiated cells towards induced pluripotent stem (iPS) cells through introducing four transcription factors (Aoi et al., 2008; Hanna et al., 2008; Jaenisch and Young, 2008; Takahashi and Yamanaka, 2006). A similar transcriptional regulatory mechanism for POU5F1 is also found in human mesenchymal stem cells (Greco et al., 2007).
Therefore, it is speculated that the multipotency of SKPs could be traced back to a transcriptional network regulated by some specific transcription factors. The SKP cells are neural crest-derived and share the characteristics of embryonic neural crest stem cells (Fernandes et al., 2004, 2008; Wong et al., 2006). However, the molecular mechanism of stemness by SKP cells is still elusive, leaving an open question why the SKPs have the ability of multiple lineage differentiation and what key genes regulate the multipotency.
The purpose of this study is to trace the stemness of SKP cells back to specific marker gene expression. We hypothesize that some specific transcription factors may contribute to the transcriptional regulation of multipotency and maintain the neural crest derived property of SKP cells, thus controlling their stemness at the transcriptional level.
Materials and Methods
Animal use and care have been reviewed and approved by the Animal Care and Use Committee (ACUC) University of Missouri.
Cell isolation and cultures
Unless indicated otherwise, media and components used in this study were purchased from Sigma (St. Louis, MO).
The pSKP cells were isolated by a previously described method with a few modifications (Biernaskie et al., 2006). Primary cells were collected from the back/trunk skin of 40-50 d EGFP transgenic porcine fetuses (Whitworth et al., 2009). Briefly, the skin tissues were peeled from the outer skin and washed with D-PBS (Invitrogen, Carlsbad, CA) three times. Then the tissues were cut into small pieces and washed with D-PBS three times by centrifugation. Each sample was separately digested in 0.1% trypsin for 20–40 min at 37°C and 5% CO2 in air. Following trypsinization 1 mL of 0.1% DNase I was added and incubated for 1 min at room temperature (RT). Then trypsin was neutralized with 10 mL of neutralization solution (DMEM/F12 (1: 1, Invitrogen) + 10% FBS (Hyclone, Logan, UT), and the cells were washed three times with DMEM/F12 medium. The cells were mechanically dissociated in 3 mL of medium by vortexing and/or pipetting, and then poured through a 40-μm strainer (BD Biosciences, Franklin Lakes, NJ). The dissociated cells were collected by centrifugation and the cell number was determined. The cells were then resuspended with standard culture medium containing DMEM/F12 (1:1), B27 (50×, Invitrogen), 20 ng/mL EGF and 40 ng/mL bFGF and cultured in suspension dishes (Sarstedt, Newton, NC). The same volume of medium with 2× growth factor concentration was supplemented in 3 days to ensure that the final concentration of growth factor did not diminish over time. The spheres (cell aggregate) appeared in 5–7 days. The SKP spheres were harvested and stored in liquid nitrogen. Totally individual skin samples from 6 litters were collected for isolation.
Differentiation assay
Before differentiation, pSKP cells were cultured in predifferentiation medium (DMEM/F12 (1:1) + B27 + 20 ng/mL EGF + 40 ng/mL bFGF + 10% FBS) in suspension for 3 days. The cells were harvested and transferred to poly-D-lysine (0.1 mg/mL)/laminin (0.02 mg/mL)-coated dishes. After another 3 days the cells were subjected to either neuronal differentiation or glial differentiation. For glial differentiation, the culture medium was replaced with glial differentiation medium (DMEM/F12 + 5 μM forskolin + 50 ng/mL heregulin (R&D Systems, Minneapolis, MN) + 1% N2 supplement (Invitrogen) + 1–5% FBS). For neuronal differentiation, the culture medium was replaced with neuronal differentiation medium (Neurobasal Medium (Invitrogen) + B27 + 1% N2 + 50 ng/mL NGF (nerve growth factor) + 20 ng/mL BDNF (brain derived neurotrophic factor, PeproTech, Rocky Hill, NJ), 10 ng/mL NT3 (neurotrophin-3, PeproTech) + 1–5% FBS). The medium was refreshed every 3 days by removing half of the medium and adding the same volume of fresh medium with 2× concentration of growth factors and supplements. The cultures continued for 1–2 weeks and the differentiated progeny were subjected to either immunoctyochemistry or RNA isolation.
Immunocytochemistry
Cell cultures were washed with PBS three times and fixed with 4% paraformaldehyde for 20 min. Fixed cells were washed with PBS three times and permeabilized with 0.2% Triton X-100 for 30 min at RT. The cells were washed and blocked with PBS/FBS (10%) for 2 h at RT and then incubated with primary antibody diluted in PBS/FBS for 1 h at RT. Following washing they were incubated with secondary antibody for 1 h at RT and then washed again. Finally, they were incubated with Hoechst 33342 for 15 min. A parallel culture was stained only with secondary antibody as a negative control and the culture without any antibody was used for blank control. Primary antibodies were monoclonal anti-POU5F1 (Santa Cruz Biotechnology, Santa Cruz, CA; 1:200), monoclonal anti-nestin (Santa Cruz, 1:250), monoclonal antifibronectin (Abcam, Cambridge, MA; 1:200), monoclonal antivimentin (Abcam, 1:200), monoclonal anti-GFAP (Sigma, 1:250), monoclonal anti-tubulin β-III (Sigma, 1:250), monoclonal anti-NFM (Abcam, 1:100), monoclonal anti-p75NTR (Abcam, 1:100). Secondary antibodies were Alexa Fluor® 594 goat anti-mouse IgG (H+L) (Invitrogen, 1:500), Alexa Fluor® 594 goat anti-rabbit IgG (H+L) (Invitrogen, 1:500). The images were captured by the DS Camera Control Unit DS-U2 (Nikon, Melville, NY) and processed by the NIS-Elements imaging software (Nikon).
Quantitative RT-PCR
Total RNA was extracted by using the Pure-Link Micro-to-Midi Total RNA Purification System (Invitrogen). Reverse transcription was carried out by QuantiTech Reverse Transcription kit (Qiagen, Valencia, CA) according to the manufacturer's instructions. Then the synthesized cDNA was subjected to either regular PCR using Platinum Blue PCR SuperMix (Invitrogen) or real-time PCR using Power SYBR Master Mix (Applied Biosystems, Carlsbad, CA). Reference cDNA described previously (Whitworth et al., 2005) was used as the template for positive control and standard curve for real-time PCR. The amplicons were sent to DNA Core University of Missouri-Columbia for sequencing and confirmed by BLAST in NCBI Web site. The expression levels of target genes were analyzed by the relative standard curve method. GAPDH was used as the calibrator gene. The primers are listed in Table 1.
Experimental design
The cultures were divided into the groups listed in Table 2. The mRNA level of pSKP cells in standard culture medium was used as the calibrator sample. Each pool of samples was cultured for 4 days and then harvested for real-time PCR as described above. Real-time PCR data were obtained from three independent biological replicates and analyzed by one-way ANOVA.
The target marker genes were divided into two types: abundant copy number messages (Nestin, p75NTR, SNAI2, TWIST1, SOX9, and Fibronectin), low copy number messages (NANOG, POU5F1, SOX2, STAT3, PAX3, GFAP, SOX10, and tubulin β-III) relative to the mRNA level of GAPDH.
Results
Heterogeneity of pSKP spheres in vitro
The pSKP cells isolated from the back and/or trunk skin developed into spheres (cell aggregate) at around 1 week (Fig. 1A–B). The progenitor cells gathered together into spheres, whereas other cells (epithelial and fibroblast cells) either adhered to the bottom of the dishes or died. This is a process of selection that could help the formation of stem cell niches for pSKP in vitro. We observed the heterogeneous expression of specific marker genes by pSKP spheres (Fig. 1C–F). The percentage of cells positive for fibronection and vimentin were 67.9 and 53.7%, respectively. In contrast, the proportion of cells positive for POU5F1 (12.3%) or nestin (15.1%) was much lower than those of fibronectin and vimentin. The expression of these genes was further confirmed by RT-PCR (see below).
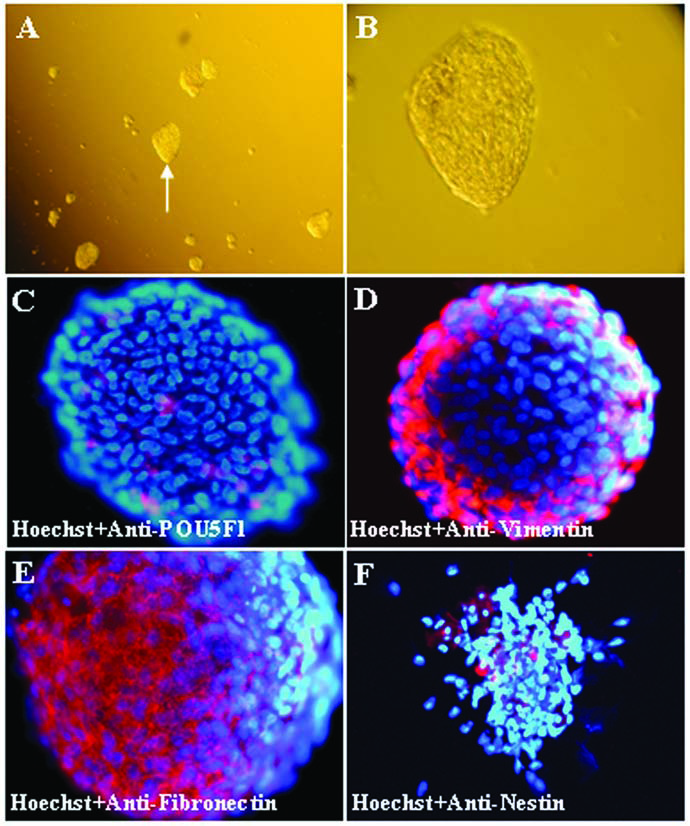
Isolation and characterization of pSKP cells. (
Cooperative expression of pluripotency related genes and neural crest marker genes by pSKPs
We focused on three types of genes: pluripotency-related genes (POU5F1, SOX2, NANOG, and STAT3), neural crest marker genes (p75NTR, TWIST1, PAX3, SNAI2, SOX9, and SOX10), and lineage-related genes (nestin, fibronectin, vimentin, GFAP, tubulin β-III, and leptin). Consistent with those of human and rodent SKPs (Fernandes et al., 2004; Toma et al., 2005; Wong et al., 2006), pSKP cells can produce detectable mRNA levels of p75NTR, TWIST1, PAX3, SNAI2, SOX9, and SOX10 (Fig. 2), most of which are involved in the neural crest induction and development (Crane and Trainor et al., 2006; Kim et al., 2003; Kuriyama and Mayor, 2008; Morrison et al., 1999; Sahar et al., 2005; Sauka-Spengler and Bronner-Fraser, 2008; Stemple and Anderson, 1992; Trainor, 2005; Vincentz et al., 2008).
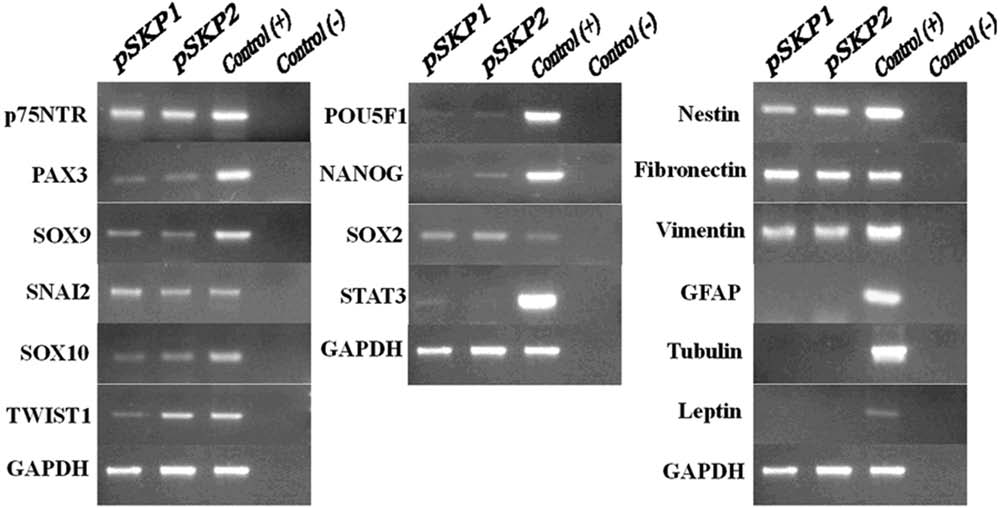
Cooperative expression of pluripotency related genes and neural crest marker genes by pSKP cells. The RT-PCR amplicons of neural crest marker genes (left panel), pluripotency related gene (middle panel), and lineage related genes (right panel) were displayed. GAPDH was used as a loading control for RT-PCR. The reference cDNA was employed for positive control, whereas NO RT template for negative control. The templates were from two pools of total RNA (pSKP1, pSKP2) under standard culture condition (DMEM/F12 + B27 + EGF + bFGF, suspension).
In addition, pluripotency-related transcripts were present as well (Fig. 2), although some of them may be of low abundance and nearly undetectable. In addition, the mRNA of nestin, fibronectin, and vimentin were all detected, consistent with the above data. To ensure the undifferentiated state of pSKP cells, we tested the expression of lineage related genes: GFAP for glial cells, tubulin β-III for neurons and leptin for adipocytes, but did not obtain any detectable band for these transcripts (Fig. 2), thus suggesting an undifferentiated state of pSKP cells.
Multipotency of pSKP cells in vitro
To test the multipotency of pSKP cells, we used an induced differentiation assay in vitro. Passage 3 pSKP cells were subjected to either neuron or glial differentiation after 3 days of proliferation in the defined medium plus 5% FBS. For glial differentiation, we observed the expression of glial specific markers GFAP and/or p75NTR in the differentiated cultures, showing the similar expression profile of Schwann cells in peripheral nervous system (Jessen and Mirsky, 2005) (Fig. 3A–B). With regard to neuron differentiation, a sub-population of tubulin β-III-positive or NFM-positive cells was present after differentiation, indicating the neuronal potency of pSKP cells (Fig. 3C–D). In the same differentiation cultures for neurons, we also detected a small number of cell population expressed smooth muscle actin (SMA), the marker of smooth muscle cells (Fig. 3E). In addition, leptin mRNA was also identified in the transcripts of differentiation cultures (data not shown). To estimate the proportion of positive cells, random field of cells from three separate experiments were counted to determine the total number of cells (indicated by Hoechst 33342 staining nuclei) versus the total number of positive cells. The percentage of GFAP positive and tubulin β-III positive cells were 42.6 and 39.4%, respectively, whereas the proportion of NFM positive cells was much lower, 4.76%. In the view of morphology, we observed the neuron-like progeny appearing in the differentiation cultures, obviously distinctive from the monolayer of pSKP cells (Fig. 3F–H). Together, these data demonstrate that the pSKP cells can generate both neural and mesodermal cell types in vitro, including neurons, glia, smooth muscle cells, and adipocytes, and indicate the multiple lineage potential of pSKP cells.
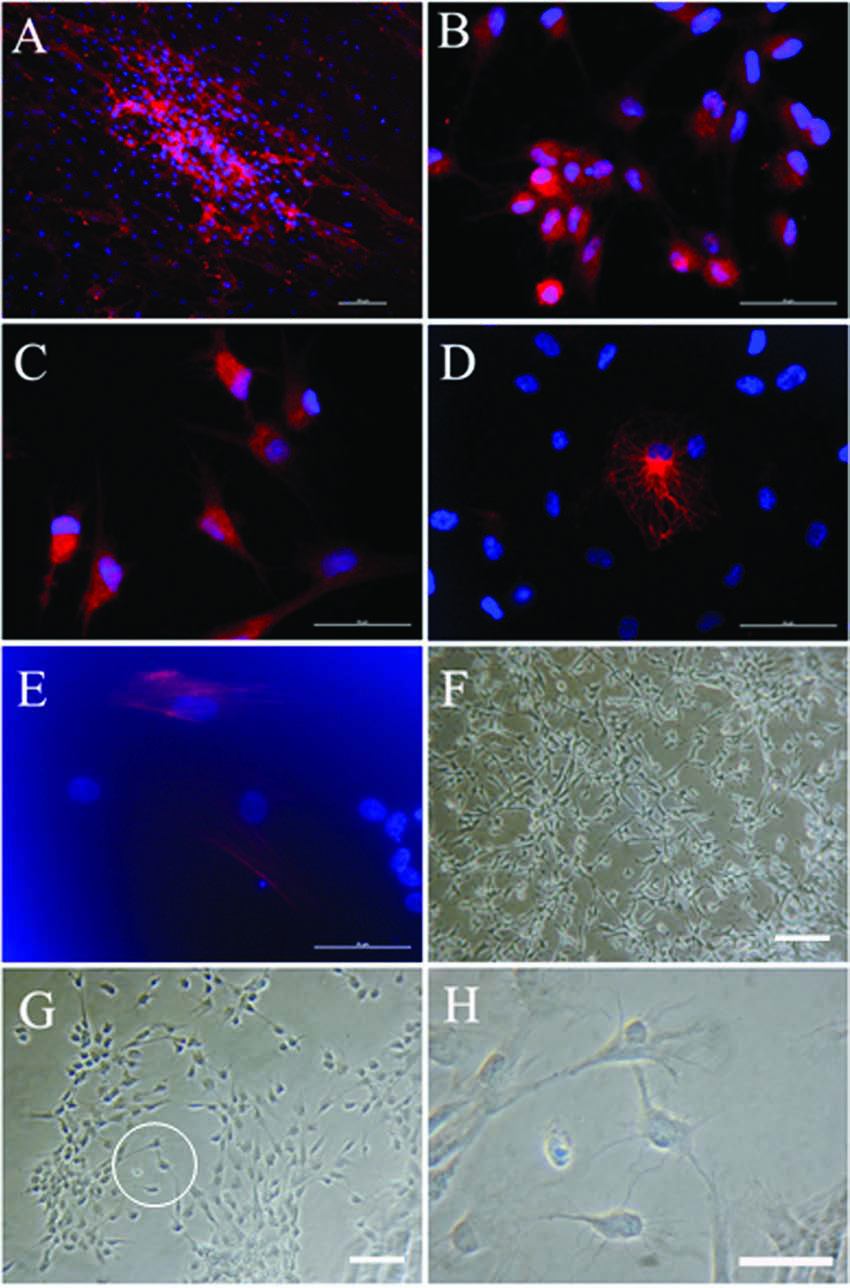
Multipotency of pSKP cells in vitro. (
Real-time PCR of target marker genes in response to substrate and mitogen in vitro
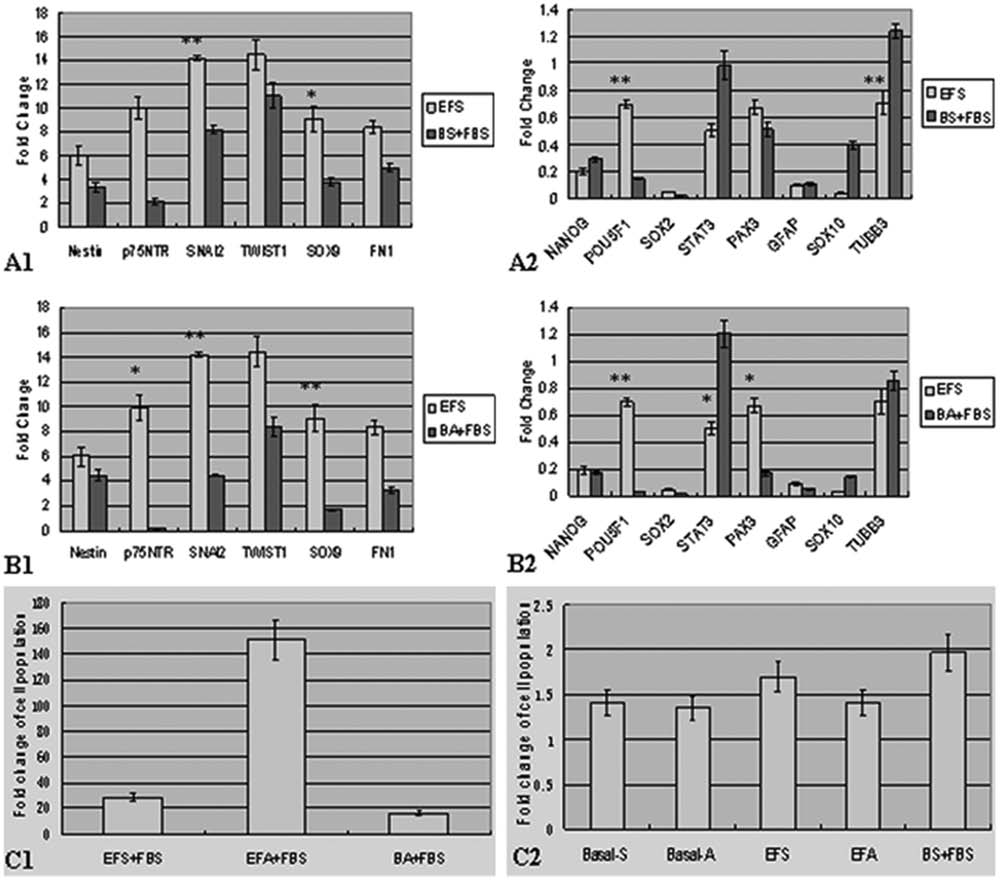
To evaluate the effect of cell-substrate interaction on the maintenance of multipotency of pSKP cells, two different culture systems (Table 2, EFS (DMEM/F12 + B27 + EGF + bFGF, suspension) and EFA (DMEM/F12 + B27 + EGF + bFGF, adhesion)) were employed. We did not observe any visible difference on cell morphology (Fig. 1A and Fig. 4A) as the pSKP cells stayed in suspension even in adhesive dishes. Only POU5F1 and tubulin β-III mRNA were significantly changed between the two groups (Fig. 5A–B, p < 0.05).
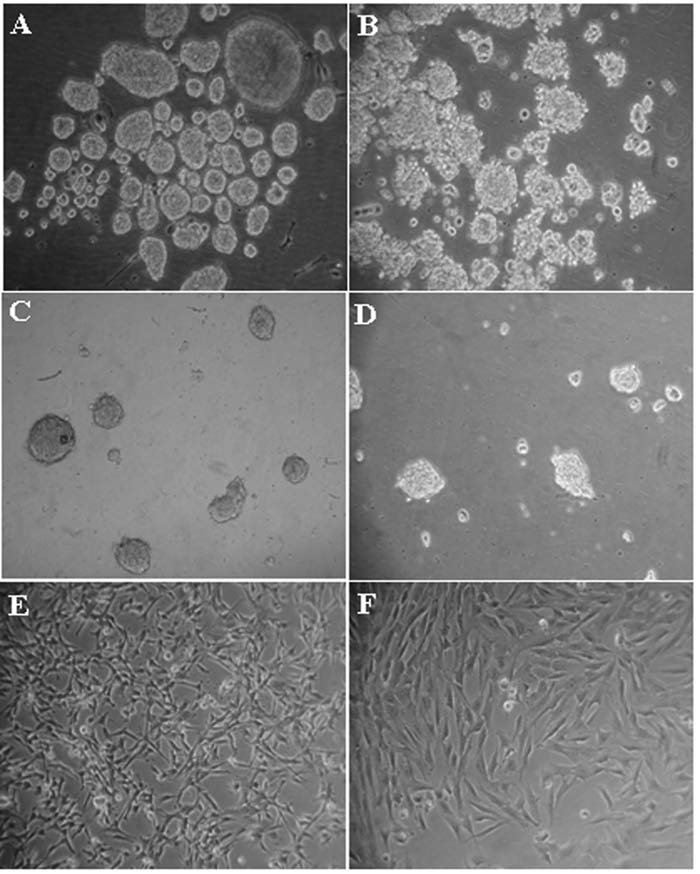
Differential cell morphology of pSKP cells in response to different culture conditions. (

Real-time PCR of target marker genes in response to substrate and FBS. The fold change is the relative amount of mRNA normalized to GAPDH mRNA. (
However, mRNA levels responded to FBS either in suspension or in adhesion culture (Table 2, EFS + FBS (DMEM/F12 + B27 + EGF + bFGF + 10% FBS, suspension) and EFA + FBS (DMEM/F12 + B27 + EGF + bFGF + 10% FBS, adhesion)). In suspension culture pSKP spheres kept floating (Fig. 4B), while in adhesion culture pSKP cells attached and the cells spread from the spheres (Fig. 4E). They connected together to make up an interactive network, which was obviously a different morphology from the floating spheres in suspension culture. The cell–substrate interaction induced the pSKP cells to proliferate rapidly, enabling them to increase as much as 150 times within 4 days (Fig. 6C1). However, the population could only increase less than 30 times in suspension culture with the same medium.
Effect of growth factors on target marker genes expression in pSKP cells. (
In suspension culture with FBS (EFS + FBS), most of the target marker genes were downregulated, especially p75NTR (p < 0.05), SNAI2 (p < 0.01), PAX3 (p < 0.05), and SOX9 (p < 0.05) (Fig. 5B1–2). Additionally, the abundance of POU5F1 mRNA decreased (p < 0.01), whereas tubulin β-III mRNA increased almost twofold compared with that in standard culture (EFS). In adhesion culture with FBS (EFA + FBS), SNAI2, SOX9, and POU5F1 were downregulated about 10-fold (Fig. 5C1–2) while PAX3 (p < 0.05) was five times lower. Thus PAX3, POU5F1, SNAI2, and SOX9 were significantly affected both in suspension and adhesion cultures with FBS. In addition, most of the target marker genes were downregulated with FBS cultures.
The effect of growth factors on target marker genes expression in pSKP cells
To determine the effect of growth factors (EGF + bFGF) on gene expression in pSKP cells, we cultured pSKP cells without growth factors (Table 2, BS + FBS (DMEM/F12 + B27 + 10% FBS, suspension) and BA + FBS (DMEM/F12 + B27 + 10% FBS, adhesion)). In view of the important role of cell division as a mediator of transitions between different states of gene expression during stem cell development (Egli et al., 2008), we introduced FBS in growth factor-deficient medium to promote proliferation. FBS promoted cell proliferation: 16-fold increase in BA + FBS cultures and twofold in BS + FBS (Fig. 6C1–2). SOX9 (p < 0.05), POU5F1 (p < 0.01), and SNAI2 (p < 0.01) mRNA were significantly declined in BS + FBS (Fig. 6A1–2), while tubulin β-III mRNA was twofold (p < 0.01) more abundant in BS–FBS culture. Similarly, POU5F1, SNAI2, and SOX9 mRNA were significantly downregulated (p < 0.01) in BA–FBS culture (Fig. 6B1–2). The other two target marker genes (PAX3 and p75NTR) were also significantly downregulated (p < 0.05), whereas STAT3 mRNA was upregulated (p < 0.05).
In summary, POU5F1, SNAI2, and SOX9 mRNA were significantly downregulated in the cultures without growth factors. These three transcription factors were also significantly downregulated either in EFS–FBS culture or in EFA–FBS culture. In addition, PAX3 mRNA was downregulated significantly in three cultures (i.e., EFS–FBS, EFA–FBS, and BA–FBS) except BS–FBS culture. Thus, we identified that the mRNA levels of four transcription factors (POU5F1, SNAI2, SOX9, and PAX3) were significantly changed in response to mitogen or growth factors by pSKP cells.
Discussion
In this study, we attempted to trace the stemness of SKP cells back to specific marker gene expression, which may help illustrate the molecular basis for the multipotency and neural crest derived property of pSKP cells (Fernandes et al., 2004; Hunt et al., 2008; Toma et al., 2001; Wong et al., 2006). We observed the cooperative expression of pluripotency-related genes and neural crest marker genes by pSKP cells, which indicates that pSKP cells are of neural crest origin and share a common transcriptional profile with neural crest stem cells. Moreover, we demonstrate that pSKP cells have the multiple lineages potential and can generate both neural and mesodermal progeny in vitro. These data are consistent with human and rodent SKPs cells (Fernandes et al., 2004; Hunt et al., 2008; Toma et al., 2005; Wong et al., 2006). However, the pSKP spheres were heterogeneous by the expression profile (Fig. 1). We suppose there are likely two or more metastable states for pSKP cells in the niche of spheres in vitro, which might be caused by the oscillatory expression of synergistically or antagonistically acting transcription factors and stabilized by epigenetic modifications (Chou et al., 2008; Graf and Stadtfeld, 2008; Hayashi et al., 2008).
Except for p75NTR, the other neural crest marker genes are transcription factors. However, p75NTR, as one of the two receptors for nerve growth factor, could be used as a cell surface marker to identify neural crest stem cells by flow cytometry (Morrison et al., 1999; Stemple and Anderson, 1992). In addition, p75NTR/SOX10 positive SKP cells are demonstrated to have stem cell properties (Wong et al., 2006), together with the view that SOX10 maintains multipotency and inhibits neuronal differentiation of neural crest stem cells (Kim et al., 2003). SNAI2 belongs to a zinc-finger transcription factor gene family, and plays key roles in the formation of neural crest cells by promoting the commencement of their migration (Crane and Trainor, 2006). TWIST1 is required for the delamination, emigration from dorsal neural tube, and along migration pathway of neural crest cells (Kuriyama and Mayor, 2008; Vincentz et al., 2008). Therefore, the expression of neural crest marker genes reveals the neural crest origin of pSKP cells, which may persist from embryonic stage into adulthood (Fernandes et al., 2004; Hunt et al., 2008; Wong et al., 2006).
Consistent with previous studies (Dyce et al., 2004), POU5F1 and STAT3 expression was detected from pSKP cells. Moreover, we identified the coexpression of NANOG and SOX2, although these pluripotency related genes (POU5F1, NANOG, SOX2, and STAT3) seem to be with lower expression levels. POU5F1, SOX2, and NANOG can collaborate to form a regulatory circuitry that contributes to pluripotency and self-renewal of ES cells (Boyer et al., 2005; Jaenisch and Young, 2008), whereas STAT3 signaling is indispensable for self-renewal and maintaining undifferentiated state of mouse ES cells (Matsuda et al., 1999). Recently a similar regulatory mechanism mediated by POU5F1 was found in human mesenchymal stem cells (Greco et al., 2007). It is likely that a similar regulatory circuitry may exist in somatic-derived stem cells as well. Herein we validated this hypothesis by confirming the coexpression of POU5F1, SOX2, NANOG, and STAT3 in pSKP cells (Fig. 2), which may be helpful to elucidate the molecular basis of multipotency of SKP cells at a transcriptional level.
The quantitation of target marker genes from pSKP cells was altered in response to mitogen or growth factors. The stemness of pSKP cells in response to FBS was depressed, as shown by a decrease of pluripotency related genes and neural crest marker genes (Fig. 5), although the cell population was dramatically enlarged (20–150 times, Fig. 6). This tendency appeared as well when growth factors were withdrawn (Fig. 6). It is said that bFGF is necessary to sustain the undifferentiated state during long-term culture, and can establish the regulatory stem cell niche of human ES cells in vitro (Bendall et al., 2007; Xu et al., 2005; Yao et al., 2006). Moreover, EGF and bFGF are sufficient for the self-renewal and proliferation of neural stem cells while FGF signaling is involved in the neural crest development (Conti et al., 2005; Mason, 2007; Raballo et al., 2000). Therefore, these findings presented above support the following conclusions. First, most of the target marker genes were downregulated along with the rapid proliferation in pSKP cells, indicating that the stemness diminishes if mitosis occurs frequently. Second, EGF and bFGF can help maintain a higher hierarchy of stemness for pSKP cells without FBS in suspension culture. Third, the four sensitive transcription factors (POU5F1, SNAI2, SOX9, and PAX3) may be engaged in the regulatory niche (spheres) of pSKP cells in vitro.
The four transcription factors (POU5F1, SNAI2, SOX9, and PAX3) provide the clues for the transcriptional regulation of stemness by pSKPs. As mentioned above, the regulatory circuitry of ES cells includes POU5F1, whose expression is also indispensable in reprogramming differentiated cells back to a pluripotent state (Aoi et al., 2008; Hanna et al., 2008; Jaenisch and Young, 2008; Takahashi and Yamanaka, 2006). However, recently a new view has argued that POU5F1 expression is not required for the self-renewal and maintenance of mouse adult stem cells (Lengner et al., 2007). Our study suggests that POU5F1 may contribute to multipotency of pSKP cells, at least participating in the regulation of stemness. In addition, SNAI2, SOX9, and PAX3 are all engaged in the gene regulatory network of neural crest development (Sauka-Spengler and Bronner-Fraser, 2008). SNAI2 functions primarily as a regulator for cell movement and survival, and promotes epithelial–mesenchymal transitions (Taylor and LaBonne, 2007). SOX9 is an early marker of prospective neural crest, regulates neural crest development and controls the differentiation of neural crest-derived cartilage (Cheung and Briscoe, 2003; Sauka-Spengler and Bronner-Fraser, 2008). Recently, it is reported that SOX9 is expressed in multipotent retinal progenitor cells and is essential for the differentiation and survival of postnatal glial cells (Poche et al., 2008). PAX3 can function at a nodal point in melanocyte stem cell (neural crest-derived) differentiation, both determining cell fate and simultaneously maintaining an undifferentiated state (Lang et al., 2005). Together, it is inferred that POU5F1, SNAI2, SOX9, and PAX3 might play a key role in maintaining the neural crest derived properties and multiple lineage potential of pSKPs. Nevertheless, it would be further investigated whether these transcription factors can operate as well in the behaviors of corresponding endogenous precursors in vivo.
In conclusion, we report here that the stemness of pSKPs can be traced backed to the cooperative expression of pluripotency related genes and neural crest marker genes. The four transcription factors (POU5F1, SNAI2, SOX9, and PAX3) may be the key players in regulating the stem cell niche of pSKPs in vitro. We suggest that these findings could help understand the molecular mechanism of multiple lineage potential of pSKP cells.
Footnotes
Acknowledgments
We would like to thank August Rieke for animal care, Kristin M. Whitworth, Melissa S. Samuel, David M. Wax, and Lee D. Spate for technical assistance, and Jason Ross for primer design. This work was supported by a grant from National Institutes of Health National Center for Research Resources (R01RR013438, RSP).
Author Disclosure Statement
The authors declare that no competing financial interests exist.