
Abstract
Abstract
In protein sequence alignment, residue similarity is usually evaluated by substitution matrix, which scores all possible exchanges of one amino acid with another. Several matrices are widely used in sequence alignment, including PAM matrices derived from homologous sequence and BLOSUM matrices derived from aligned segments of BLOCKS. However, most matrices have not addressed the high-order residue-residue interactions that are vital to the bioproperties of protein. With consideration for the inherent correlation in residue triplet, we present a new scoring scheme for sequence alignment. Protein sequence is treated as overlapping and successive 3-residue segments. Two edge residues of a triplet are clustered into hydrophobic or polar categories, respectively. Protein sequence is then rewritten into triplet sequence with 2 × 20 × 2 = 80 alphabets. Using a traditional approach, we construct a new scoring scheme named TLESUM hp (TripLEt SUbstitution Matrices with hydropobic and polar information) for pairwise substitution of triplets, which characterizes the similarity of residue triplets. The applications of this matrix led to marked improvements in multiple sequence alignment and in searching structurally alike residue segments. The reason for the occurrence of the “twilight zone,” i.e., structure explosion of low identity sequences, is also discussed.
1. Introduction
However, it is known that there are complicated residue-residue interactions in protein. These high-order interactions are essential to the protein molecule. So the hypothesis of mono-residue substitution is not an optimized choice. A more useful approach is investigating the local high-order interactions of protein sequence by k consecutive letters (k-word). As residue-residue correlations are biologically meaningful, the k-word scheme has been used successfully in component analysis of nucleic acid and protein sequences (Karlin and Ghandou, 1985) and in the study of molecular phylogeny (Qi et al., 2004; Hao and Qi, 2004), for example. However, a 20 k dimension vector is required to characterize the word type in such an approach. Owing to the huge dimension size, a complete investigation is nearly impossible. A coarse-grained approach is the one and only choice. Using coarse-grained k-word, research has been performed, including protein secondary structure prediction (Zheng, 2004) and remote homologues detection (Ogul and Mumcuoglu, 2007).
As the physicochemical properties are alike for some naturally occurring amino acids (Mathews and Van Holde, 1995), the size of the residue alphabet could be reduced by grouping similar residues together. The feasibility of amino acid classification was supported by both experimental and theoretical approaches. Several experiments have shown that some proteins designed with fewer than 20 types of residues can maintain native structures of natural proteins (Regan and Degrado, 1988; Kamtekear et al., 1993; Davidson et al., 1995; Riddle et al., 1997). There were also several theoretical approaches focusing on residue classification, based on the substitution propensity of residues (Murphy et al., 2000; Liu et al., 2002; Li et al., 2003; Fan and Wang, 2003), interaction potential (Wang and Wang, 1999; Liu et al., 2002), and other properties (Gorban et al., 2010). Among the various classification schemes, a well-known and meaningful scheme is clustering residue alphabets into hydrophobic/polar groups. The importance of hydrophobic interaction owes much to the following two facts: (i) it is the driving force for protein folding (Dill, 1990; Li et al., 1997); and (ii) it is an important factor for protein-protein interaction (Jones and Thornton, 1996; Young et al., 1994). According to research on amino acid classification, it has been proven that the hydrophobic/polar feature is the dominant factor in clustering residue alphabets into two categories.
In this article, we introduce a residue clustering scheme for the representation of the residue triplet, which decreases the dimension of phase space drastically. We then derive the substitution matrices of the residue triplet from the counts of 3-residue pairwise substitutions based on the aligned residue segments in the BLOCKS9 database (Henikoff and Henikoff, 1991). The capability of such scoring scheme is examined in multiple sequence alignment and secondary structure identification.
2. Methods
2.1. Database
In 1992, Henikoff and Henikoff (1992) obtained their amino acid substitution matrices (BLOSUM, blocks substitution matrix) from the BLOCKS database. This high-quality database is based on local sequence alignment, and derived from the homologous proteins in PROSITE catalog (Bairoch, 1991) by PROTOMAT algorithm (Henikoff and Henikoff, 1991). The BLOCKS database contains the most highly conserved regions (involving biologically significant sites, patterns, and profiles) of related proteins. In order to set up a general scoring scheme, we used the BLOCKS9 database (published December 1995) in matrices construction.
In the BLOCKS database, a group of ungapped multiple aligned segments is called a “block,” with each row a different protein segment and each column an aligned residue position. A block represents a conserved region of a protein family. In total, 3179 blocks are involved in BLOCKS9 database.
2.2. Residue classification scheme
In 1996, based on a database of native protein structure, Miyazawa and Jernigan (1996) derived their knowledge-based potential from the frequencies of structural contacts between different amino acids. This knowledge system provides the basis of many works in folding mechanism (Li et al., 1996, 1997) and residue classification (Wang and Wang, 1999; Liu et al., 2002).
In our approach, a 2-letter scheme based on the Miyazawa-Jernigan matrix is adopted in amino acid classification (hydrophobic h = {M, F, I, L, V, A, W}, polar p = {C, Y, Q, H, P, G, T, S, N, R, K, D, E}). According to a former work (Liu et al., 2002), this classification scheme has a strong correlation with residue hydrophobicity (Branden and Tooze, 1991). Actually, it has been shown by several researchers that there is no large difference among various clustering schemes when residue alphabets are grouped into two categories. So, different selections of clustering schemes should have limited impact on our results. Therefore, the properties derived are expected to be robust. This is the first merit of a two-categories clustering scheme. The other consideration is sample counts. In our approach, approximately 200 × ξ4 elements of a matrix were estimated, where ξ is the category count of a clustering scheme. Sample counts decrease drastically with the increase of ξ, especially at the low homologous level. A two-categories clustering scheme makes the sample counts abundant enough for statistical approach.
2.3. Construction of triplet substitution matrix
We attempted to construct the scoring scheme for the similarities among k-words. As parameter k is large, the resulting scheme would be more specific. But the corresponding sample counts per matrix element are lower, which results in difficult statistical analysis. A good tradeoff is the adoption of a residue triplet. In our approach, each protein sequence was treated as successive triplets of amino acids. In each of the 3-residues segment, two neighbors of the central residue were mapped into h/p letters. With the 2 × 20 × 2 = 80 letters alphabet set, protein sequences were rewritten into triplet sequence.
Generally, samples in a block are biased; in other words, many segments are closely related to each other. To reduce the bias, similar members were clustered within blocks, and each cluster was weighted as a single sequence in data counting. A parameter Θ% was specified as the threshold of sequence identity. Residue segments that are identical for at least that percentage were grouped together within a block. Consequently, one matrix characterizes the similarity of triplet among sequences below a certain homologous level.
It was considered that triplets in a column can substitute with each other in protein evolution. We counted all possible pairs of triplet substitutions in each column of every block. All these counts were summed. The result of this counting is a frequency table listing the counts for each of the 80 + 79 + .1 = 3240 different triplet pairs that occur in the BLOCKS9 database. The table was then used to calculate a matrix representing the log-odds ratio between these observed frequencies and those expected by chance.
We denote the total number of triplet pair i, j (1 ≤ j ≤ i ≤ 80) by fij. Then the observed probability of the occurrence of pair i, j is
The probability for triplet i to occur is then
The expected probability eij of occurrence of pair i, j is then pipj for i = j and pipj + pjpi = 2pipj for i ≠ j. An odds ratio matrix is calculated where each entry is qij/eij. The logarithm of odds ratio is defined as lod ratio, which characterizes the deviation of the sample counts observed in BLOCK9 from those of the background. We calculated the lod ratio in half bit units as sij = 2log 2(qij/eij), which is rounded to the nearest integer value to produce TripLEt SUbstitution Matrices with hydropobic and polar information (TLESUM hp Θ).
For more details on matrix deriving, see Henikoff and Henikoff (1992).
3. Results
In the TLESUM hp scoring scheme, the residue triplet is the unit of substitution. To the best of our knowledge, there is no similar scoring scheme; therefore, a direct comparison with existing methods is not possible. So we carried out a comparative evaluation of TLESUM hp by its performance in sequence alignment. The well-known BLOSUM62 matrix was used as a reference.
3.1. Multiple sequence alignment
Here we show the power of TLESUM hp in multiple sequence alignment by an example of single block motif search. We aligned a set of helix-turn-helix (HTH) proteins provided in 1993 by Lawrence (Lawrence et al., 1993). There are thirty sequences in this data set. Each of them contains a HTH motif for DNA-binding involved in gene regulation. It has been found that there is a 18-residue common pattern in every sequence. Due to the varieties in residue composition and position, however, it is a challenge to identify the common pattern with the sequence alignment approach.
In 2005, Zheng searched this common motif with the BLOSUM62 scoring scheme (Zheng, 2005). Using a center-star approach, two segments with high similarity score were defined as close neighbors. A motif was regarded as a group of close neighbors in which one member shares the greatest similarity with the rest of the members. Taking each sliding windows of width 18 from every sequence as a seed, the string most similar to the seed is searched in each sequence other than the one that the seed is in. Namely, for seed
According to Zheng's work, using BLOSUM62, 23 near neighbors (including one incorrect case) was found in TOP1 star tree, i.e., the tree formed by the near neighbors identified by the highest scored seed and the seed itself. By rewriting the residue sequence with the triplet alphabet set and employing the TLESUM hp 62 scoring scheme, 29 near neighbors (only one protein is omitted) are found by the TOP1 star tree of this center-star approach. And all these near neighbors are HTH motifs (i.e., true signals).
3.2. Secondary structure identification
Homologous proteins usually share the same protein fold. Therefore, the ability of a scoring scheme could be evaluated by its performance in identifying structurally identical protein sequences. It is expected that, in a set of segments collected by sequence alignment, a more sensitive scoring scheme will find a higher proportion of members that share the same conformation. Namely, at a similar level of false signal noise, a good scheme can identify more true signals.
To evaluate the performance of TLESUM
hp
62, we calculated the all-against-all pairwise similarity scores for 10-width segments in a nonredundant set. In this data set, 1612 nonmembrane proteins from PDB_SELECT25 (Hobohm and Sander, 1994) are collected, and no pair of sequences share sequence identity of more than 25%. Given two segments X and Y that have a similarity score
A similar approach was performed with BLOSUM62 matrix. At certain threshold TBLOSUM, we obtained the counts of TP and FP samples. Then by varying threshold
The results of secondary structure identification are shown in Figure 1. Compared with BLOSUM62, the improvement contributed by TLESUM hp 62 is remarkable. The TP counts increase 9.2-16.2%. As shown in the insertion of Figure 1, the FP/TP ratio decreases as TLESUM hp 62 is used. Furthermore, in the counts of FP, the cases with only tiny structural discrepancy increase 8.8–19.8%. For example, when the counts of FP is about 244000, the proportion of FP with single mismatch in secondary structure are 22027 and 18381 for TLESUM hp 62 and BLOSUM62, respectively. The present scheme achieved an increase of 19.8 percents. Therefore with an adoption of TLESUM hp 62 matrix, the population of pairwise segment alignment shifts towards the region with fewer mismatches.
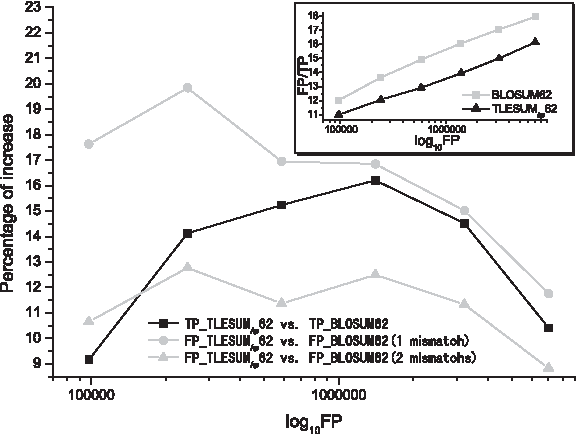
Results of secondary structure identification.
In a detail analysis of the improvement, we found that TLESUM hp 62 is more sensitive to samples at low identity level. As TBLOSUM = 23, in the TP segment pairs obtained by BLOSUM62, 44.4 percentages (38464/86601) of them have no more than 4 identical residues. Whereas, at a nearly equal FP level, 75 percentages (75474/100644) of TP samples collected by TLESUM hp 62 meet this low identity standard.
4. Discussion
We have constructed a series of triplet substitution matrices from the BLOCKS9 database. Since three-order residue-residue interaction is considered, these matrices are expected to be more sensitive. Improvements in sequence alignment, protein design, and protein structure/function prediction will be attained by existing methods after the modification of using TLESUM hp matrices.
Insertion or deletion is important for sequence alignment. As the size of TLESUM hp is about 16 times of that of ordinary matrices, it is not convenient to evaluate performance before a modification of the existing tools. But once a residue sequence is rewritten into triplet sequence, a gap can certainly be introduced. It does not matter whether a gap represents a triplet or a residue.
We found that, with the variety of sequence identity level, the propensity of the transitions among two coarse-grained residues of triplet (TCGRT) alters accordingly. For example, the effect of p*h to h*p transition can be evaluated by mean
As the extension of BLOSUM matrices, TLESUM hp should correlate with BLOSUM. But in a direct score comparison, there are various differences between the two types of schemes. In the BLOSUM62 scheme, the substitution score between F and W is 3 units (half-bits). As shown by the examples in Table 1, a mismatch of the TCGRT induces a notable score shift in the TLESUM hp matrices, though the central residues are identical. In TLESUM hp 62, the substitution score between hFh and pWp is −3 units. It has the maximum deviation compared to the 3 units evaluated by BLOSUM62 (i.e., a decrease of 6 units). Moreover, as shown in Table 1, the score deviation induced by sequence identity threshold Θ is obvious. So the complexity of comparison is beyond the reach of a simple observation. There is a need for mathematical analysis.
In each subunit, the score changes induced by miss matches of the two coarse-grained residues are notable. For example, when the two coarse-grained residues are matchable (hFh ↔ hWh, hFp ↔ hWp, pFh ↔ pWh, and pFp ↔ pWp; their scores are shown in bold), the substitution scores evaluated by TLESUM hp 62 are 4, 3, 3, and 2 units, respectively, in a similar level to the score C(F, W) = 3(units) evaluated by BLOSUM62 scheme. Otherwise, the scores deviate distinctly. As the scores of different TLESUM hp Θ matrices are compared, the changes are also notable. The top three high deviation cases between TLESUM hp 30 and TLESUM hp 95 are hFh ↔ pWp, hFp ↔ pWp, and pFp ↔ hWh, and are shown in italic.
To investigate the correlation between the two types of matrices, a theoretical approach—eigenvalue decomposition analysis—is applied to these matrices. According to this mathematical analysis, the components of a matrix can be ranked based on their significance. Different matrices can be compared by the most important components of them. In this way, the most significant similarity/dissimilarity among different matrices could be revealed. For a N × N real symmetric matrix M, the element of the matrix can be reconstructed as
where Mij is the element of the matrix in row i and column j, λα is the αth eigenvalue, and Vα, i is the ith component of the αth eigenvector,
After subtracting the mean of the corresponding matrix from each element, eigenvalue decomposition analysis is applied to each matrix. For matrix TLESUM
hp
Θ (
In the first eigenvector of TLESUM
hp
Θ (Θ > 30), for any central residue Ω, components of hΩp and pΩh are nearly equal. Taking the two components as references, there are obvious value shifts in the components of hΩh and pΩp, up and down, respectively. For each TLESUM
hp
matrix, the first eigenvalue is positive. As item
The “twilight zone” (Doolittle, 1986) is a crucial barrier to nearly all scientists who attempt to get information about protein structure and function by the sequence comparison method. Most protein pairs that have more than 30 out of 100 identical residues share similar protein structures (Sander and Schneider, 1991). Below this identity level, conventional sequence comparison methods often fail to align protein sequences. When two totally unrelated sequences composed of the 20 standard amino acids are aligned without any introduced gaps, random chance leads to about 6 percentages of identical residues (≪30%). And according to the observation of Rost, the emergence of the “twilight zone” seems not to be based solely on statistics (Rost, 1999). Although a detailed description of structural deviation in the “twilight zone” has been described by Chung and Subbiah (1996), the reason for its occurrence is still not clear.
Here we introduce Li's HP model (Li et al., 1996) to describe the cause of the “twilight zone.” In their model, a protein is treated as a self-avoiding chain of beads placed on a discrete lattice. Two types of beads are used to mimic polar (p) and hydrophobic (h) residues. The energy of a sequence folded into a certain structure is given by short-range contact interactions
where Δ(ri − rj) = 1 if beads ri and rj are adjoining lattice sites, but the two beads are not adjacent in position along the sequence, and Δ(ri − rj) = 0 otherwise; σi is either h or p. Depending on the types of beads in contact, the interaction energies are evaluated as Ehh = − 2.3, Ehp = − 1, or Epp = 0, corresponding to hh, hp, or pp contacts, respectively.
In Li's 2D model (Li et al., 1996), surrounding each bead of the core, there are two resultful neighbors that are not adjacent to the bead in position along the sequence. A bead pair have 22 × 22 kinds of surrounding neighbors in total. For neighbor type μ, we can calculate the energy
According to our analysis, interchange of h_p and p_h is recommended as sequence identity is >30%. As shown in Table 2, when they interchange with each other, only |ΔH| = 0 ∼ 0.6 rises in energy modification (|ΔH| = 0 ∼ 1.2 for 3D model). The tiny energy deviation does not impact homologous proteins significantly. Consequently, proteins tend to keep a similar structure. This is the reason that sequences at such an identity level are expected to have similar structure or function. But as sequence identity is less than 30%, interchange of h_h and p_p is favored. A large energy modification |ΔH| = 4 ∼ 5.2 is induced by such an interchange (|ΔH| = 8 ∼ 10.4 for 3D model). The low identity level further makes such mutations happen frequently. Due to the large impact on energy, difficulty in preserving protein structure is drastically increased. This can explain the occurrence of the so-called “twilight zone” for sequence homology.
In Li's two-dimensional HP model, every residue in the core have two resultful neighbors that are not adjacent to the residue in position along sequence. Two coupled sites have 24 kinds of surrounding neighbors. The impact for every neighbor category is presented here.
Details of the eigenvalue decomposition analysis of TLESUM hp matrices will be published elsewhere.
Footnotes
Acknowledgments
We are grateful to professor Lu-Hua Lai for her helpful discussions. This work is supported in part by the National Natural Science Foundation of China (no. 10704077) and National Basic Research Program of China (973 Program, grant no. 2007CB310504).
Disclosure Statement
No competing financial interests exist.