
Abstract
Abstract
Structural alignment is useful in identifying members of ncRNAs. Existing tools are all based on the secondary structures of the molecules. There is evidence showing that tertiary interactions (the interaction between a single-stranded nucleotide and a base-pair) in triple helix structures are critical in some functions of ncRNAs. In this article, we address the problem of structural alignment of RNAs with the triple helix. We provide a formal definition to capture a simplified model of a triple helix structure, then develop an algorithm of O(mn3) time to align a query sequence (of length m) with known triple helix structure with a target sequence (of length n) with an unknown structure. The resulting algorithm is shown to be useful in identifying ncRNA members in a simulated genome.
1. Introduction
Recently, a number of methods have been developed to compute the structural alignment between a query sequence with known structure and a target sequence with unknown structure. RSEARCH (Klein and Eddy, 2003) and FASTR (Zhang et al., 2005) are two software programs designed for the query sequence with regular structure. Matsui et al. (2005), Han et al. (2008), and Wong et al. (2009) also developed algorithms to solve the structural alignment problem that supports different types of pseudoknot structures. All these methods have an assumption that each nucleotide can interact with at most one nucleotide in the ncRNA. However, if tertiary interaction is considered, this assumption may not hold.
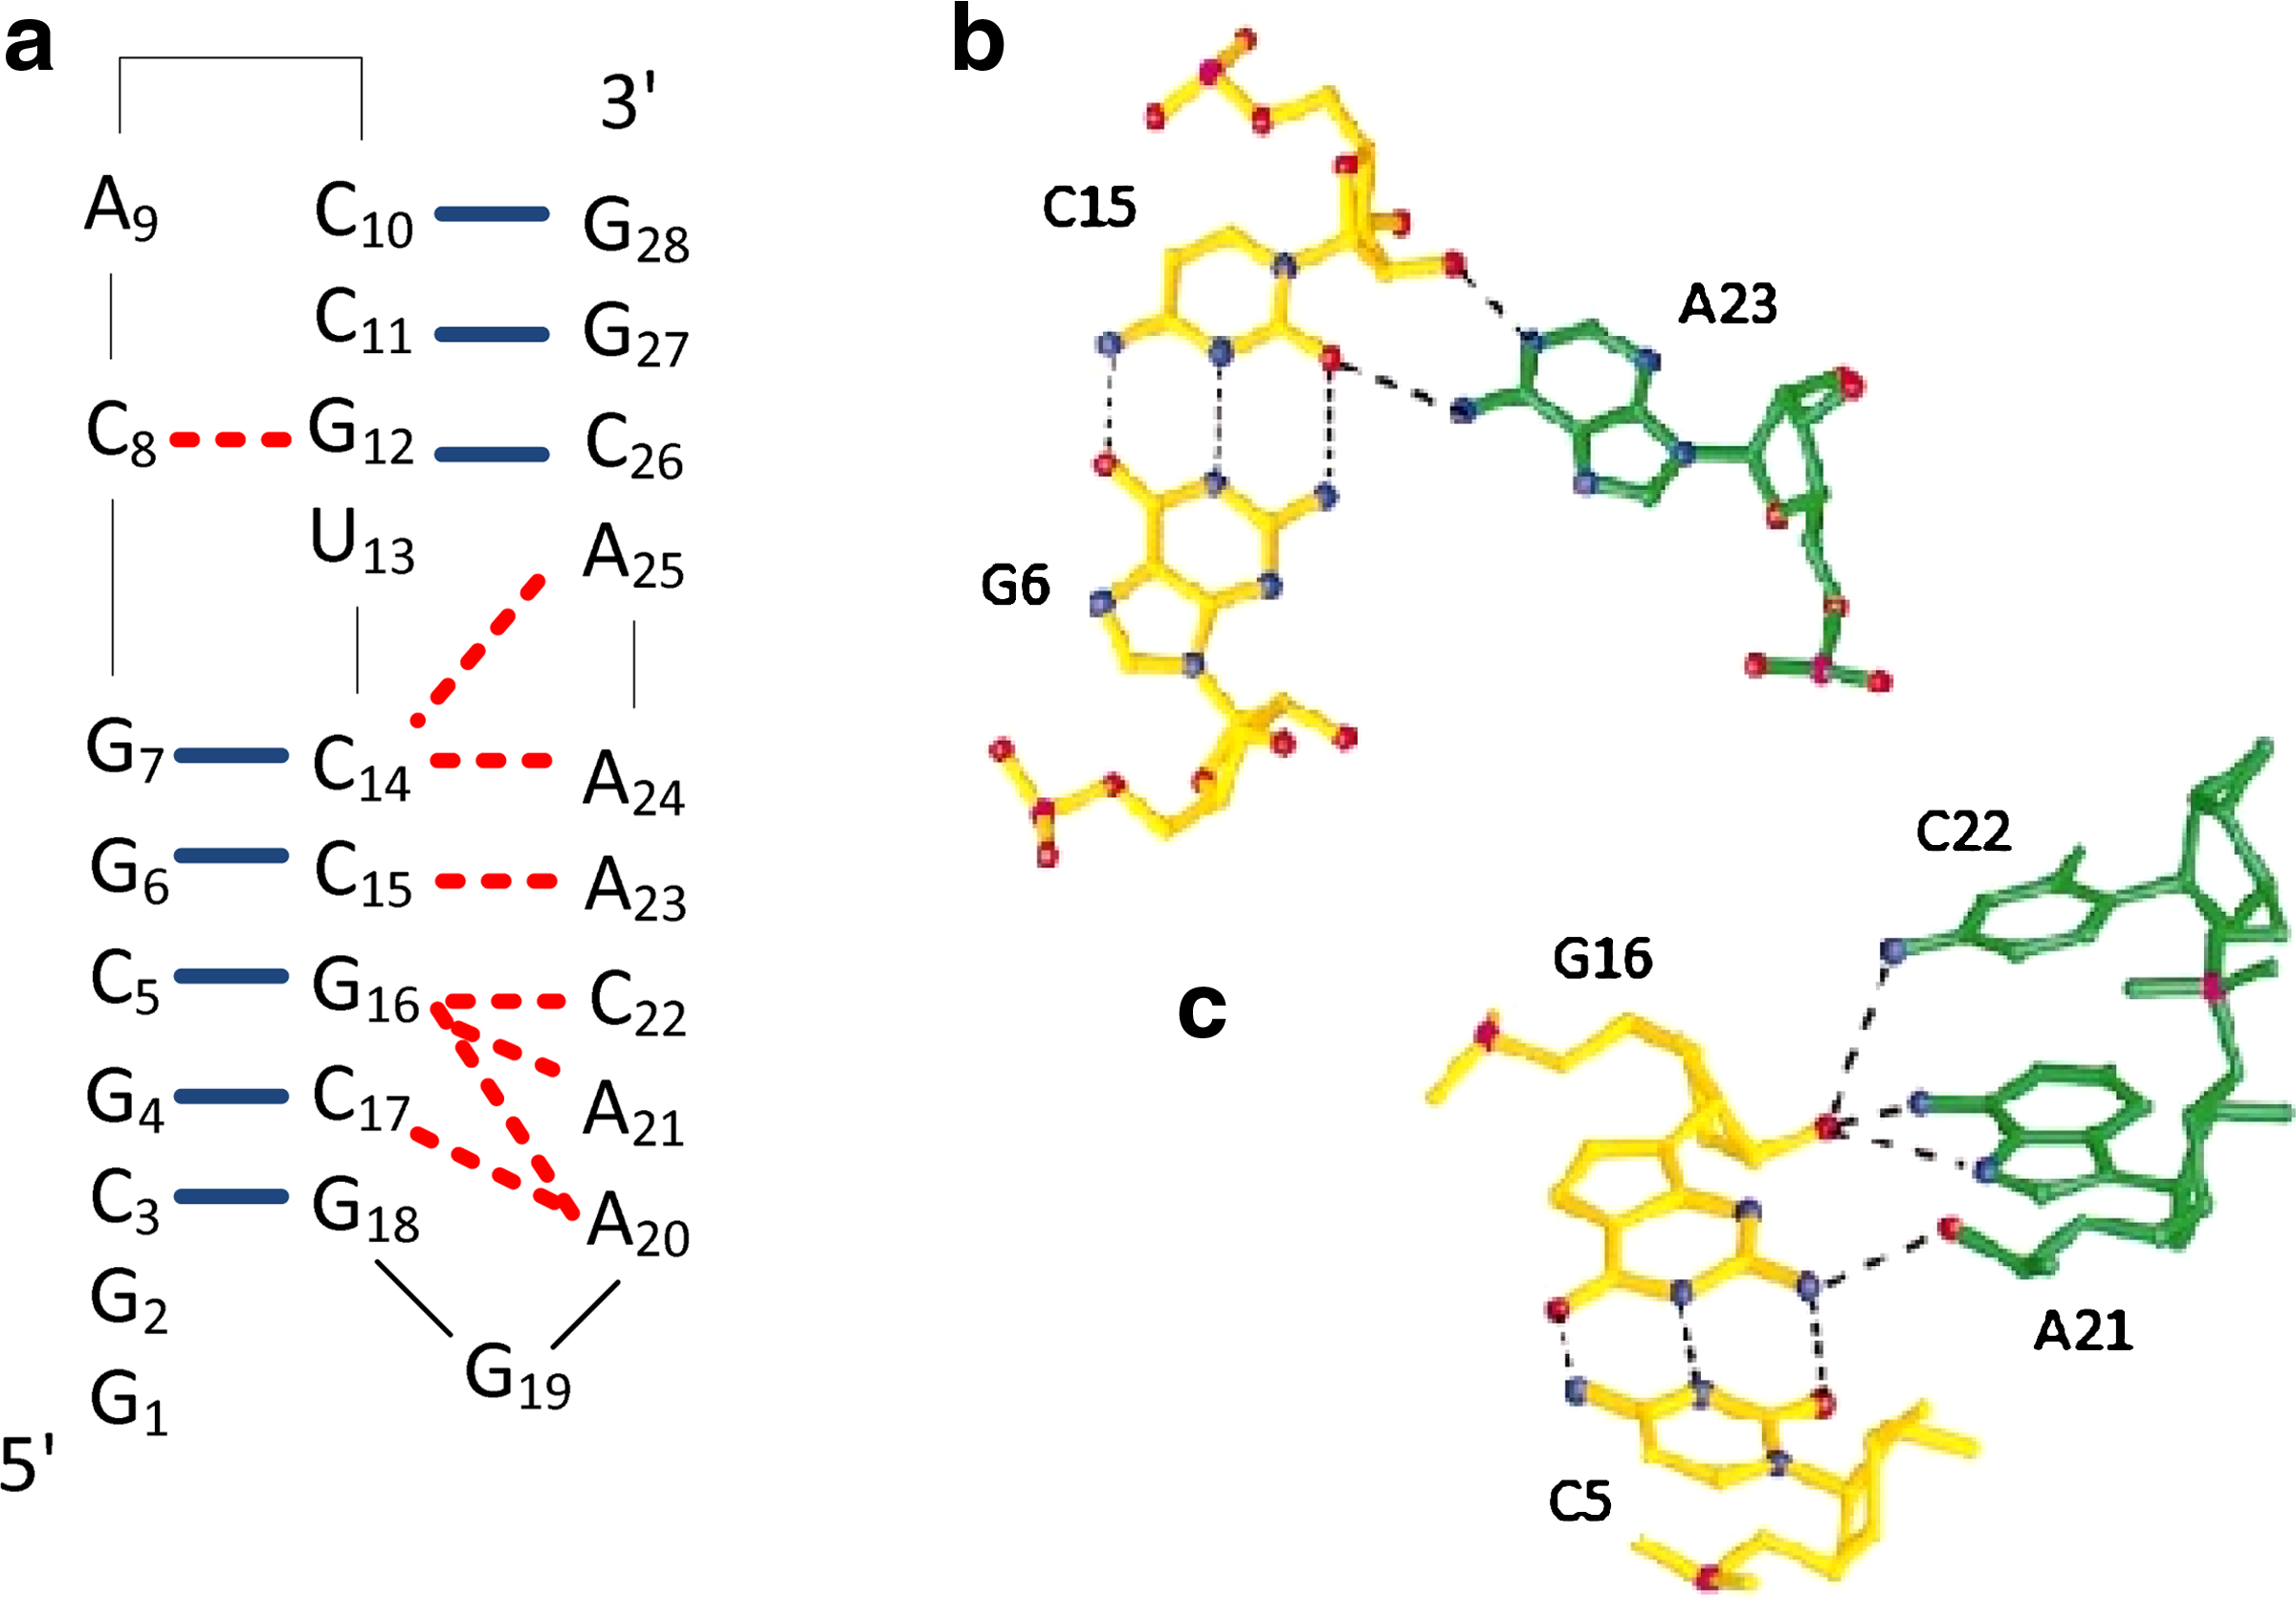
Triple helix structure considers tertiary interaction in the ncRNA. Inside the triple helix, some single-stranded nucleotides will form hydrogen bonds with nucleotides in base pairs. Figure 1 shows an example of a triple helix structure. Triple helix structure exists in yeast and human telomerase and the one in human telomerase also conserves in all vertebrates (Qiao and Cech, 2008, Chen and Greider, 2005, Theimer et al., 2005). Telomerase is responsible for adding specific sequence repeats to the ends of chromosomes and is important for maintaining telomere length and chromosome stability in stem cells, germline cells, and cancer cells (Chen and Greider, 2005). Qiao and Cech (2008) showed that breaking the tertiary interaction inside the triple helix structure of the telomerase will deteriorate the corresponding activity in vitro and shorten the telomere in vivo. On the other hand, triple helix structure also appears in the pseudoknot active in ribosomal frameshifting (Su et al., 1999). Frameshifting makes a shift in reading frames, causes the transcription process to skip the stopping codon and produces a single fusion protein. The tertiary interation between single-stranded nucleotides in the loop and base pairs in the stem (i.e., loop-stem interaction) is found to be essential for efficient frameshifting (Chen et al., 1995).
Since the tertiary interaction between single-stranded nucleotide and base pair (in short, we use “tertiary interaction” in the rest of the article) in the triple helix structure is important to the function of ncRNA, it is better to consider these tertiary interactions when performing structural alignment. In this article, we consider the structural alignment problem for triple helix structure. Based on the known examples of triple helix, we observe that one base-pair may interact with more than one single-stranded nucleotide, and one single-stranded nucleotide may also interact with more than one base-pair. Also, these tertiary interactions usually occur over a simple pseudoknot structure. Along with other observations, we try to provide a formal definition to capture the structure of a triple helix. We refer this as a standard triple helix structure. Then, we develop a structural alignment algorithm to align a query sequence with known triple helix structure and a target sequence with an unknown structure. Our alignment algorithm runs in O(mn3) time, which is the same as the time complexity of the alignment algorithm for simple pseudoknot structure described by Han et al. (2008), although we also consider the tertiary interactions inside the pseudoknot.
We implemented the algorithm and evaluated it based on a simulated genome. The results show that it is effective in identifying ncRNAs from the genome which are in the same family of a known ncRNA with triple helix structure. We remark that this is the first attempt to consider tertiary interactions in the structural alignment. The model we propose will not be the ultimate model for all triple helix structures. A more accurate model should be developed after more triple helix structures are known and studied.
2. Definitions
1. When a single-stranded nucleotide interacts with a base-pair, the single-stranded nucleotide may interact with one of the nucleotides in the base pair such as the example in Figure 1b or interact with both nucleotides in the base pair. For simplicity, we regard both cases equivalent and refer it as the interaction between the single-stranded nucleotide with the base pair. We denote it as (i, j) * k where (i, j) is the base pair and k denotes the single-stranded nucleotide. 2. A base pair may interact with more than one single-stranded nucleotide such as in Figure 1c, where (C5, G16) interacts with both A21 and C22. On the other hand, a single-stranded nucleotide may also interact with more than one base pair. 3. The underlying secondary structure of the base pairs is usually a simple pseudoknot or simple pseudoknot like. This is probably due to the stable nature of the simple pseudoknot structure. 4. Based on the underlying simple pseudoknot (Han et al., 2008) like structure, base pairs are divided into two groups (see the formal definition below). Each group spans a region in the sequence. The single-stranded nucleotides that interact with base pairs of a group are usually outside of its spanned region. 5. If the triple helix structure is drawn as in Figure 1a, that is, besides an edge between each base pair, a conceptual interaction edge is drawn from a single-stranded nucleotide to the closest nucleotide of the base pair that it interacts with, it is assumed that there is no crossing in all edges.
There are probably exceptions that do not follow our observations and assumptions, but not yet discovered. However, it may be reasonable to make these assumptions for the time being as a starting point for studying the structural alignment with triple helix structure. The standard triple helix structure is formally defined as follows.
Let
The secondary structure still obeys the rule that no two base pairs sharing the same position, i.e., for any
H = (M, P) is a standard triple helix structure, as illustrated in Figure 2a, if • For any two base pairs • R1 ∪ R2 = M. (R1, R2 form the simple pseudoknot structure) • For any • For any

There are three parts in the equation. The first part is the sequence similarity score between the two sequences. The second part is the similarity score of the base pairs which are not involved in tertiary interaction. The third part is the similarity score of the tertiary interactions. The problem is to find an alignment to maximize the score. Higher score represents higher similarity between the two sequences according to their sequences and structures. Also, if the score is high, then the alignment can reasonably reveal the triple helix structure of the target sequence.
3. Algorithm for Standard Triple Helix
In this section, we provide the details of our alignment algorithm for standard triple helix.
• All base pairs are either with both end points inside or outside the subregion, i.e., for any • If there exists tertiary interaction such that the base pair is inside the subregion but the single-stranded base is not, then the base pair is at the end point of the subregion (Fig. 2c), i.e., for any • Similarly, if there exists tertiary interaction such that the single-stranded base is inside the subregion but the base pair is not, then the single-stranded base is at the end point of the subregion (Fig. 2d), i.e., for any
Given a valid subregion R in S where R = R(S, v) and v = (a, b, c), in order to solve the problem by dynamic programming, we let the maximum valid subregion inside but smaller than R be
Lemma 1
Let v = (a, b, c). Given that R is valid, then if none of a, b, or c is a single base, then either (a, b) or (b, c) is a base pair.
Proof by contradiction
Assume that (a, b) and (b, c) are not base pairs. Since a and c are not single base, let (a, b′), (b″, c) be base pairs where b′, b″ < b (if b′, b″ > b, then R is not valid). Since b is not a single base, b should form a base pair with a′ ≠ a or c′ ≠ c which however will make R invalid (Fig. 3a). ▪

Region indicated by think lines are subregion R = R(S, v) where v = (a, b, c). Assume the subregion R is valid.
Lemma 2
If none of a, b, c is a single base and say (a, b) is a base pair, then
Proof
If c is not a single base, there exists a base pair (b′, c) where b′ < b. As shown in Figure 3b, since there cannot exist c′ > c that interacts with (a, b) (otherwise R would not be valid),
The following lemmas focus on the cases that one (say a) of a, b, c is a single base. Lemmas 3 and 4 consider the cases when only a is a single base. Lemma 5 considers the case when a, b are single bases and c can be a single base or not. Lemma 6 considers the case when a, c are single bases but b is not. Note that the situation is similar when c is a single base. If b is a single base, then one can refer to Lemma 5.
Lemma 3
If a is a single base and (b, c) is a base pair, then
Proof
Since the conditions that (1) a interacts with (b′, c′) where b′ < b and c′ > c and (2) (b, c) interacts with a′ where a′ > a cannot occur together (Fig. 3c),
Lemma 4
If a is a single base but both b and c are not single base and (b, c) is not a base pair, then
Proof
Since c is not a single base and (b, c) is not a base pair, there exists a base pair (b′, c) where b′ < b. Also there exists a base pair (a′, b) where a′ > a because the base pair (b, c′) where c′ > c does not exist (otherwise R is not valid). Thus a cannot interact with any base pair (b″, c″) where b″ ≤ b and c″ ≥ c (Fig. 3d). Thus
Lemma 5
If a and b both are single bases (c can be a single base or not),
Proof
since b is a single base and it cannot interact with any base pair according to the definition of standard helix,
Lemma 6
If a and c (but not b) are single bases, then
Proof
Since b is not a single base, if a base pair (a′, b) where a′ > a exists, then
The above lemmas consider all situations and the following theorem gives the conclusion.
Theorem 1
Given a valid subregion R in S where R = R(S, v) and v = (a, b, c), at least one of the five possible cases (i.e. (I) v′ = (a, b, c + 1); (II) v′ = (a + 1, b, c); (III) v′ = (a, b − 1, c); (IV) v′ = (a + 1, b − 1, c); and (V) v′ = (a, b − 1, c + 1)) must be satisfied.
Let R = R(S, (a, b, c)) and R′ = R(T, (p, q, r)), we also define Cz(R, R′) where
The value of B(Rx, Ry) can be computed recursively. Assume that R(S, (a, b, c + 1)) is a valid subregion (i.e., Case I), there are three situations to consider. (1) MATCH—aligning base c of S with base r of T; (2) INSERT—insert a space on S; (3) DELETE—delete the base c from S. Lemma 7 summarizes these cases.
Lemma 7
Given a valid subregion R = R(S, (a, b, c)) in S and a subregion R′ = R(T, (p, q, r)) in T, if R(S, (a, b, c + 1)) is a valid subregion (i.e., Case I), then B(R, R′) = max{MATCH, INSERT, DELETE}, where
For the MATCH case, if (a, b) is a base pair and interacts with c, then there are two situations: (1) (a, b) of S aligns with (p, q) of T. Then B(Rx, Ry) is the sum of CLP(R(S, (a, b, c + 1)), R(T, (p, q, r + 1))), the sequence score between S[c] and T[r], and the score of tertiary interaction between (a, b) * c of S and (p, q) * r of T; (2) S[a] or S[b] (or both) aligns with space. Then B(Rx, Ry) is the sum of DLP(R(S, (a, b, c + 1)), R(T, (p, q, r + 1))) and the sequence score between S[c] and T[r] score. If (a, b) is not a base pair or (a, b) does not interact with c, then B(Rx, Ry) is the sum of B(R(S, (a, b, c + 1)), R(T, (p, q, r + 1))) and the sequence score between S[c] and T[r]. For the INSERT case, if T[p] aligns with a space, then B(Rx, Ry) is the sum of B(R(S, (a, b, c)), R(T, (p + 1, q, r))) and the sequence score between T[p] and space. The situation is similar when T[q] or T[r] aligns with a space. For the DELETE case, B(Rx, Ry) is the sum of B(R(S, (a, b, c + 1)), R(T, (p, q, r))) and the sequence score between S[c] and space.
The situation when R(S, (a + 1, b, c)) is valid (i.e., Case II) and R(S, (a + 1, b, c)) is valid (i.e., Case III) are similar. The following lemma shows how to compute B(Rx, Ry) when R(S, (a + 1, b − 1, c)) is valid (i.e., Case IV).
Lemma 8
Given a valid subregion Rx = R(S, (a, b, c)) in S and a subregion Ry = R(T, (p, q, r)) in T, if R(S, (a + 1, b − 1, c)) is a valid subregion (i.e., Case IV), then B(Rx, Ry) = max{MATCH, INSERT, DELETE}, where
For the MATCH case, if (a, b) is a base pair and interacts with c, then there are two situations: (1) c of S aligns with r of T. Then B(Rx, Ry) is the sum of (a) CR(R(S, (a + 1, b − 1, c)), R(T, (p + 1, q − 1, r))), (b) the sequence score between S[a] and T[p], and between S[b] and T[q], (c) the score of base pair between (a, b) of S and (p, q) of T, and (d) the score of tertiary interaction between (a, b) * c of S and (p, q) * r of T; (2) S[c] aligns with space. Then B(Rx, Ry) is the sum of DR(R(S, (a + 1, b − 1, c)), R(T, (p + 1, q − 1, r))) and the sequence score between S[a] and T[p] and between S[b] and T[q]. If (a, b) is a base pair but does not interact with c, then B(Rx, Ry) is the sum of (a) B(R(S, (a + 1, b − 1, c)), R(T, (p + 1, q − 1, r))), (b) the sequence score between S[a] and T[p] and between S[b] and T[q], and (c) the score of base pair between (a, b) of S and (p, q) of T. Finally, if (a, b) is not a base pair, then B(Rx, Ry) is the sum of B(R(S, (a + 1, b − 1, c)), R(T, (p + 1, q − 1, r))) and the sequence score between S[a] and T[p] and between S[b] and T[q].
For the INSERT case, it is the same as the INSERT case in Lemma 7.
For the DELETE case, there are three situations: (1) only S[a] aligns with a space. Then B(Rx, Ry) is the sum of B(R(S, (a + 1, b − 1, c)), R(T, (p, q − 1, r))) and the sequence score between S[a] and space, and between S[b] and T[q]. (2) only S[b] aligns with a space. Then B(Rx, Ry) is the sum of B(R(S, (a + 1, b − 1, c)), R(T, (p + 1, q, r))) and the sequence score between S[b] and space, and between S[a] and T[p]. (3) both S[a] and S[b] align with spaces. Then B(Rx, Ry) is the sum of B(R(S, (a + 1, b − 1, c)), R(T, (p, q, r))) and the sequence score between S[a] and space, and between S[b] and space.
The situation when R(S, (a, b − 1, c + 1)) is valid (i.e., Case V) are similar. The following lemma shows how to compute CL(R, R′) for Case I.
Lemma 9
For case I - if R(S, (a, b, c + 1)) is a valid subregion, then
For the MATCH case, base c of S aligns with base r of T. Then CL(R, R′) is the sum of CL(R(S, (a, b, c + 1)), R(T, (p, q, r + 1))) and the sequence score between S[c] and T[r]. For the INSERT case, a space is inserted on S. Since CL(R, R′) requires base a of S aligns with base p of T, we consider two situations: (1) T[q] aligns with a space; and (2) T[r] aligns with a space. If T[q] aligns with a space, then CL(R, R′) is the sum of CL(R(S, (a, b, c)), R(T, (p, q − 1, r))) and the sequence score between T[q] and space. The situation is similar when T[r] aligns with a space. For the DELETE case, the base c is deleted from S. CL(R, R′) is the sum of CL(R(S, (a, b, c + 1)), R(T, (p, q, r))) and the sequence score between S[c] and space.
The lemmas for other cases (i.e., Cases II, III, IV, and V) and the calculations of CR, DL and DR are similar.The following lemma shows how to compute DLP(R, R′) for Case I.
Lemma 10
For case I - if R(S, (a, b, c + 1)) is a valid subregion, then
DLP(R, R′) requires S[a] or S[b] (or both) to align space. For the MATCH case, DLP(Rx, Ry) is the sum of DLP(R(S, (a, b, c + 1)), R(T, (p, q, r + 1))) (which also requires S[a] or S[b] or both to align space) and the sequence score between S[c] and T[r]. For the INSERT case, since it requires S[a] or S[b] (or both) to align space, when T[p] aligns with space, DLP(R, R′) is the sum of DLP(R(S, (a, b, c)), R(T, (p + 1, q, r))) and the sequence score between T[p] and space. The situation is similar for T[q] aligning with space and T[r] aligning with space. For the DELETE case, DLP(R, R′) is the sum of DLP(R(S, (a, b, c + 1)), R(T, (p, q, r))) and the sequence score between S[c] and space.
The lemmas for other cases (i.e., Cases II, III, IV, and V) and the calculations of CLP, CRP and DRP are similar.
To fill the dynamic programming table, not all recursive decompositions of S need to be filled. For a given triple v = (a, b, c) such that R(S, v) is a valid subregion, we can define a function ζ(v) to determine for which subregions in S, we need to fill the corresponding B, C, and D entires.
Let v* = (1, x2 − 1, x2). We only need to fill in the entries for B, C, and D provided that v* can be obtained from v by applying ζ function repeatedly. Intuitively, ζ guides which recursion formula to use. And there are only O(m) such v values. The following lemma summarizes the time complexity for this algorithm.
Lemma 11
For any sequence
4. Experimental Results
An important application is to identify the ncRNAs of the same family with standard triple helix structure along the genome. By inputting a query ncRNA sequence (Q) and its secondary structure, the program can scan a long DNA sequence (T) and output the score for every region in T. A higher score indicates that the sequence and the structure of the region are more similar to those of Q. We performed the experiment as follows: we selected three ncRNA families—RF00024, RF01050, and RF01074—from the Rfam 9.1 database. These families contain a triple helix inside the structure. The corresponding common triple helix structure of each family can be deduced from Chastain and Tinoco (1992), Chen and Greider (2005), Qiao and Cech (2008), and Su et al. (1999). For each family, we extracted the triple helix region of one of the seed members (in the Rfam 9.1 database, for each family, there is a set of reliable members which are regarded as seed members) as a query sequence. To demonstrate the power of structural alignment, the triple helix region selected has the lowest sequence similarity with the triple helix region of the other members. Then we created several long random sequences with different percentages of GC content to simulate different regions in a real genome, and we embedded all the whole ncRNA sequences (seed members or non-seed members) of the family (including the sequence of which the triple helix region has been chosen as query sequence) into this long random sequence in arbitrary positions. The resulting sequence is our T. For every region in T with length similar to that of the query sequence,1 we compute the structural alignment score of the region and the query sequence. The details of the families including the sequence selected as the query, the length of the triple helix region of the sequence, and the number of members in each family are given in Table 2.
We assume that regions other than the triple helix region of the real members of the family are false hits as they are likely either not to be members of the family or not the helix regions of the members. Figure 4 shows the distribution of the alignment scores of the true hits (real members) and false hits for all the three families. To compute the effectiveness of our method, we set a threshold as the maximum score of the false hits. We assume that the method finds a real hit if the score of the region is larger than this threshold. Thus a real hit will be missed if the computed score is smaller than or equal to this threshold. We also try different thresholds and the results are similar. Table 1 summarizes the results. Our method can exhibit high sensitivity. For the families RF01050 and RF01074, our method can identify the triple helix region of all the ncRNA sequences along the genome. The sensitivity is 100%. While for the family RF00024, our method can locate 113 out of 117 regions and the sensitivity reaches 96.6%. Figure 4 shows the distribution of the alignment scores of the true hits (the triple helix regions of the real members) and false hits. It is quite clear that the real members can be distinguished from the false hits except that there are four missed out of 117 real hits in the family RF00024. Therefore, the method can reliably locate not only the family members along the genome with varying % of GC content but also the triple helix region from the ncRNA sequence.

The distribution of our alignment scores of true hits and false hits for the families RF00024, RF01050, and RF01074 for 50% and 75% GC-content random sequence.
There is no existing software available freely for performing structural alignment for triple helix structures. In order to show the effectiveness of using triple helix structures on identifying ncRNAs, we compare our algorithm with two methods: BLAST and PAL (Han et al., 2008). When performing alignment, BLAST only considers the sequence similarity, while PAL considers both sequence and secondary structure similarity, but not the tertiary interactions. Thus we would like to compare the effectiveness of these methods. We use default parameters for BLAST except that the wordsize is set to 7 to increase its sensitivity. For each family, we use the same query sequence and the random sequence T as in the above experiment.
Table 3 summarizes the comparison between our result, PAL's result and BLAST's result. Among 117 members of RF00024, we missed four members while PAL and BLAST both missed five members. Among 10 members of RF01074, we did not miss any member, while PAL also did not miss any members for the genomes with 50% GC content but it missed 6 members for 75% GC content, and BLAST missed six members for both genomes with 50% and 75% GC content. It seems that our algorithm performs better than PAL (which considers both sequence and secondary structure but not tertiary interaction) and PAL performs better than BLAST (which only relies on sequence similarity).
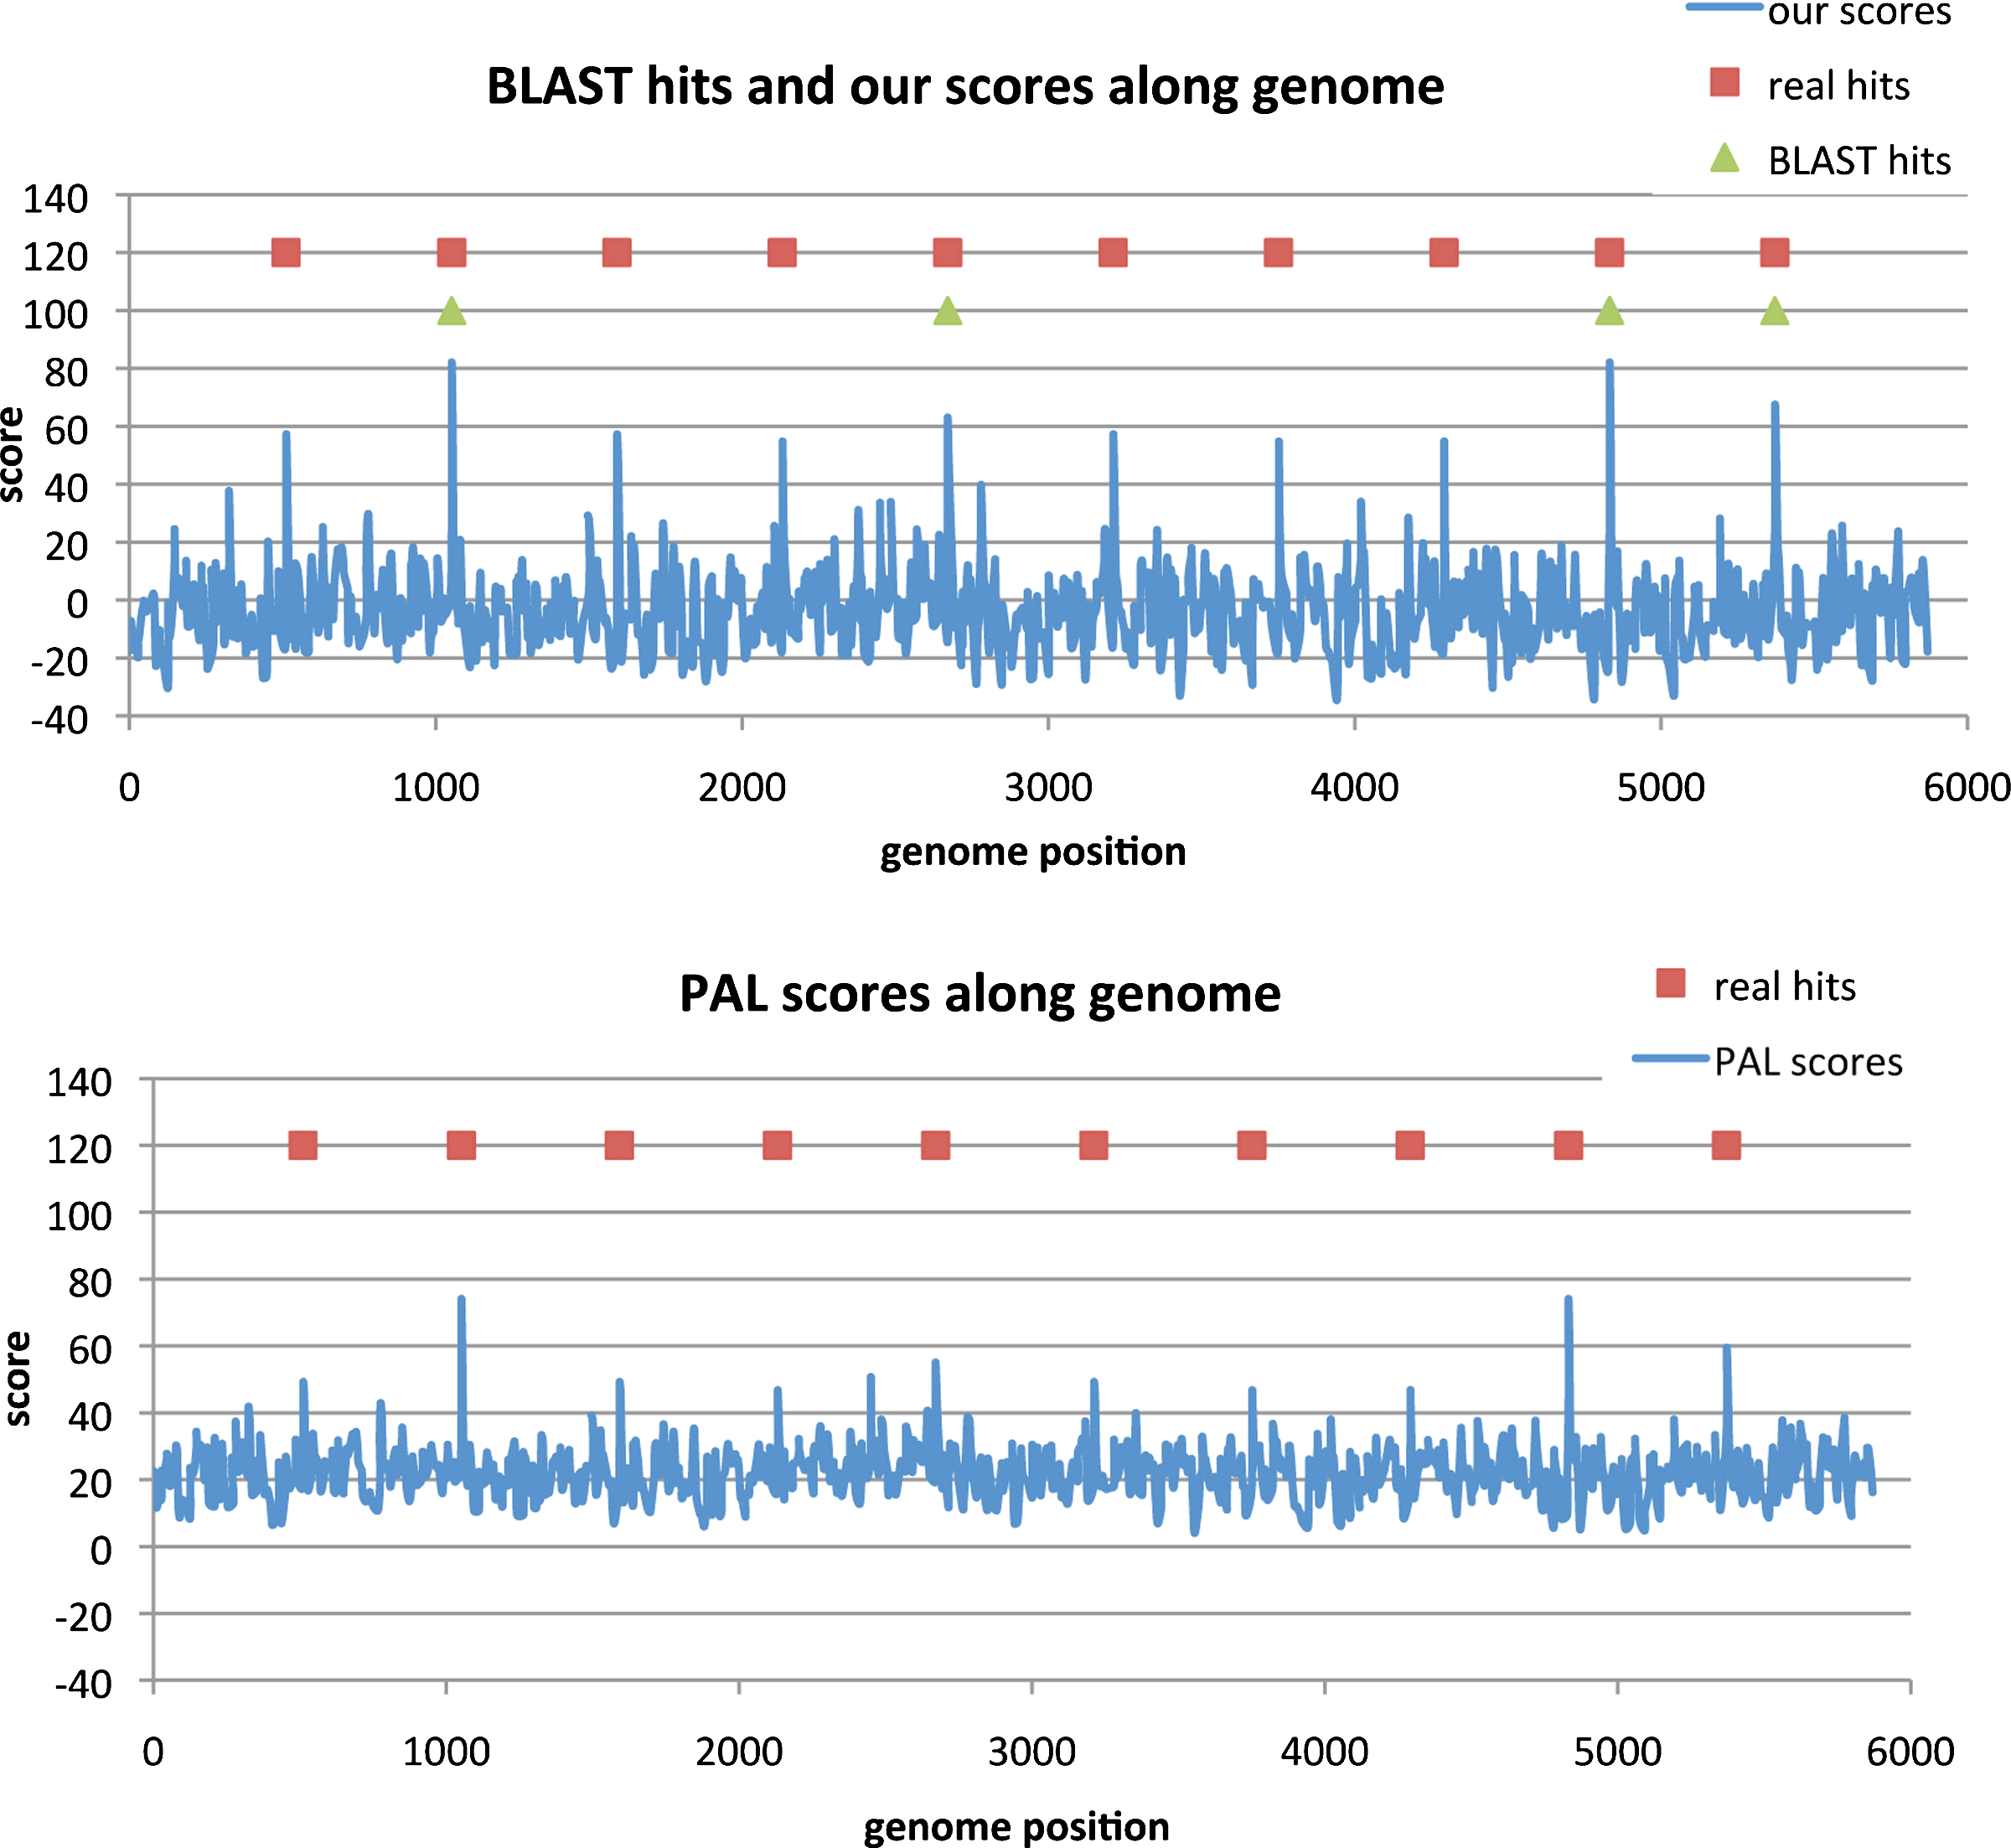
Figure 5 shows the comparison between the distribution of our scores and PAL scores. It seems that our algorithm is able to increase the gap between the scores of real hits and the scores of false positives. Figure 6a shows the detailed scores for our method and BLAST for family RF01074 along the genome with 75% GC content. Among 10 members, BLAST missed six of them. However, all the regions of these 10 members got the highest scores if using our algorithm and thus none of them is missed. To take a closer look at the missing cases for BLAST, we found that the missed sequence is usually not similar to the query sequence only based on sequence similarity while the corresponding structure is similar to that of the query sequence. And the sequences that are found by both tools indeed are similar to the query based only on the primary sequence. This provides evidence showing that only considering primary sequence similarity may not be good enough. Figure 6b shows the detailed scores for PAL for family RF01074 along the genome with 75% GC content. There was a false positive with score 50, and only four members with scores higher than 50. Thus, PAL missed six of 10 members. So, considering both the primary sequence and the secondary structure but not the tertiary structure may also miss some of the true hits.
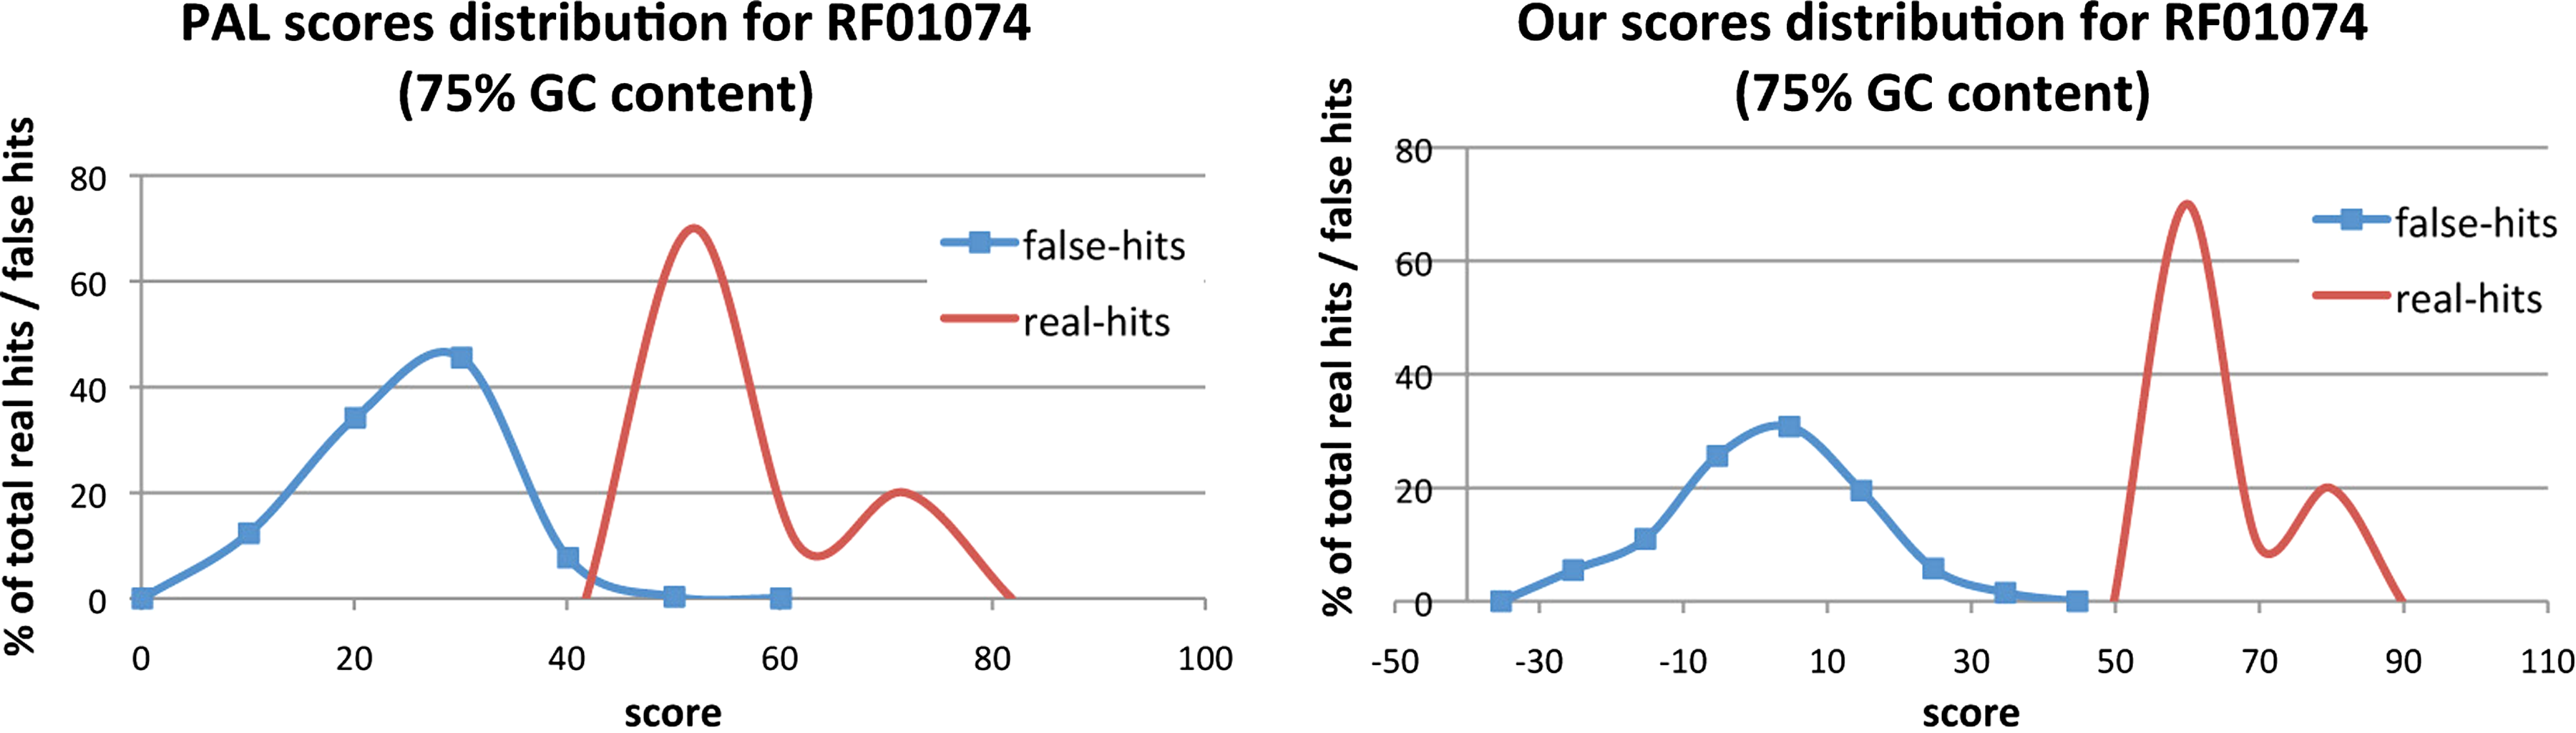
Comparison the distribution between PAL scores and our scores for the families RF01074 for 75% GC-content random sequence.
In our experiment, we set the threshold according to the scores of the real hits and the false hits. In the real situation, it may be the case that the true and the false hits are not known in advance. A simple approach is to use a certain percentage of the maximum possible score as a threshold. The maximum possible score is the score when the query sequence is aligned with a sequence exactly the same as the query. According to our experiment, we found that setting the threshold as 35% of the maximum possible score can provide a reasonable result (Table 4). For RF00024, the sensitivity can reach 97%, while the specificity is 99%. For RF01050 and RF01074, the sensitivity can reach 100%, while the specificity is at least 90%. A more in-depth study should be carried out to derive a better method to set the threshold (e.g., use a similar method based on e-value as suggested by Klein and Eddy [2003]).
Figure 7 shows an example of the deduced triple helix structure for a target sequence. Given a query sequence with standard triple helix structure from the family RF01074 and a target sequence (which is a member in RF01074), according to the resulting alignment between the query and the target outputted by our method, the triple helix structure of the target can be deduced (Fig. 7), and the resulting structure is consistent with the structure stated in Rfam.
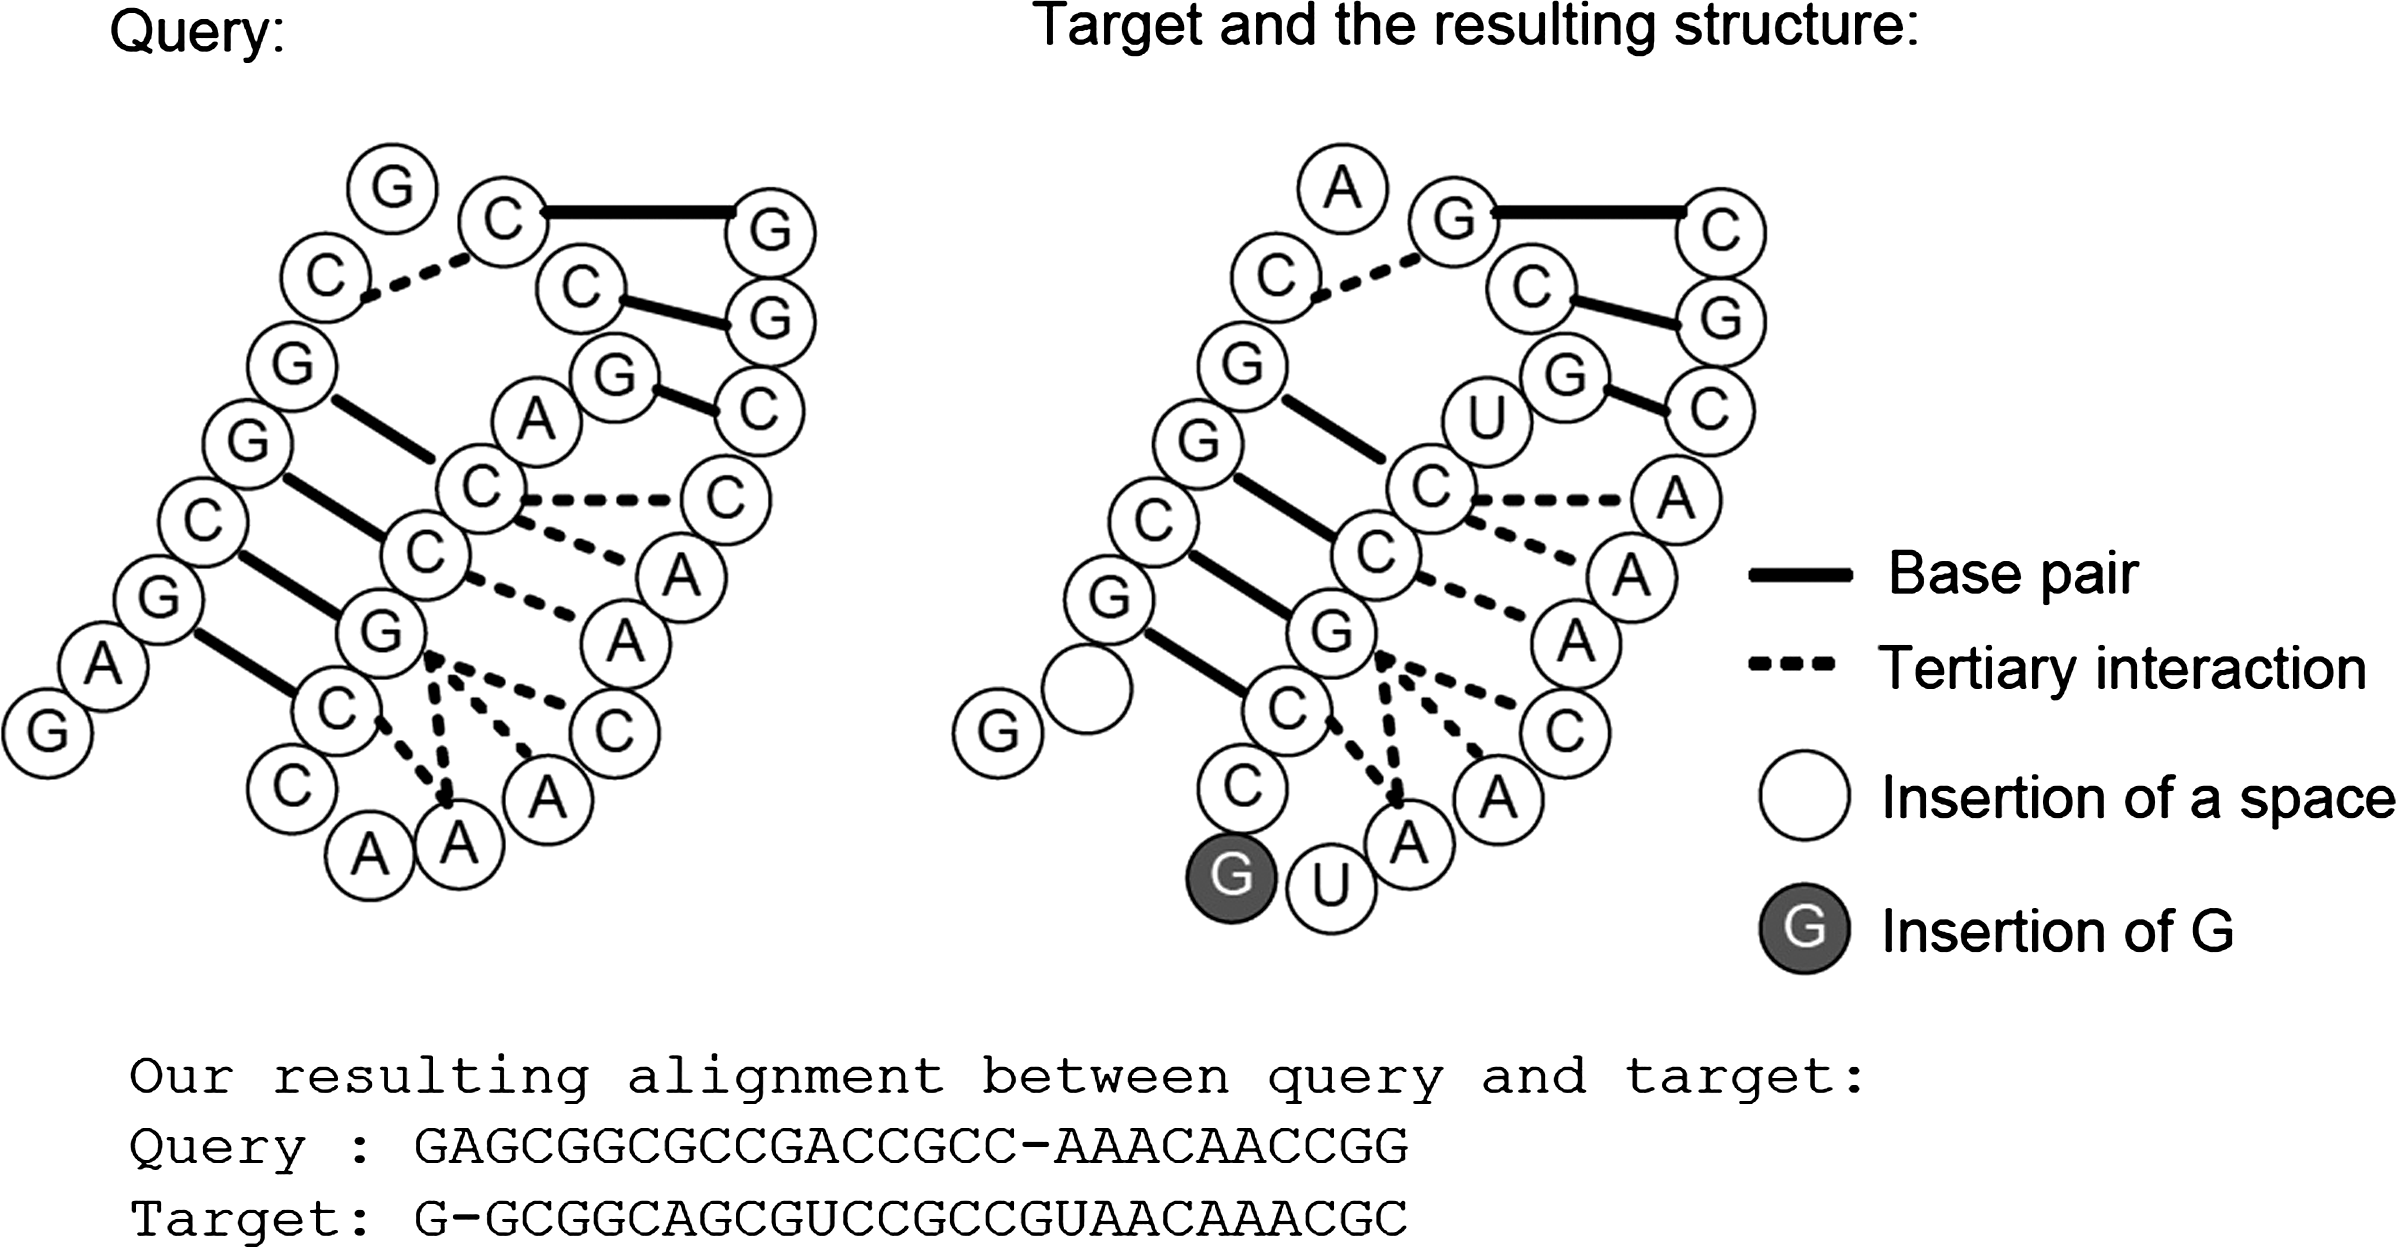
An example of the resulting triple helix structure for a target sequence.
Regarding the running time (our machine has 8G memory and a dual-core 2.6-GHz CPU), for the query and target of length 120, PAL requires around 60 seconds, our method needs around 70 seconds, and BLAST needs only 1 second. BLAST runs the fastest while both our method and PAL use similar amount of time. Regarding the scores we use when aligning the tertiary interaction in the experiment, we set 1 mark for two aligned interactions if the corresponding base pairs and single-stranded nucleotides are found to be aligned in any family, otherwise a high penalty (e.g., −5) is given. The reason for the setting is to prevent the breaking of tertiary interaction due to the mutation of the bases. Further tuning on the scores should be carried out once we have a better understanding on the tertiary interactions. For base pair alignment, we use the same scoring scheme as in Klein and Eddy (2003).
5. Conclusion
In this article, we provided the first algorithm2 to handle structural alignment of RNA with standard triple helix structure and show that it is useful for detecting ncRNAs. Although there are only a few families in existing databases that have the information of triple helix structures, we expect that there will be more and more ncRNAs which contain this kind of structures. Thus, it is important to study these structures in details. Further directions include speeding up these algorithms, fine-tuning the model of triple helix structure, and considering other more complicated tertiary structures.
Footnotes
Acknowledgments
This research was supported in part by the General Research Fund (GRF) of the Hong Kong Government (HKU 719611E).
Disclosure Statement
No competing financial interests exist.
1
We set the length of each region equal to the length of the query plus 20.
2
We are informed that a new tool called TRFolder, which tries to solve a similar problem as in this paper, will be released soon. A detailed study on TRFolder as well as a comparison between our software and TRFolder will be needed in the future.