
Abstract
Abstract
Horizontal transfer (HT) is the event of a DNA sequence being transferred between species not by inheritance. This phenomenon violates the tree-like evolution of the species under study turning the trees into networks. At the sequence level, HT offers basic characteristics that enable not only clear identification and distinguishing from other sequence similarity cases but also the possibility of dating the events. We developed a novel, self-contained technique to identify relatively recent horizontal transfer elements (HTEs) in the sequences. Appropriate formalism allows one to obtain confidence values for the events detected. The technique does not rely on such problematic prerequisites as reliable phylogeny and/or statistically justified pairwise sequence alignment. In conjunction with the unique properties of HT, it gives rise to a two-level sequence similarity algorithm that, to the best of our knowledge, has not been explored. From evolutionary perspective, the novelty of the work is in the combination of small scale and large scale mutational events. The technique is employed on both simulated and real biological data. The simulation results show high capability of discriminating between HT and conserved regions. On the biological data, the method detected documented HTEs along with their exact locations in the recipient genomes. Supplementary Material is available online at www.libertonline.com/cmb.
1. Introduction
The phenomenon is ubiquitous among prokaryotes, implying mainly the transfer of genes (coding sequences) and is termed horizontal gene transfer (HGT) (Doolittle, 1999a; Koonin et al., 2001; Nakamura et al., 2004; Ochman et al., 2000). The existence of HTEs in non-coding sequences was less investigated; however, see Liu et al. (2004). Similarity between sequences has been primarily attributed to conservation and, thus, putative functionality (Bejerano et al., 2004; Siepel et al., 2005). However, similarity can naturally be caused by an event of horizontal transfer (HT), when not a particularly conserved sequence (say, non-coding sequence) is transferred. The very fact of the transfer in such cases may suggest some function of the transferred sequence.
HT has a fundamental evolutionary importance as it turns the traditional tree-like evolutionary history into an evolutionary network (Doolittle, 1999a,b; Wolf et al., 2002). Genetically, HT is a primary source of new genes that are acquired by bacteria and archaea and often result in adaptations to new environments and conditions (Daubin and Ochman, 2004). Therefore, identification of HT can shed light on many significant evolutionary processes that cannot be explained by the traditional tree-like approach. From the medical perspective, HT is a substantial factor by which bacteria develop resistance to antibiotics (Ambur et al., 2009; Chen and Novick, 2009; Koonin, 2009).
Currently, there are two prevailing methods for detecting HT. The phylogeny-based approach takes a relatively large set of homologous (originated from a common ancestor) coding sequences, construct their corresponding phylogeny, and contrast it to the phylogeny of their originating species. When conflicts are found between the two trees, they are reconciled by introducing HTEs (Delwiche and Palmer, 1996; Jin et al., 2007; Daubin et al., 2003; Beiko et al., 2005; Lerat et al., 2003). While this approach has the advantage of identifying relatively old events, it is incapable of coping with events residing in non-homologous regions. Moreover, the approach is based on a very stringent assumption of where to seek the events. Finally, it also requires alignment of the sequences and inferring a reliable species tree (two major problems by themselves (Linder and Warnow, 2005).
The composition-based approach contrasts genomic sequences of different compositional structure such as G + C content, dinucleotide frequencies or codon usage biases, striving to infer different origins (Karlin, 2001; Nakamura et al., 2004; Ochman et al., 2000; Ochman, 2003; Garcia-Vallve et al., 2000). This approach suffers from the fact that the species involved might share similar compositional patterns. Moreover, the length of a HTE may be too short to reliably reveal these differences. As concluded in Lawrence and Ochman (2002) and Wang (2001), “atypical G + C content and pattern of codon usage are not reliable indicators of horizontal gene transfer events.”
A recent work, DarkHorse (Podell and Gaasterland, 2007) combines these two approaches by incorporating phylogenetic information into the sequence based search. However, it aims at protein, annotated data, and is parameter dependent as we discuss below. Concluding this part, there is no gold standard for HT detection and each approach can be used either to detect unknown cases or verify rival approaches (Podell and Gaasterland, 2007).
In this work, a novel technique is introduced for identifying putative horizontally transferred sequences between two organisms. It operates in the sequence space and has no similarity to the two previously outlined approaches. It rather complements these approaches and bypasses their drawbacks. The inserted fragment “defines” a HTE-environment where similarity between the copied fragment at the donor and the inserted fragment at the recipient, is very high, whereas the corresponding flanking regions at both genomes, are base-wise unrelated (with respect to the HTE-environment; Fig. 1). Naturally, we are not interested in very old HTEs where the contrast at the HTE borders is not clearly visible. A conclusive identification of these cases is problematic. The goal is to distinguish between three types of inter genomic fragments' similarity: (1) random similarity—one that is expected to occur by chance considering the evolutionary distance between the two genomes; (2) similarity by functional conservation—within a whole family; and (3) HTEs (and rare formally similar events).
The technique proposed is not confined only to events between a donor and a direct recipient, as the donors of HTEs have not necessarily survived or their genome is not fully sequenced. Rather, it can also detect HTEs in two recipients in cases of insertion sequences (IS) or plasmids, as well as HTEs between a recipient and a close relative of the donor.
We assume a rate of point mutations that is, at the order of magnitude, approximately fixed along the time course and even across different species of the same family (Doolittle et al., 1996; Gu, 1998; Kumar and Subramanian, 2002). Although there are many biological examples of rate acceleration during evolution (Jensen-Seaman et al., 2004), these do not violate the model as it deals with different orders of magnitude. This constant rate induces a measure of dissimilarity between different species that is proportional to the time since divergence. In the mathematical derivations of this work, the simple but powerful Jukes-Cantor model of sequence evolution (JC) (Jukes and Cantor, 1969) is used. Note, that this simplification is not necessary for the detection itself, as demonstrated in the Results section, but rather for the approximate dating of events.
We now give a brief, general overview of the algorithm: Given two genomes with their lengths, one can calculate the expectancy of each identical region's length. This gives a measure of confidence as to exceptional similarity. Next matching seeds for putative HT are identified such that their size is chosen to have very low probability of having occurred by chance (based on the evolutionary distance between the two genomes). This stage filters out random similarities (but not conserved regions). We comment that filtering random similarity has also appeared in other HGT works, (Darling et al., 2004), although with no rigor. In order to uniquely detect HTEs, we rely on the statistical, as well as biological (Omelchenko et al., 2003), property that a HTE normally is not inserted exactly in its homologous (orthologous) counterpart location. This implies that the flanking regions of a HTE are non-homologous (Fig. 1), strictly distinguishing it from conserved regions. Therefore, a special sliding window algorithm is used to detect these HTE borders, searching for sharp borders (or walls). Finally, as events with non-homologous flanking regions may also be a result of some rare cases of large scale mutational events (e.g., a very conserved region is duplicated or translocated), we discard any putative HTE appearing twice (or more) in a genome.
The method was applied to a set of simulated data as well as to real bacterial genomes. The simulation studies produced a challenging data with a large proportion of conserved regions and multiple HT events. We are interested in HTEs of gene size that is too short to convey some detectable statistical signal, therefore cannot be identified by traditional sequence-based techniques relying on CpG, codon usage, or alike (Karlin, 2001; Nakamura et al., 2004; Garcia-Vallve et al., 2000). Alternatively, a simple Blast search between the genomes does detect these short regions but along with hundreds of other conserved regions. In contrast to these two later approaches, our method demonstrates high capability of detecting these events (low false negative rate) but also filters out the regions where similarity is due to simple conservation. The sensitivity of the proposed method was also checked on known documented HT cases and supported by phylogenetic data. Very accurate locations of these events were found along with other potential HTEs. Comparison to other techniques (Podell and Gaasterland, 2007; Darling et al., 2004) was also done for the task of HT detection. The code is available by request from one author (S.S.).
2. Methods
2.1. Preliminaries
We consider a (evolutionary) model in which the nucleotides along a genome are identically and independently distributed (IID). The value of the nucleotide is the state (we sometimes use just “nucleotide” to denote its state). A single mutation (or just a mutation for short) is the event of a nucleotide changing its value to different one. An evolutionary model
and the probability to see a different nucleotide at a position,
We denote
A HT is the event of a subsequence of a genome, the donor genome, being copied and inserted at some position at another genome, the recipient genome. The right (left) border of a HT is a pair of indices indicating the right (left) endpoints of the HT segment at both genomes.
2.2. First level: perfect matches
Overview
We start here with an overview. In this part, we focus on modern HGT events, that is, recent events that have not yet been dissolved (heavily mutated) in the recipient genome. Consider the following (oversimplified) model: At time 0, some ancestral genome bifurcates into two identical genomes. Next, the two genomes start to accumulate mutations at an equal rate, constant over time, resulting in two contemporary genomes. Mutations are distributed randomly and uniformly along each genome. For the sake of clarity, we assume the following simplification that will be removed later: A position is mutated at most once over both sequences; that is, the same nucleotide is not mutated in both sequences and no two mutations at the same nucleotide at a given sequence. It can easily be seen that a mutated nucleotide cannot maintain its original state. Based on these assumptions, we can analyze the distribution of lengths of unmutated segments in both genomes.
Longest identical segment
We now formalize the idea outlined in the overview. We want to analyze the probabilities of seeing identical segments among the two genomes assuming the scenario above. Note that the time between the two genomes is twice the time since divergence so the “no transition” probability under the JC model (assuming rate α and time since divergence t) is
Now, since
Suppose we want to bound the probability of finding by chance one or more subsequences of length k at G2 (i.e., the right hand side of Equation (3)) by δ, then by substituting Ps and simple arithmetic we obtain that
Equation (4) shows the relationship between the probability of finding a perfect match (bounded by δ) and the length of this match (k). This probability is exponentially decreasing with the length of that match. Therefore, by calibrating the probability of finding matches by chance (by setting large enough k), we can eliminate finding matches by chance and this is the subject of the next part.
We end this part with an example: For two mammalian species mutating at an average rate of 2.2 × 10⁻⁹ (Kumar and Subramanian, 2002), diverged 6 million years ago (hence t = 12 × 106), we get “no transition” probability
Finding significant HTEs
The discussion above dealt with the task of how to decrease the probability of finding matches by chance. Our algorithm for detecting statistically significant HTEs starts by finding seeds of matches of length beyond reasonable probability (e.g., 0.01) of being found by chance. The algorithm builds the k-spectrum of one genome for large enough k. We now move sequentially (left to right) over the other genome. Every k-mer in this genome is checked against the k-spectrum to find k-matches (identical segments of length k). Finally k-matches are expanded (obviously only forward, since backward matches were already found), until a mismatch is found and then reported.
2.3. Second level: coping with mutations
The previous section dealt with probabilities of non-mutated segments as a means for detecting HTEs between two segments. The algorithm in that part finds seeds of identities in both genomes. These seeds are identical regions in the genomes with small likelihood of being created by chance. This section extends the scope to deal with HTEs that underwent mutations. First, we argue that the probability for some seed to be detected is fairly high. Next, the Butterfly algorithm, that extends these seeds over regions where similarity is not complete but very high, is introduced. Therefore, one goal of the Butterfly is to bridge between neighboring perfect match segments of a horizontal transfer. More importantly, the main goal of the Butterfly is to distinguish between HTEs and similarity by conservation as will be detailed in the sequel.
Sufficient conditions for seeds detection
After a HT event has occurred, the HTE is exposed to mutations. HTEs that have occurred sufficiently long time before present are dissolved in both genomes by accumulating mutations in the copied segment, so their similarity diminishes and therefore cannot be identified. In the previous section, a long enough seed was required to discard random matching. However, due to mutations over a too long time since the HTE event, there might not be long enough seeds (as explained above). Therefore, we say that a HTE survives if some k-match is found between the two segments corresponding to it in the two genomes. Our algorithm will fail already in the seeds stage if no seed will be found. This is equivalent to the case when every consecutive k nucleotides in the HTE have at least one mutation. The likelihood of this case is fairly low for relatively recent events.
Given a known mutation rate α, we want to determine what is the age
Let

The HTE H is segmented to
The probability of having a k-match at some Hj is
From Equation (5), we get
The Butterfly algorithm
We now describe the Butterfly algorithm, which is the heart of the method and serves to locate the HTE borders as well as to discriminate HTEs from conserved regions. We start with an overview of the algorithm. When a segment is inserted to a genome, it creates a HTE-environment. In this environment, the similarity between the copied fragment at the donor and the inserted fragment at the recipient, is very high. However, beyond the borders of the HTE the corresponding flanking regions at both genomes, are base-wise unrelated. Now, suppose we color regions of high similarity by blue and regions of low similarity by red. Hence, we define the notion of a Butterfly to capture the intuition that when the Butterfly sits on a HTE border, one wing is red and another is blue. More formally, a (single) wing of the Butterfly is a pair of sequences of a specified length at two specified positions in the two genomes. The Butterfly has two adjacent, equally long, sliding windows, the end of the left wing is the starting position of the right one. These are the Butterfly's wings. The Butterfly travels along the two genomes by moving sequentially the two adjacent sliding windows, seeking for high contrast between the wing colors. The right mismatch score, is the relative number of mismatches between the two segments of length ℓ composing the right wing. Similarly, the left mismatch score, is when the comparison is done between the ℓ positions composing the left wing.
Alternatively, the mismatch score is the normalized Hamming distance between the two segments in the wing/sliding window.
Procedure Butterfly(p1,p2,ℓ,τ)
The Butterfly works similarly to the expansion stage of BLAST (Altschul et al., 1990) by trying to expand a seed to both sides. Its stopping conditions are however different. It starts at a (perfect match) seed found by the exact matching algorithm. Then it moves to the right one position at a time and compares the mismatch score between the two windows. The wall of a Butterfly is the difference between the mismatch scores of the two wings. The Butterfly stops when it finds a wall greater than some threshold parameter τ. (Fig. 3). After encountering a wall at the right, the process repeats from the seed to the left (now the mismatch at the right wing is subtracted from the mismatch at the left).

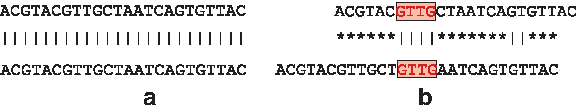
A butterfly starting at positions 19, 13 in the lower and upper genomes resp. The wings are of length 8. This is a right border of seven nucleotides HTE (accumulated one substitution), hence the right mismatch score is
As two string matching algorithms, the BLAST and the Butterfly are similar. However, BLAST is not geared to detect sharp walls appearing at the HTE borders. Indeed, BLAST will detect many conserved regions and will not distinguish between conserved regions and HTEs (cases (2) and (3) above).
Following is the formal algorithm:
The goal of the Butterfly is to locate the borders of a HTE. Assuming we are proceeding rightward, this occurs when the HTE border is exactly between the two wings, such that the right wing is completely outside the HTE and the left wing is completely inside it. Since the two processes under consideration—random similarity at the right (outer) wing and mutation rate at the left (inner) wing—are stochastic, we augment the Butterfly with two parameters to handle the noise generated by these processes. In order to have enough confidence in the decision to stop, the butterfly needs to “see” enough information. A very strong signal but with low confidence can result from too short wings (e.g., a 100% wall resulting from two mismatches at the right wing and two matches at the left can be pure noise). This is controlled by the wing lengths parameter ℓ. On the other hand, the wall threshold parameter τ, controls the stopping condition: A too low threshold can stop the Butterfly prematurely at a false wall inside the HTE. Figure 4 illustrates both scenarios.

Wall values of a simulated HTE-environment of length 50 (middle of figure between the two peaks). As can be seen, wing of size 8 produces a smaller signal to noise ratio compared to wing's size 16 hampering the identification of the HTEs border and consequently HTEs identification. Also note that a too small threshold value τ can lead to a false early wall identification inside the HTE as a result of noise (mutations) inside the HTE. (Remark: the wall on the right side is calculated oppositely to the left wall by moving the sliding windows leftward.)
Since the segments beyond the HTE border are base-wise uncorrelated (i.e., non-homologous), the expected relative mismatch score outside of the HTE is
2.4. Third level: discriminating conserved regions
We define a conserved region as two homologous segments in G1 and G2 with similarity above
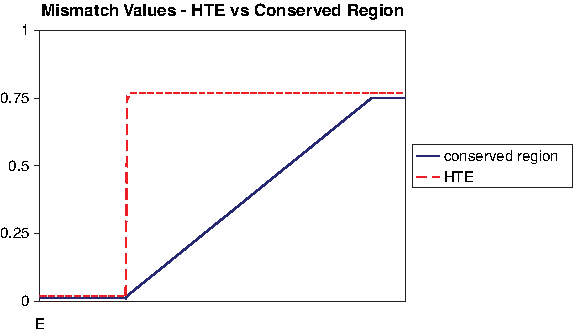
While the mismatch value at HTE border jumps abruptly from 0 (or nearby values) to
The above implies that, if the Butterfly starts at a seed corresponding to a conserved region, it might not hit a wall and might run through excessive regions with expected mismatch of
Accounting for large-scale mutational events
Large-scale mutational events (also denoted as genome rearrangement events) are events in which large genomic fragments are either copied or moved to other location in the genome. These events are denoted as duplications and translocations, respectively. Note that in such events, the flanking regions of the copied fragment and the flanking regions of some homologous fragment at another species, are not homologous between themselves, creating a spurious wall. Our method accounts for this as follows: if the translocation event is old enough, there were enough mutations in the homologous segments at both genomes, preventing a seed (first level) to be found in them. If the event is recent, then the translocated fragment is divergent enough from its homolog at the other genome, preventing a seed again. The only case where a seed is detected is when a conserved (in contrast to a ordinary non-conserved) region has been copied recently. To account for this case, we discard all cases where a putative HTE has a similar copy in the genome. The only case that cannot be detected is when a very conserved fragment is being translocated; this however is very rare and cannot be detected by any other method.
3. Results
The method is implemented in software, one program for the seeds (exact match) stage and another for the Butterfly, both in C. A simulation study was conducted in which artificial genomes and HT events were generated. The simulation's results were plugged into our equations in order to set the algorithms parameters. Subsequently, known biological HTEs were analyzed and located in their host genomes. Finally, the method was applied to raw genomes, and our findings were compared with known annotated data.
3.1. Simulation study
The simulation study was performed to evaluate the performance of the new method. The goal was to evaluate the capability of the method to detect HTEs and to discriminate between HTEs and conserved regions. We first clarify the setting. Equation (6) gives a bound on event ages for which we are likely to find seeds. We can not guarantee detection of the events above this age. Also, recall that distance between genomes is irrelevant as regions flanking a HTE are base-wise uncorrelated (expected similarity
Simulated datasets
The r8s (Sanderson, 2003) software was used to produce random birth-death trees (i.e. random topology and branch lengths) over 20 taxa. In order to have enough divergence time between any two species, we normalized branch length to a minimum of d = 0.2 yielding a distance of d = 0.4 between any two species, where d = 3αt (see distance definition in Methods).
In order to obtain bounds on random similarity we need to convert this distance to the parameters of Equation (1). Normally, distance d is defined as the expected number of substitutions and under the JC model this is 3αt. Plugging this into Equation (1) yields
Next we used Seq-Gen (Rambaut and Grassly, 1997) to evolve sequences according to the JC model, based on the trees generated in the previous step. The sequences were generated on the tree under two modes: normal rate of evolution corresponding to non-conserved regions and slow rate of evolution corresponding to conserved regions. The two sub-segments were concatenated into a segment and the whole process recurred several times to form a conserved/non-conserved alternating genome. Such a type of input generates a large number of putative seeds in the first stage, and the challenge is to discriminate between them and real HT events. Note that a simple similarity-based HT detection algorithm (e.g., Blast) will falsely report on a suspected HTE for every conserved segment between closely related sequences (in a relatively small subtree).
Now, a set of HT events was generated, several copies each. Every copy was inserted at a random location along a randomly chosen sequence (genome) generated at the previous stage. To simulate age of events (so that the inserted sequences acquire mutations in their host genome), we again used Seq-Gen with a star topology, uniform edge lengths tree as a model tree. Edge length (tree depth) varied randomly but in a much shorter range in comparison to the model species tree. Using Equation (6) (limiting age of HT events as a function of HTE length ℓ
h
, detection confidence δ and rate of mutation α), if we set the HTE length ℓ
h
= 2000, then WHP (δ ≤ 0.1) we can trace HTEs of distance
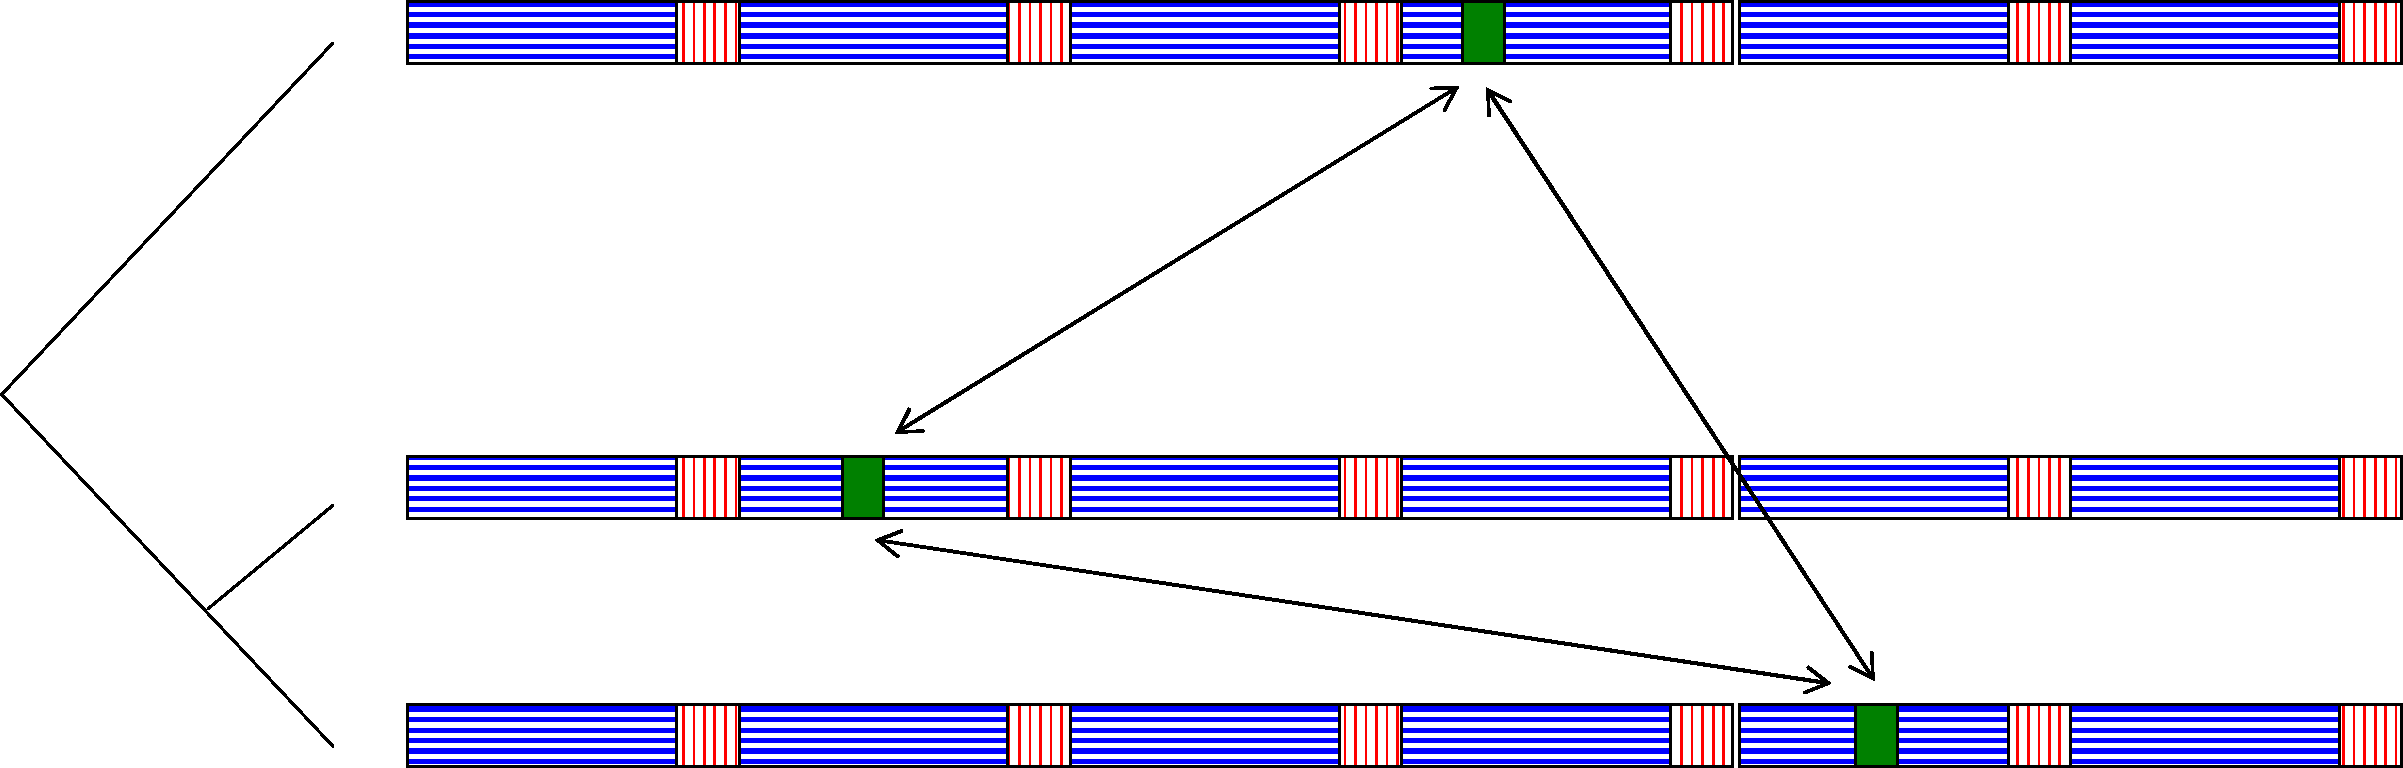
A simulated input of three genomes with alternating conserved/non conserved regions, evolved along the tree in the left with three copies of a single HT event inserted at random positions.
Simulation results
As was said above, the goal was to measure the effect of false positive/negative (FP/FN) as a result of varying number of event copies. The number of HTE pairs was counted (this is simply

False positive (lower solid line, absolute values) and false negative (upper dashed line, percentage of number of events generated) as a result of the number of HTE copies per event. Top: A single HT event. Bottom: Four HT events.
3.2. Real data results
The results with simulated data described above show that when the time of event is relatively recent, the method detects it with high probability. Moreover, the very low FP rate shows the power of the method in filtering out false seeds resulting from conserved regions. In its current form, our implementation does not handle effects caused by indel events as they create artificial walls.4
Nevertheless, bacterial genomes are comprised mainly from coding material which is less affected by indels. On the other hand, they exhibit high rate of HT activity and therefore are a perfect fit for demonstrating the concept behind the new method.
We started with demonstration of performance of the new method as a tool for detecting and locating the exact borders of the events. We chose an annotated HTE in the form of an insertion sequence IS53 (accession number M83932). Using Blast, we found it in two species of Pseudomonas: Pseudomonas stutzeri (accession number NC_009434) and Pseudomonas syringae (accession number NC_004578).
In P. stutzeri, the IS was matched in two locations, one at 673486.675897 (see Fig. S1 for blast output on P. stutzeri). Hence, we applied our software to these two genomes, seeking to find HTEs with clear borders. The technique identified this insertion and located the exact right (downstream) border of this insertion event (i.e. position 675897; see Butterfly output on these two genomes in Fig. S1). As transposable elements are known to be major vehicles for HT, the above finding testifies on suitability of the technique for detection of HT.
Moreover, this setting of differentially located segments in two genomes fits as input for other techniques for HGT detection relying on the same characteristics. Techniques relying on protein, or protein coding, sequences (Garcia-Vallve et al., 2003, 2000; Podell and Gaasterland, 2007; Karlin, 2001; Nakamura et al., 2004; Ochman et al., 2000; Ochman, 2003) are immediately ruled out, leaving only techniques operating on raw DNA sequences. The best known is Mauve (Darling et al., 2004), which, like ours, seeks for seeds in the first stage but does not employ criteria similar to the Butterfly on the second stage. Indeed, Mauve could not distinguish well between conserved elements and HTEs and produced mixed output (Fig. S1). This should be compared to the well filtered output of the proposed method. Even a detailed search for the specific event of IS53 with appropriate resolution failed: it was not detected (Fig. S1).
Several highly homologous gene pairs were accurately detected as well with different (non-homologous) flanking sequences (genes alaT, pgsA, ppsA, and purL of lengths 700–3900 bp). The accuracy of our method with respect of locating the sharp borders, as compared by the location and length to NCBI RefSeq, is shown in Table 1. These gene pairs appear as differentially translocated in P. stutzeri and P. syringae genomes. The horizontal transfer from one of the genome to another, or from a third party is not excluded as well. Since this work is geared to developing a method for detection of putative HTE, the detailed analysis of the detected elements, with involvements of other genomes will be a subject of a separate study.
The next task was to locate and verify well-documented cases of HTE in bacteria. We started with a HT event in Borrelia (Barbour et al., 2005). The genes hpt, purA and purB appear in the genomes of two species B. hermsii and B. miyamotoi, agents of human relapsing fever, but not in other species of the Borrelia genus (e.g., B. burgdorferi and B. garinii). In Barbour et al. (2005), the authors concluded that these genes were acquired by a horizontal transfer from an unknown donor at some time after diversification of Borrelia from their common ancestor. The possibility of gene loss at the other species was discarded by maximum parsimony arguments. They also constructed the gene trees for the purA and purB genes over sets of 34 and 36 representative species respectively. By these trees, one likely candidate donor would be Fusobacterium nucleatum. Indeed, according to our calculation among 32 protein-coding genes, within 40 kb around the purA of B. hermsii (accession number NC_010673), the genes purA and purB show the largest sequence identity seeds (34 and 22 bases, respectively) when compared to the genome of Fusobacterium (accession number NC_003454). That is, application of our method of searching for the HTE to the pair of the genomes (B. hermsii and Fusobacterium) suggests that the above genes appear, indeed, to be horizontally transferred to B. hermsii. As to the possible donor, the likely candidate is Fusobacterium: the sequence similarity of the three genes between the two species B. hermsii and B. miyamotoi was found to be 88%, whereas similarity between each of these and the respective genes in Fusobacterium is only 69%. Under the assumption that the donor is a close relative of Fusobacterium, this suggests that the HGT event has occurred before the speciation event of the B. hermsii and B. miyamotoi.
One more well-documented case of HT event is the transfer of a 2.5-kb segment that includes gene bioF from Neisseria meningitidis and Haemophilus influenzae RD (Kroll et al., 1998). At the exact match stage, we found four seeds of length 193, 132, 100, and 100. The extension of these by the Butterfly algorithm resulted in a single HTE of length 2547 at locations 1697161–1699708 and 1621851–1624398 in the Neisseria and the Haemophilus genomes respectively (Fig. S1). We note that this is in full accordance with the original observation of Kroll et al. (1998).
4. Discussion
4.1. Conclusion
In this study, we attempted at a desirably rigorous description and handling of horizontal transfer events. Specifically, we introduced the matching seeds idea to sort out random matches. The next level copes with mutations inside the HTE, implemented by the sliding window of the Butterfly algorithm. At the top level, we distinguish HTEs from natural conserved regions by requiring “high walls” between the Butterfly wings.
This article lays out the rigorous statistical/algorithmic groundwork for this new approach. While this seemingly restricted problem of finding HTEs between two genomes might appear simple, in fact it is key to a broader research where a group of organisms is studied. The proposed procedure and software can serve as a subroutine applied to all pairs in the group and therefore run in time quadratic in the group size. By our experiments, for groups of size of a hundred organisms, this should take not more than a day.
The examples on real data serve as a proof of concept for this new approach rather than a thorough search for HTEs among all published pairs of genomes. Moreover, as described in the Introduction and demonstrated in the Results, an extensive benchmark between our method and all existing HT detection methods is problematic as each operates on different inputs, uses different assumptions and aims at other goals. Instead, in the Borrelia case, we showed how a combination with a complementary method, the phylogenetic approach, endows further information on the event.
Our work operates in the sequence space. Mutational events in the sequence space are divided into small-scale mutational events (which are point mutations) and large-scale mutational events (such as duplications, translocations, and HT). There are many articles examining the sequence space, and even beyond—in the phylogenetic space. While these works handle separately each type of event, ours combines these two types of events: small scale and large scale. We believe this novel combination is interesting and potentially important.
4.2. Future research
The research presented here gives rise to several future research directions that we intend to investigate. We list them below. The first question is: Is HT a widespread phenomenon in non-coding sequences, those with no obvious functionality, and if so, among particular regions? Previous studies on HT mainly focused at coding regions (ORFs), and therefore this question has not been investigated sufficiently. A positive answer to this question can add another layer to the growing field of searching functionality in non-coding regions. Our next question is: Is the behavior of the mutational process present in HTEs? Can we infer by it the age of the event? In particular, Amelioration (Lawrence and Ochman, 1997; Ragan, 2001) is a process by which a gene that was transferred horizontally acquires features (e.g., GC content, the percentage of nitrogenous bases on a DNA molecule which are either guanine or cytosine) similar to its new environment. This is particularly true for recent events as this process diminishes in time and therefore relevant to our work. If the mutational process accelerates at HTEs, then calculation of events age should take this in considerations.
Finally, we ask: Are there common patterns of HT among different families? Specifically, horizontal transfer was found also in plants (Bergthorsson et al., 2003) and Archaea (Matte-Tailliez et al., 2002). As the method introduced here can readily be applied to higher organisms, as we showed in our hypothetical example on two mammalians, we intend to use it to seek for HTEs among these families.
Footnotes
Acknowledgments
S.S. is supported by the Young Scientists Fellowship of the Yeshaya Horowitz Association through the Center for Complexity Science.
Disclosure Statement
No competing financial interests exist.
3
We stick to the time-rate notation as it allows further flexibility in other models.
4
This can be overcome by joining adjacent segments found by the Butterfly.
References
Supplementary Material
Please find the following supplemental material available below.
For Open Access articles published under a Creative Commons License, all supplemental material carries the same license as the article it is associated with.
For non-Open Access articles published, all supplemental material carries a non-exclusive license, and permission requests for re-use of supplemental material or any part of supplemental material shall be sent directly to the copyright owner as specified in the copyright notice associated with the article.