
Abstract
Abstract
One strategy to identify transcription factor binding sites is through motif finding in upstream DNA sequences of potentially co-regulated genes. Despite extensive efforts, none of the existing algorithms perform very well. We consider a string representation that allows arbitrary ignored positions within the nonconserved portion of single motifs, and use O(2 l ) Markov chains to model the background distributions of motifs of length l while skipping these positions within each Markov chain. By focusing initially on positions that have fixed nucleotides to define core occurrences, we develop an algorithm to identify motifs of moderate lengths. We compare the performance of our algorithm to other motif finding algorithms on a few benchmark data sets, and show that significant improvement in accuracy can be obtained when the sites are sufficiently conserved within a given sample, while comparable performance is obtained when the site conservation rate is low. A software program (PosMotif ) and detailed results are available online at http://faculty.cse.tamu.edu/shsze/posmotif.
1. Introduction
In addition to using information from the given upstream sequences, recent approaches utilize additional information, including the use of evolutionary relationships between orthologous upstream sequences through the phylogenetic footprinting technique (Blanchette et al., 2002), the inclusion of negative samples to define discriminative motifs (Sinha 2003), and the use of binding energy models and structural knowledge (Kaplan et al., 2005; Leung et al., 2005). To investigate the relationships between motifs, the single motif finding problem has also been generalized to the identification of composite motifs and cis-regulatory modules (Marsan and Sagot, 2000; van Helden et al., 2000; GuhaThakurta and Stormo, 2001; Liu et al., 2001; Eskin and Pevzner, 2002).
While most approaches that use the string representation either allow mismatches (Pevzner and Sze, 2000; Pavesi et al., 2001; Buhler and Tompa, 2002) or use degenerate letters (Sinha and Tompa, 2002; Peng et al., 2006), other approaches also allow positions within a motif to be ignored, either by allowing spacers between motif segments (Sinha and Tompa, 2002) or by imposing density constraints to restrict the number of ignored positions (Wijaya et al., 2007). To improve motif finding accuracy, recent approaches incorporate nucleotide dependencies within motifs (Barash et al., 2003; Zhou and Liu, 2004; Chin and Leung, 2008).
We consider a string representation that allows arbitrary ignored positions within the nonconserved portion of single motifs of length l. For each combination of ignored positions, we use a Markov chain to model the background distribution while skipping these positions, resulting in a total of O(2 l ) Markov chains that can model long range nucleotide dependencies. This approach is more general than using a single positional weight matrix or using a single string to model a motif.
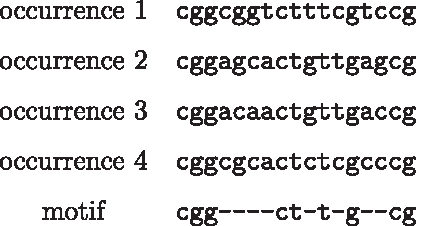
To obtain an algorithm to identify motifs of moderate lengths, we focus initially on positions that have fixed nucleotides to define core occurrences. This is based on the biological motivation that there are often almost invariant positions that are critical for the binding process. While most approaches do not specifically take advantage of these positions, our model tries to capture them within positions that are not ignored.
In this article, we compare the performance of our algorithm to other motif finding algorithms on a few benchmark data sets, and show that significant improvement in accuracy can be obtained even without extensive postprocessing when the sites are sufficiently conserved within a given sample, while comparable performance is obtained when the site conservation rate is low. We also perform additional postprocessing to improve the modeling of motifs.
A software program (PosMotif ) and detailed results are available online at http://faculty.cse.tamu.edu/shsze/posmotif.
2. Problem Definition
We represent a motif of length l by a string
For a particular combination of ignored positions within a string of length l out of O(2
l
) possibilities, we construct an mth order Markov chain M by skipping these positions. For each string s of length l, let
and create a transition from the state
We can visualize M as a leveled structure in which the jth row represents the jth level that contains all states with the same j and each column represents all states with the same w (Fig. 2). For a given background sample BS of sequences in the alphabet {a,c,g,t} and the association

Illustration of a second order Markov chain M for strings with l′ = 5 positions that are not ignored, represented by
where
Let S be a sample of k sequences each of length n that represent upstream DNA sequences of potentially co-regulated genes. By ignoring correlations between overlapping occurrences, we estimate the probability of s occurring at a given position of S by
where the starting probability is estimated by
and
Let k′ be the number of sequences that s occurs at least n′ times. We estimate the P-value of s by the probability of s occurring at least n′ times in at least k′ sequences as
Since positions at the two ends of s are never ignored, we estimate the E-value of s by
By assuming that P(s, n′, k′) is the probability to be attained for all motifs of length l that have l′ positions which are not ignored, this equation allows direct comparison of motifs. To allow for samples having sequences of similar but different lengths, we use the average sequence length to approximate n. The goal is to identify all motifs s with E-value below a cutoff over all combinations of ignored positions and different parameters l and n′.
3. Preprocessing
Given a sample BS containing background sequences, we first perform preprocessing so that the transition probabilities can be efficiently computed. Given string length l and Markov order m, we compute and store the number of occurrences of all strings of length p from 1 to l in BS with m + 1 positions that are not ignored, by considering each combination of p − m − 1 ignored positions among p positions and scanning over all strings s of length p that appear in BS. We remove the ignored positions from s to obtain a string s′ of length m + 1, and update the number of occurrences of s′ that represents the number of occurrences of the corresponding string of length p before removing the ignored positions.
Given a sample S, by ignoring small differences in occurrences around sequence starts and ends, the initial portion of the probability P(s) of a string
where
The procedure takes
4. PosMotif Algorithm
Given a sample S and string length l, we consider each combination of ignored positions among l positions, and enumerate all motifs with these ignored positions by scanning over all strings s of length l that appear in S and removing the ignored positions from s to obtain s′. We insert s′ into a search tree T, in which each motif is represented by a path from the root to a leaf, each internal node has at most four children that correspond to each letter in {a,c,g,t}, and each leaf represents a motif that may have multiple occurrences (Fig. 3).
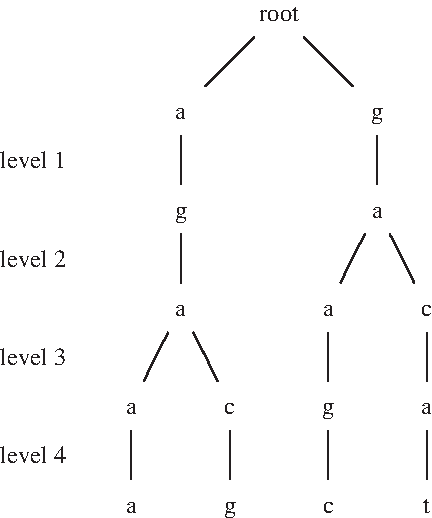
Illustration of the search tree T constructed for the sequence aagggaacagtc that stores all motifs of length 9 while ignoring the second, third, fifth, and eighth positions, including the motifs a- -g-aa-a, a- -g-ac-g, g- -a-ca-t, and g- -a-ag-c that appear from the left to the right in the sequence. Each motif is represented by a path from the root to a leaf while skipping these positions. Each horizontally marked level has a corresponding level in Figure 2.
To avoid repetitive motifs that have excessive number of overlapping occurrences, given a motif s and a parameter n′ that specifies the number of occurrences that are counted for each sequence, we let k′ be the number of sequences that have at least n′ non-overlapping occurrences of s. Within each leaf of T, we compute k′ during the tree construction by remembering the number of non-overlapping occurrences found so far in a sequence and the location of the last occurrence. Although more accurate formulas for computing P-values are available for this non-overlapping model (Leung et al. 2005), they have high time complexity and we use our original overlapping approximation to compute P-values and E-values within each leaf of T.
For each combination of ignored positions out of O(2 l ) possibilities, it takes O(l · |S|) time and space to construct the search tree T, where |S| is the sample size. For each of the O(|S|) leaves that corresponds to one motif s, each of the O(l) terms in the P-value formula for P(s) can be obtained in constant time from the preprocessing results. By computing the binomial coefficients and each term within the summation of the two P-value formulas recursively and obtaining the powers (1 − P(s))n−l+1 and (1 − P(s, n′)) k by a recursive halving approach, the P-values and the E-values of s can be computed in O(l + n′ + k + log |S|) time. Thus the overall time complexity of the entire algorithm is O(2 l · |S|(l + n′ + k + log |S|)), which is practical for l up to 18 or 20 and moderate sample size |S|.
5. Initial Postprocessing
We consider all motifs of different lengths up to a maximum l from the main algorithm with E-value below a cutoff, and perform initial postprocessing by merging pairs of motifs with a shift of at most one starting position. While there exist two motifs with the same number of occurrences in each sequence and the starting position of each occurrence of one motif is one position before the starting position of each occurrence of the other motif, we merge the two motifs into one motif and set its E-value to the lower E-value among them. While there exist two motifs with the same number of occurrences and the same set of starting positions in each sequence, we remove the motif with the higher E-value. Note that the motifs that are merged do not need to have the same or similar lengths, and the motifs after merging may have length larger than l.
To perform this step efficiently, we sort the motifs by the locations of their occurrences and investigate those that are close in locations. At the end, we sort the motifs in increasing order of the E-value and report them. Since not many motifs have low E-values, the running time is small when compared to the main algorithm. Note that this strategy is different from the one in Apostolico and Parida (2004), because we do not remove non-maximal motifs and do not impose density constraints.
6. Further Postprocessing
Since previous approaches show that additional postprocessing such as using motif redundancy (Pavesi et al., 2001; Wijaya et al., 2007) can lead to improved accuracy, we follow Peng et al. (2006) and use a hybrid ranking strategy to perform further postprocessing. For each motif s from among the top r motifs after the initial postprocessing step, we compute the number of neighboring motifs s′ of s with either the cost of alignment between s and s′ or the cost of alignment between s and the reverse complement of s′ below a cutoff, and add the occurrences of s′ to s, with overlapping occurrences combined into one site. Note that these added occurrences can come from either strand and are possibly of different lengths, resulting in a general motif model, and this step helps to remove our initial restriction that nucleotides must be fixed in positions that are not ignored.
We compute two different ranks for each motif s, including rank1(s), which is the rank of s (between 1 and r) when the motifs are sorted in decreasing order of the number of neighboring motifs, and rank2(s), which is the rank of s (between 1 and r) when the motifs are sorted in increasing order of the E-value, and sort the motifs in increasing order of the hybrid rank rank(s) = rank1(s) + rank2(s). To avoid the situation in which all top motifs are very similar, for each motif s, we remove all motifs s′ with worse rank when the percentage of neighbors shared by s and s′ with respect to s is above a cutoff.
7. Performance Evaluation
We consider two variants, including PosMotif1, which combines algorithm PosMotif with algorithm PostProcess that performs initial postprocessing, and PosMotif2, which combines algorithm PosMotif with algorithms PostProcess and PostProcess2 that perform both initial and further postprocessing. We compare our performance to (1) YMF (Sinha and Tompa, 2002), which uses a statistical approach that performs very well on samples of type mixed from Tompa et al. (2005); (2) MEME (Bailey and Elkan, 1994), which is one of the most popular motif finding algorithms that use the expectation-maximization strategy; (3) MotifSampler (Thijs et al., 2001), which uses a Gibbs sampling strategy that performs very well on samples of type real from Tompa et al. (2005); and (4) Weeder (Pavesi et al., 2001), which uses a combinatorial approach that has the best accuracy as assessed by Tompa et al. (2005).
For each algorithm, we use the default parameters as much as possible. We follow Sinha and Tompa (2002), and run YMF over motif lengths from 6 to 10, allowing for at most two degenerate symbols and at most 11 spacers for motifs of length 6 and no spacers for motifs of length larger than 6, while using a third order Markov background constructed from upstream sequences of entire species. We further use FindExplanator to extract independent motifs for each length, and sort these motifs of different lengths by z-score while extracting occurrences on both strands. We run MEME with the anr option, with motif lengths of up to 20 while allowing sites to be on both strands and using a fifth order Markov background constructed from upstream sequences of entire species. We run MotifSampler 20 times for each motif length 6, 8, 10, and 12 while allowing sites to be on both strands and using a third order Markov background constructed from upstream sequences of entire species. We run Weeder with the large mode over motif lengths 6, 8, 10, and 12 while allowing sites to be on both strands and using appropriate frequency tables of the given species.
We run PosMotif1 and PosMotif2 using background Markov chains of order m = 2 constructed from upstream sequences of entire species. Since it is not necessarily more sensitive to count arbitrary number of motif occurrences in a sequence during the computation of P-values, we use a parameter N′ to control the maximum number of motif occurrences that are counted for each sequence. We count at most one non-overlapping occurrence per sequence unless the number of sequences k is very small: N′ = 4 for k = 1, N′ = 2 for k = 2 or 3, and N′ = 1 for k ≥ 4. For each sample S, we iteratively consider each possible n′ from 1 to N′, which put emphasis on occurrences in different sequences. We restrict the motif length l to at most 18 before postprocessing and collect all motifs with E-value below 1 for postprocessing. The above parameters are determined by testing a few combinations and choosing one that gives satisfactory performance on samples of type real from Tompa et al. (2005). For each motif s, we define the occurrences of s to be all strings in S that match s, which is independent of n′.
In the second postprocessing step, we start with top r = 100 motifs from the first postprocessing step. We follow Peng et al. (2006) to define the alignment cost and neighboring motifs as follows: 1 for a mismatch of two letters in {a,c,g,t}, 0.7 for an indel of a letter in {a,c,g,t}, 0.5 for matching – with a letter in {a,c,g,t}, and no cost for other combinations. We allow gaps to appear only at the beginning or the end of an alignment. We consider two motifs to be neighbors only when their difference in length is at most 0.2 times their maximum length, and define the cutoff for alignment cost to be 0.2 times their maximum length. We further define the cutoff for removal of worse ranked motifs to be 50% of shared neighbors. Note that motifs may become longer after initial postprocessing in PosMotif1 and can contain variable length occurrences after further postprocessing in PosMotif2.
When constructing background Markov chains, we use background upstream sequences of the same length as the sequence length in a given sample. When processing samples that contain sequences from multiple species, background frequencies are added across multiple species for Weeder, while background upstream sequences are collected together across multiple species before constructing the background Markov chain for the other algorithms.
For each prediction on a given sample, we compute the nucleotide level statistics nTP, nFP, nFN and nTN, which are the number of positions that are in both predicted and known sites, the number of positions that are in predicted sites but not in known sites, the number of positions that are in known sites but not in predicted sites, and the number of positions that are not in predicted nor known sites respectively. From these statistics, we compute the sensitivity nSn = nTP/(nTP + nFN), the positive predictive value nPPV = nTP/(nTP + nFP), the specificity nSp = nTN/(nTN + nFP), the performance coefficient nPC = nTP/(nTP + nFP + nFN), and the correlation coefficient
By following Tompa et al. (2005) to define an overlap between a predicted site and a known site if they overlap by at least one-fourth of the known site, we also compute the site level statistics sTP, sFP and sFN, which are the number of known sites that have overlap with a predicted site, the number of predicted sites that do not have overlap with known sites, and the number of known sites that do not have overlap with predicted sites respectively. From these statistics, we compute the sensitivity sSn = sTP/(sTP + sFN), the positive predictive value sPPV = sTP/(sTP + sFP), and the performance coefficient sPC = sTP/(sTP + sFP + sFN).
We use the top motif from each algorithm for performance evaluation. To evaluate the accuracy of each algorithm on a set of samples, we treat it as if it was a single large sample (Tompa et al., 2005). To evaluate whether our algorithm leads to significant improvements, we use the Wilcoxon matched-pairs signed-ranks test (Wilcoxon, 1947) over a set of samples with P = 0.05 as significance cutoff, in which values of nPC, nCC, and sPC on each sample within the set are paired from two algorithms.
8. Results
We test each algorithm on three sets of biological samples, including samples of type real from Tompa et al. (2005), in which each sample contains motifs that correspond to one transcription factor in the TRANSFAC database (Wingender et al., 1996), samples from the SCPD database (Zhu and Zhang, 1999), which is a promoter database that contains yeast regulons, and samples from the ABS database (Blanco et al., 2006), in which each sample contains experimentally validated binding sites that have been manually curated from at least two orthologous vertebrate promoters.
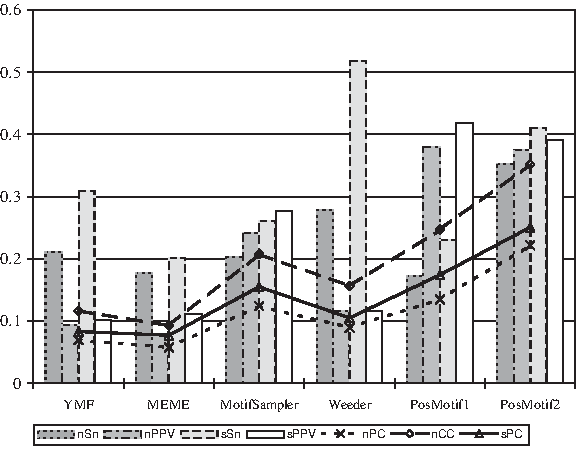
Figure 4 shows performance comparisons of the algorithms on samples of type real from Tompa et al. (2005), in which there are a total of 52 samples from four species, including fly, human, mouse and yeast, with each sample containing up to 35 upstream sequences from one species and sequence lengths ranging from 500 to 3000. Note that these samples contain real upstream sequences, which are different from the samples of type mixed used in Tompa et al. (2005). When all samples from different species are considered together, the P-values from the Wilcoxon test show that there are no significant performance differences between PosMotif and the other algorithms. When the samples from each species are considered separately, Table 1 shows that there are considerable accuracy fluctuations. This is especially true for fly, which contains only six samples. All the algorithms have high accuracy on yeast, with PosMotif generally performing better on yeast. The Wilcoxon test is not performed within each species since the number of samples is small.

Performance of motif finding algorithms on samples of type real from Tompa et al. (2005). For each algorithm, bars denote nSn, nPPV, sSn, and sPPV from left to right; lines marked by crosses denote nPC; lines marked by diamonds denote nCC; and lines marked by triangles denote sPC, obtained by treating a set of samples as if it was a single large sample. Detailed results and the software program (PosMotif ) are available online at http://faculty.cse.tamu.edu/shsze/posmotif. (see Fig. S1 and Table S1 for PosMotif1; and Fig. S2 and Table S2 for PosMotif2).
In each case, the highest value is in bold.
Figure 5 shows performance comparisons of the algorithms on samples that contain at least three genes in the SCPD database (Zhu and Zhang, 1999), in which there are a total of 35 samples, with each sample containing up to 25 upstream sequences in yeast and each sequence of length 1000. The P-values from the Wilcoxon test show that PosMotif performs significantly better than the other algorithms in most cases (except for YMF when the performance differences are insignificant), with PosMotif2 performing significantly better than PosMotif1 (Table 2).
Performance of motif finding algorithms on samples that contain at least three genes in the SCPD database (Zhu and Zhang, 1999). The notations are the same as in Figure 4. Detailed results are available online at http://faculty.cse.tamu.edu/shsze/posmotif. (see Fig. S3 and Table S3 for PosMotif1; and Fig. S4 and Table S4 for PosMotif2).
Each algorithm on the left is compared against each algorithm on the top, with — indicating insignificant differences.
Figure 6 shows performance comparisons of the algorithms on samples from the ABS database (Blanco et al., 2006), in which there are a total of 68 samples, with each sample containing up to 95 upstream sequences in multiple species from among human, mouse, rat, and chicken, and each sequence of length 500. The P-values from the Wilcoxon test show that PosMotif performs significantly better than YMF in all cases, and it performs significantly better than the other algorithms in most cases, with no significant performance differences between PosMotif2 and PosMotif1 (Table 3).

Performance of motif finding algorithms on samples from the ABS database (Blanco et al., 2006). The notations are the same as in Figure 4. Detailed results are available online at http://faculty.cse.tamu.edu/shsze/posmotif. (see Fig. S5 and Table S5 for PosMotif1; and Fig. S6 and Table S6 for PosMotif2).
The notations are the same as in Table 2.
9. Overall Accuracy
The above results show that PosMotif1 has high accuracy even before extensive postprocessing is performed when positions that are not ignored still contain fixed nucleotides. The second postprocessing step in PosMotif2 is useful, but does not always lead to significantly better accuracy. In general, the nucleotide level statistics nPC and nCC correlate well with each other, the site level statistics sSn and sPPV correlate well with the nucleotide level statistics nSn and nPPV respectively, and the site level statistic sPC correlates well with both the nucleotide level statistics nPC and nCC. To obtain good performance, appropriate tradeoffs have to be maintained between optimizing nSn and nPPV (or between sSn and sPPV), in which the former aims to reduce false negatives while the latter aims to reduce false positives.
To further investigate the relationship between motif conservation and algorithm performance, we combine overlapping occurrences of each motif into one site and align these occurrences by using ClustalW (Thompson et al., 1994) with default parameters. We remove columns in the alignment in which less than 50% of the characters are gap characters and compute the consensus nucleotide in each remaining column while ignoring gap characters. Over a given set of samples, we define the motif conservation rate to be total number of nucleotides that are the same as the consensus nucleotide within a column divided by the total number of nucleotides in all the columns. Note that this procedure ignores the possibility that a motif can contain sites on both strands, but it should give a good approximation. Although some number of gap characters can appear in an alignment, they are rare and the above score reflects the conservation of core regions in a motif.
Figure 7 shows that, although the known sites generally have low conservation rates, each algorithm has its own focus on finding motifs within a narrow range of conservation rates due to the specific motif model being used and the parameter settings. Among the three data sets, the high site conservation rate on the samples from the SCPD and ABS databases makes it easier for PosMotif to improve motif finding accuracy. Within the samples of type real from Tompa et al. (2005), the site conservation rate of the yeast samples is higher than that of the other species, which explains the better performance of PosMotif on the yeast samples. Since our model focuses initially on identifying invariant core positions, it is most successful in identifying sites that have a high enough conservation rate within a sample, in which case the invariant positions are more prevalent and are better captured by our model. This is especially true on the samples from the SCPD and ABS databases, in which the site conservation rate is much higher than that on the samples of type real from Tompa et al. (2005). Note that these performance differences are mostly due to the differences in the site conservation rate and are not species-specific.
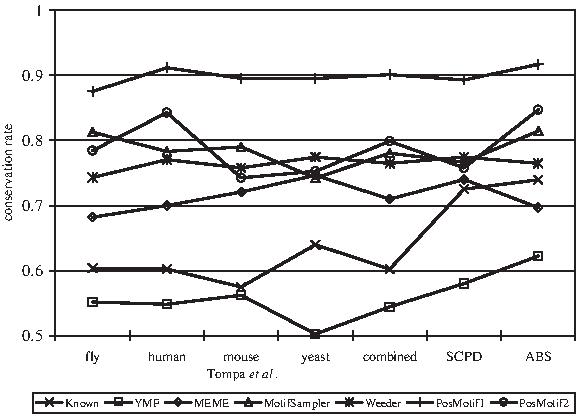
Conservation rate of known sites and top motifs from motif finding algorithms on each set of samples.
10. Conclusion
We have shown that by skipping nonconserved positions, many background Markov chains can be used simultaneously to better model long range nucleotide dependencies within motifs. Our initial focus on positions that have fixed nucleotides allows the development of an efficient algorithm that can find long motifs in moderately sized samples, due to a small base of two in the exponential part of the time complexity. The later postprocessing step gives rise to a general motif model in which each motif can contain variable length occurrences.
It takes minutes to hours to find motifs of length up to 18 or 20 for the smaller samples to one or two days for the larger samples. When the maximum motif length is lowered to smaller values such as 12, the algorithm becomes very fast and takes only seconds for many samples. Since the running time approximately doubles when l is increased by 1, it takes about twice as long to obtain all motifs of length at most l when compared to obtaining motifs for only one l.
To further improve accuracy, it is possible to develop more accurate formulas that have low time complexity for computing P-values and E-values, or consider more detailed models initially by allowing mismatches or degenerate letters within motifs. Another strategy is to use phylogenetic information on samples that contain sequences from multiple species.
Footnotes
Acknowledgments
This work was supported by the NSF (grant MCB-0951120).
Disclosure Statement
No competing financial interests exist.