
Abstract
Abstract
Human T-cell leukemia virus type 1 is a human retrovirus endemic in many areas of the world. Although many studies indicated a key role of the viral protein Tax in the control of viral transcription, the mechanisms controlling HTLV-1 expression and its persistence in vivo are still poorly understood. To assess Tax effects on viral kinetics, we developed a HTLV-1 model. Two parameters that capture both its deterministic and stochastic behavior were quantified: Tax signal-to-noise ratio (SNR), which measures the effect of stochastic phenomena on Tax expression as the ratio between the protein steady-state level and the variance of the noise causing fluctuations around this value; t1/2, a parameter representative of the duration of Tax transient expression pulses, that is, of Tax bursts due to stochastic phenomena. Sensitivity analysis indicates that the major determinant of Tax SNR is the transactivation constant, the system parameter weighting the enhancement of retrovirus transcription due to transactivation. In contrast, t1/2 is strongly influenced by the degradation rate of the mRNA. In addition to shedding light into the mechanism of Tax transactivation, the obtained results are of potential interest for novel drug development strategies since the two parameters most affecting Tax transactivation can be experimentally tuned, e.g. by perturbing protein phosphorylation and by RNA interference.
1. Introduction
To gain insight into the mechanisms controlling HTLV-1 expression, we recently developed a mathematical model of HTLV-1 (Corradin et al., 2010). In this model, the noise affecting viral gene transcription and translation was studied using Gillespie's exact stochastic simulations (Gillespie, 1976, 1977, 1992, 2007). Results indicated that stochastic phenomena can sporadically induce remarkable fluctuations of the expression of protein Tax, which is the main signal related to retrovirus HTLV-1 activation (Brauweiler et al., 1995), over the expected level corresponding to its deterministic steady state. This concept is consistent with other experimental models of different viruses where bursts in protein expression were described (Kierzek et al., 2001; Cai et al., 2006; Yu et al., 2006). Since Tax transactivates the HTLV-1 gene circuit, i.e., enhances retrovirus transcription, transient pulses in its expression suggest mechanisms of retroviral activation similar to those proposed for HIV by Weinberger et al. (2008), who experimentally observed that HIV activation is influenced by the duration of the stochastic bursts of expression of the Tat protein. In analogy to HTLV-1, Tat transactivates the HIV gene circuit inducing a positive feedback mechanism whose strength is determined by the duration of Tat bursts. The role of positive autoregulation on the HIV viral genes kinetics and on the development of pathological states was recently pointed out also by other authors (Burnett et al., 2009; Althaus and De Boer, 2010). In more general terms, the effects of stochastic phenomena on the expression of proteins were studied in depth (Thattai and van Oudenaarden, 2001; Paulsson, 2004; Kaern et al., 2005; Rao et al., 2002; Ozbudak et al., 2002), with particular attention to gene circuits characterized by positive feedback mechanisms that can induce bimodalities, which are potentially related to the existence of two distinct states, e.g. latency and activation (Friedman et al., 2006; To and Maheshri, 2010).
In the present study, we aimed at gaining a better insight into the mechanisms controlling HTLV-1 activation. Since modulating transactivation might be an effective means to control HTLV-1 activation, viral spread, and possibly, disease in infected patients, we focused on the role of the transactivator protein Tax in the absence of Rex, a key HTLV-1 regulatory protein that controls viral gene expression at the post-transcriptional level (Lairmore and Franchini, 2007); this way the effects of transactivation on Tax expression were isolated. An additional advantage of this reduced circuit is that Tax repression, performed by Rex, is avoided, thus facilitating future experimental validations of the results of our work (Lin et al., 1998). Once derived a mathematical model of the reduced gene circuit from the recently developed full-length HTLV-1 model (Corradin et al., 2010), an analytic approach based on transfer functions was pursued to assess the propagation of noise affecting genes/proteins synthesis and degradation to Tax expression by means of two parameters: Tax signal-to-noise ratio (SNR), which is the ratio between the protein steady-state level and the variance of the noise causing fluctuations around this value and t1/2, derived from the noise autocorrelation function (Priestley, 1982) and related to the duration of Tax bursts (Weinberger, 2008).
To test the reliability of the transfer function approach, originally proposed to evaluate the effects of stochastic phenomena on simple gene circuits at steady state (Simpson et al., 2003; Cox et al., 2006), results were compared to those obtained using Gillespie algorithm, which represents an acceptable in silico surrogate of biological validation.
Finally, sensitivity analysis (Thomaseth and Cobelli, 1999) was applied to identify the model parameters most affecting either SNR or t1/2 and, thus, Tax expression and transactivation.
2. Methods
2.1. Model of the HTLV-1-derived gene circuit
The main biological processes characterizing the HTLV-1 gene circuit, obtained by depriving of Rex synthesis and effects a recently developed full-length model (Corradin et al., 2010), are schematized in Figure 1 as:
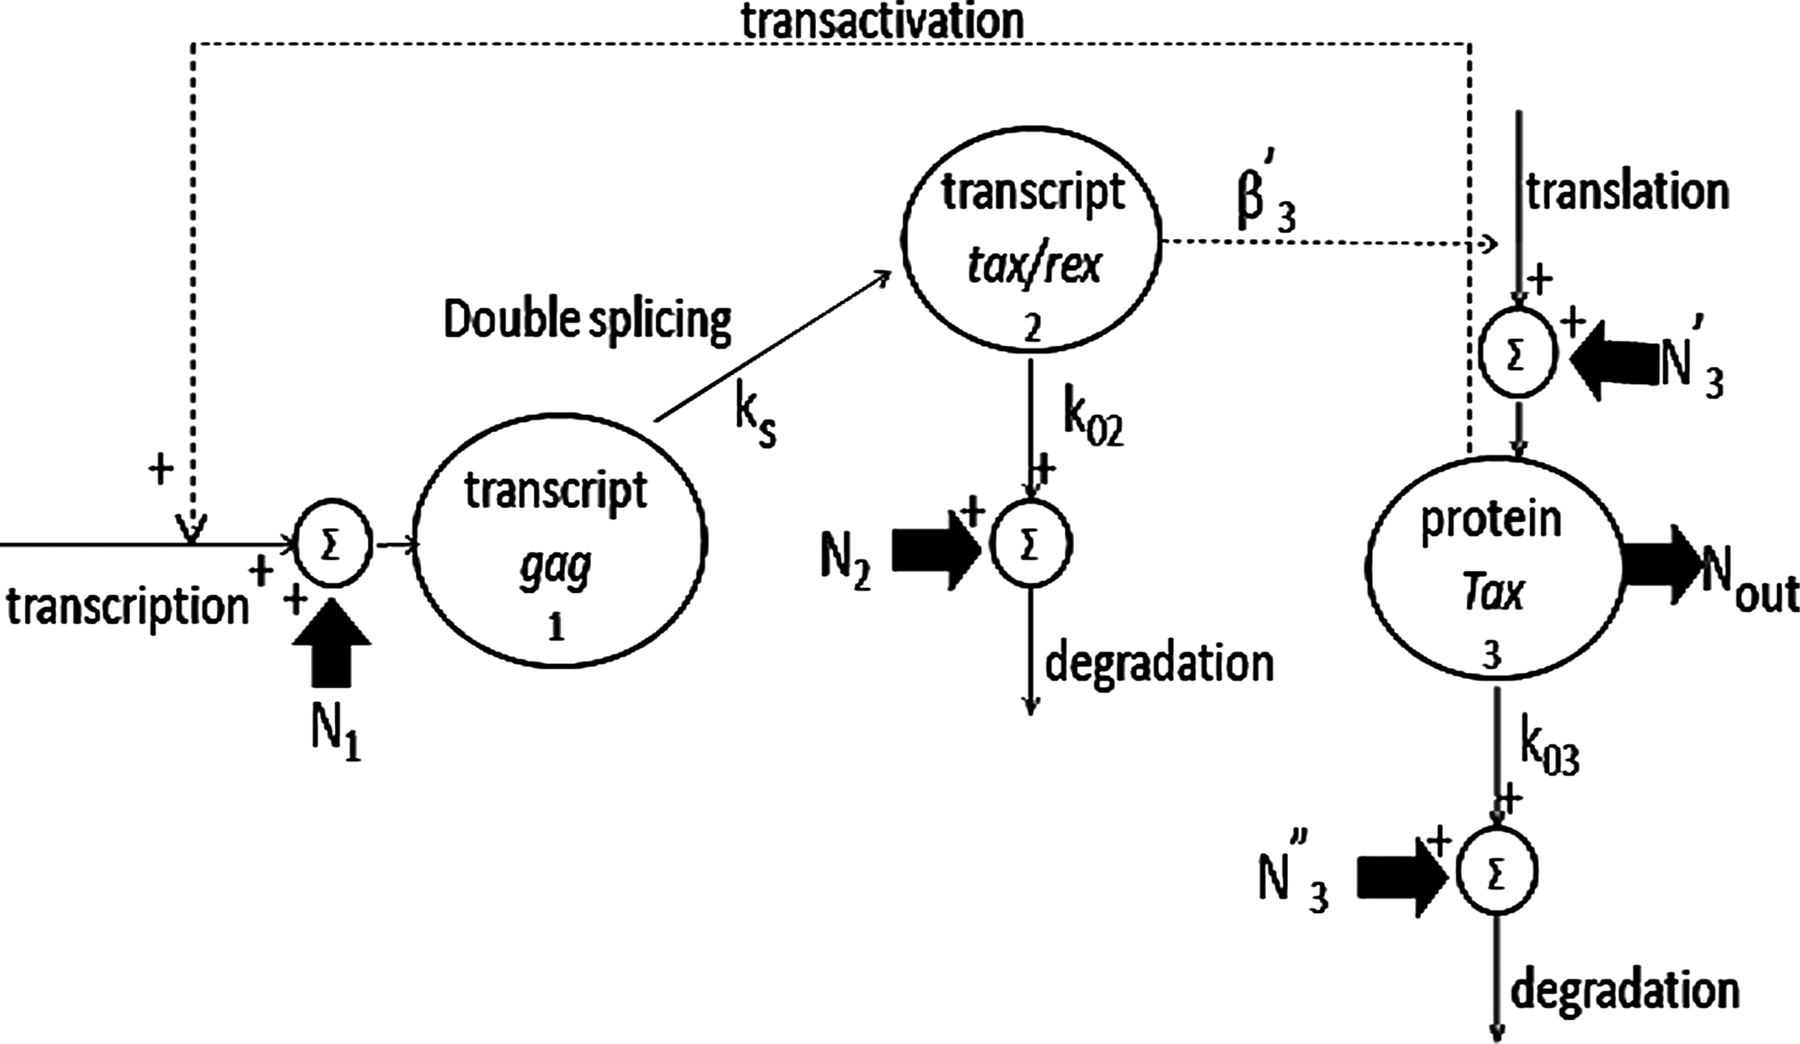
HTLV-1-derived gene circuit. N1, N2, N′3, N″3 represent the noise affecting gag synthesis, tax/rex degradation, Tax synthesis, and degradation, respectively. Parameters ks, k02, and k03 represent the rate constant of gag splicing, tax/rex, and Tax degradation, respectively; β′3 is the product of Tax gain in translation multiplied for the rate constant of the chemical reaction representing Tax translation. Continuous lines indicate fluxes; dashed lines indicate controls.
i. Synthesis of the primary transcript gag;
ii. Gag splicing into transcript tax/rex and tax/rex degradation;
iii. Translation and degradation of protein Tax, which is encoded by tax/rex and enhances gag transcription (transactivation).
The kinetics of the primary transcript gag, gene tax/rex, and protein Tax can be described by the following set of differential equations (Eqs. 1–3), which are based on mass action kinetics (Corradin et al., 2010; Connors, 1991; Kaern et al., 2003):
where the state variables qi, i = 1 … 3, represent the number of molecules in a cell for gag, tax/rex and Tax, respectively, and superscript SS indicates their steady-state values as initial conditions. Si, i = 1 … 3, are synthesis processes: transcript gag synthesis, S1, is due to a minimal transcription, MOI·S, and is enhanced by the transactivation mechanism due to protein Tax, as expressed by a nonlinear Hill term; tax/rex synthesis, S2, corresponds to the amount of spliced gag, ks· q1; Tax synthesis, S3, is proportional to tax/rex through β′3. Parameter ks [1/h] represents the nuclear export rate whereas k02 and k03 [1/h] are the degradation rates of transcript tax/rex and protein Tax, respectively. Parameter MOI represents the multiplicity of infection, i.e., the number of viral genomes integrated in the host cell genome while S [1/h] is the minimal transcription rate. As concerns the Hill term in Eq. (1), β′1 is dimensionless and called transactivation constant, while the Hill constant h’1 is the product of many chemical equilibrium constants, as detailed in Corradin et al. (2010). Finally, parameter β′3 [protein molecules/(transcript molecules*h)] is the product of Tax gain in translation multiplied for the rate constant of the chemical reaction representing Tax translation (Corradin et al., 2010).
Since the basal transcription rate S and Hill constant h′1 are unknown, model equations were scaled for these two parameters, leading to the substitution of time t with the dimensionless τ = t
Nominal values for all the parameters were fixed according to Brauweiler et al. (1995): β′1 = 10, k′s = ks/S = 1, k′02 = k02/S = 0.01, k′03 = k03/S = 0.01,
2.2. Modeling intrinsic noise
The biological processes of transcript and protein synthesis and degradation are affected by intrinsic noise (Thattai and van Oudenaarden, 2001; Kaern et al., 2005). Thus, noise sources N1, N2, N′3, and N′′3, were added to the model (Fig. 1) to represent the noise affecting gag transcription, tax/rex degradation, Tax synthesis, and degradation, respectively. As in Simpson et al. (2003), the stochastic phenomena affecting transcription and translation were modeled as shot noise, which characterizes many electronic and optical devices when the number of particles that carry energy (electrons or photons) is finite and small. This description appears to be reasonable also for biological noise, in particular for the noise affecting transcription since the number of retrovirus promoters in HTLV-1-infected patients is usually very limited (Taylor et al., 1999).
From a mathematical point of view, shot noise is a Poisson process where events occur independently; therefore, it is characterized, in the frequency domain by a uniform distribution of power (Priestley, 1982), i.e., its power spectral density (PSD) is constant for all positive frequencies and equal to either molecular synthesis (as regards the noise in transcription and translation) or molecular degradation (as regards the noise in degradation) multiplied by two (Simpson et al., 2003). Therefore, PSDs of noise sources N1 (affecting gag synthesis) and N2 (affecting tax/rex degradation), named PSD1 and PSD2, respectively, do not vary with frequency f and can be expressed as:
where S1SS and S2SS represent the syntheses of gag and tax/rex at steady state, respectively, obtained by solving Eqs. (4–6) at steady state (see Appendix). Following the definition of shot noise, since at equilibrium the degradation of protein Tax equals its synthesis, noise terms N′3 and N′′3 have equal PSDs. Assuming they are independent, they can be considered as a unique noise source, denoted as N3, with constant PSD, PSD3, equal to the sum of the PSDs of N′3 and N′′3 (Simpson et al., 2003), and given by:
where S3SS represents Tax synthesis at steady state.
Stochastic phenomena affecting synthesis and degradation of gag, tax/rex, and Tax induce random deviations of Tax from its steady-state value, modeled as an additive noise Nout (Fig. 1). Its power spectral density, PSDout, can be calculated from PSD1, PSD2 and PSD3 in Eqs. (7–9) by means of the transfer function approach:
where f is the frequency and H4i, I = 1 … 3 are related to the transfer functions of the system in Eqs. (4–6), expressing the relationship between Nout and the noise sources Ni, I = 1 … 3 as a function of model parameters, as detailed in the Appendix. Since this approach is applicable only to linear systems while the model in Eqs. (4–6) is nonlinear (because of the Hill term in Eq. 4), a linearization around a steady-state solution was performed, as detailed in the Appendix. By applying the inverse Fourier transform to PSDout, the autocorrelation function ACFout can be analytically calculated (Priestley, 1982) (details in the Appendix), which provides important information on the relationship among noise samples taken at different. In fact, ACFout(k) represents the correlation among samples separated by the time interval k and its value for k = 0 represents the standard deviation of the noise Nout, denoted as σout (Priestley, 1982), from which SNR can be calculated:
Moreover, as suggested by Weinberger et al. (2008), the time lag corresponding to the halving of ACFout, denoted as t1/2, is indicative of transient pulses duration, and can be a useful parameter since longer bursts in the expression of the transactivator protein are likely to favor retrovirus activation (Weinberger et al., 2008).
2.3. Sensitivity analysis
In order to identify the model parameters most affecting the gene circuit SNR, sensitivity analysis was applied (Thomaseth and Cobelli, 1999), i.e., sensitivity of SNR to model parameter pi, Si, was defined as:
and evaluated from the analytical expression of the SNR provided by Eq. (11).
Since it was not possible to derive an analytical expression of t1/2 from that of ACFout, we investigated the effects exerted on t1/2 by model parameters in terms of Spearman correlation. In more detail, the analytic expression of ACFout was evaluated for different values of one model parameter at a time: for each ACFout time course, parameter t1/2 was estimated and Spearman correlation between the set of model parameter values and the set of extracted t1/2 values was calculated.
2.4. Gillespie's exact stochastic simulations
Tax steady-state fluctuations were simulated by Dizzy software package (Ramsey et al., 2005), which implements the direct method of Gillespie algorithm (Gillespie, 1976, 1977, 1992, 2007). 100 distinct simulations were performed; from each of them noise samples were extracted following the de-trending procedure described in Weinberger et al. (2008). A mean noise autocorrelation function was estimated from the whole set of 100 simulations using the biased estimator:
where k = 0 … N−1 is the scaled time lag, subscript m = 1 … 100 refers to the mth simulation; thus, Nm(n) are the noise samples extracted from the mth simulation and N = 500,001 is the number of time samples composing each time series. Hence, numerical PSDout was estimated via discrete Fourier transform algorithm (Smith, 2007).
3. Results
The time courses of PSDout (Eq. 10) and ACFout are shown, plotted in continuous line, in Figure 2 where the x-axes are scaled frequency or time lag because of the time scaling performed on the model. PSD and ACF numerically estimated from Gillespie's steady-state fluctuations (Gillespie, 1976, 1977, 1992, 2007) are superimposed, plotted in dashed line. Their close match confirms the reliability of the noise propagation procedure based on transfer functions to analyze HTLV-1 gene circuit. Both PSDs are characterized by a relevant fall, which indicates that the noise affecting Tax expression is characterized mainly by low frequencies, at variance with the original noise sources N1, N2 and N3, assumed to have constant PSDs and thus uniform frequency content. This fall is due to the presence of zeros at the denominator (poles) of the transfer functions H4i, i = 1 … 3 and is expected since it is well known that the presence of a pole in the denominator of a transfer function causes a decrease of 20 dB/decade in its magnitude (Levine, 1996). In more detail, the fall in the trend of PSDout is due to the combined effect of two close poles in the denominators of H4i, which are located at the scaled frequencies 1.5e-3 and 1.7e-3, respectively. These values correspond to 2.9e-6 Hz and 3.1e-6 Hz, if the scaling factor S is set to adenovirus value (Kugel and Goodrich, 1998), which is 1.9e-3/s.
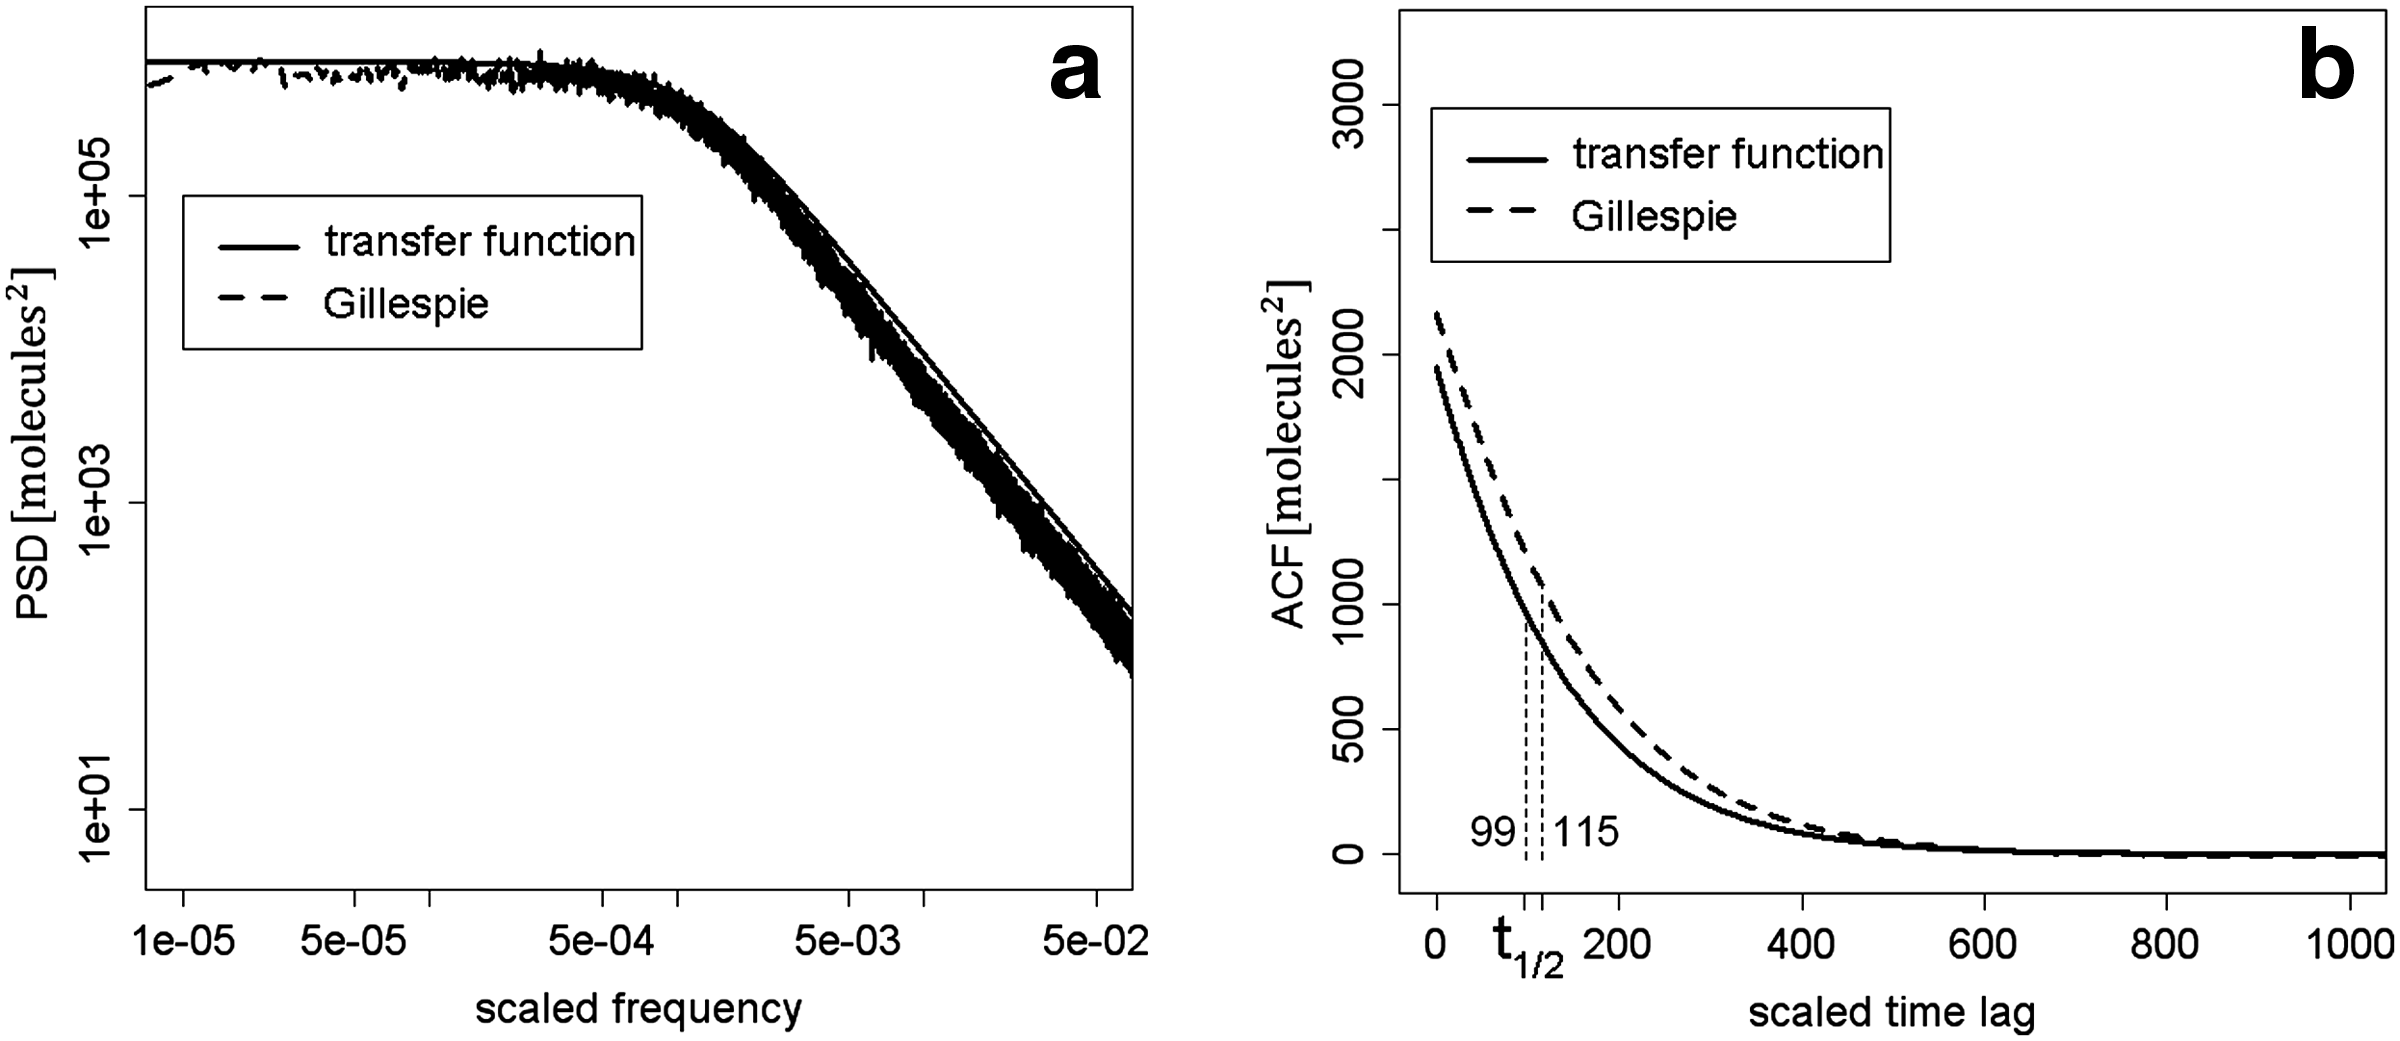
PSD and ACF of the noise affecting Tax expression. Analytic PSDout (
Numerical values of the gene circuit SNR, of Tax steady-state expression level and of the variance characterizing noise Nout are shown in Table 1, together with the time lag t1/2 at which ACFout assumes a value equal to 50% of the maximum level. The corresponding quantities, numerically estimated from Gillespie's steady-state fluctuations, are reported in Table 1, showing a good agreement between the two methods. In particular, t1/2 values, estimated via either the transfer function approach or Gillespie's exact stochastic simulations, equal 99 and 115, respectively, when expressed in scaled time, which correspond to 14.5 and 16.8 h if the scaling factor S is set as before.
Values of Tax SNR and steady-state expression
Results of sensitivity analysis, summarized in Table 2, suggest a major role of MOI in increasing SNR and an opposite role of Tax degradation rate, k′03. Parameter
Influence of model parameters on SNR and t1/2, measured from sensitivity analysis for the former and Spearman correlation for the latter.
Spearman correlation coefficients suggest that degradation rates of transcript tax/rex, k′02, and protein Tax, k′03, negatively correlate with t1/2, which is reasonable because an increased degradation means a shorter permanence of the protein in the cell. Equal and opposite effect is exerted by Tax gain in translation,
4. Conclusion
In this article, we focused on the biological mechanism of transactivation, which consists in the enhancement of viral transcription; this is due to the HTLV-1 protein Tax that, consequently, is thought to be related to retrovirus activation. Such a relationship was recently observed in other biological models concerning retrovirus HIV and its transactivator protein Tat.
In the present work, in order to get a better insight on HTLV-1 activation, we characterized Tax expression on a HTLV-1-derived gene circuit, appropriately modified to isolate the effects of the transactivation mechanism. The mathematical model of this HTLV-1-derived gene circuit was obtained from a recently developed full-length HTLV-1 model (Corradin et al., 2010), and includes the kinetics of transcripts gag and tax/rex, and of protein Tax. An analytic approach based on transfer functions was adopted to assess the propagation of noise affecting gene/protein synthesis and degradation to Tax expression and to estimate two parameters able to quantify both its deterministic and stochastic behavior: (i) the HTLV-1 gene circuit SNR, i.e., Tax steady-state level normalized to the standard deviation of the noise affecting this protein expression and (ii) t1/2, a parameter representative of the duration of Tax transient expression pulses, i.e., of Tax bursts due to stochastic phenomena that can cause important deviations of the protein expression from its steady-state value.
As concerns the assumption of shot noise, its limits to model stochastic phenomena in biological systems were discussed by Simpson et al. (2003); moreover, Golding et al. (2005) recently observed mRNA distributions larger than the Poissonian, which underlies the shot noise. However, also, the Gillespie algorithm is based on Possonian statistics (Wilkinson, 2006), and Poissonian noise was recently re-proposed by Thattai and van Oudenaarden (2001). As concerns the other two assumptions that characterize shot noise, i.e., the independence of noise samples and the constant power spectral density equal to the molecular turn-over multiplied by two, they were not experimentally proved but the agreement with the results derived from Gillespie's exact stochastic simulations suggest that the hypotheses underlying shot noise are reasonable in the case of HTLV-1 model presented in this work. Similar good agreements were reported also for different gene circuits characterized by negative feedback loops (Simpson et al., 2003, 2004).
On the other hand, Gillespie's steady-state fluctuations are much more time-consuming than the approach based on shot noise and transfer functions; moreover, several computational steps are needed to extract noise samples from the time series of protein Tax expression in the de-trending procedure (Weinberger et al., 2008). Here, we obtained similar results by means of a much simpler and immediate approach that can be particularly helpful in a synthetic biology context where it is of interest to evaluate noise propagation. Moreover, the description of noise in the domain of frequency before performing a biological experiment allows introducing noise rejection techniques in the design of gene circuits.
Given such analytic framework, sensitivity analysis was performed. Some results are of potential interest in drug target selection since two model parameters most able to influence SNR and t1/2 were identified: transactivation constant and tax/rex degradation rate. These two parameters can be experimentally tuned: transactivation constant can be affected by preventing Tax phosphorylation with appropriate site-directed mutagenesis (Bex et al., 1999) or, on the opposite, by enhancing this biological process as described in Fontes et al. (1993), and tax/rex degradation rate can be remarkably increased by RNA silencing.
Future developments concern the experimental validation of the main results reported in this article; in particular, testing (i) if affecting Tax phosphorylation, the SNR actually changes letting unaltered Tax expression bursts (Table 2) and (ii) if an increase in tax/rex degradation rate reflects in the shortening of the duration of protein Tax transient expression pulses decreasing limitedly gene circuit SNR (as indicated in Fig. 3 and Table 2). These validations should be feasible since the HTLV-1-derived gene circuit schematized in Fig. 1 can be easily implemented in laboratory by deletion of protein Rex initiation codon, as done in Gröne et al. (1996).
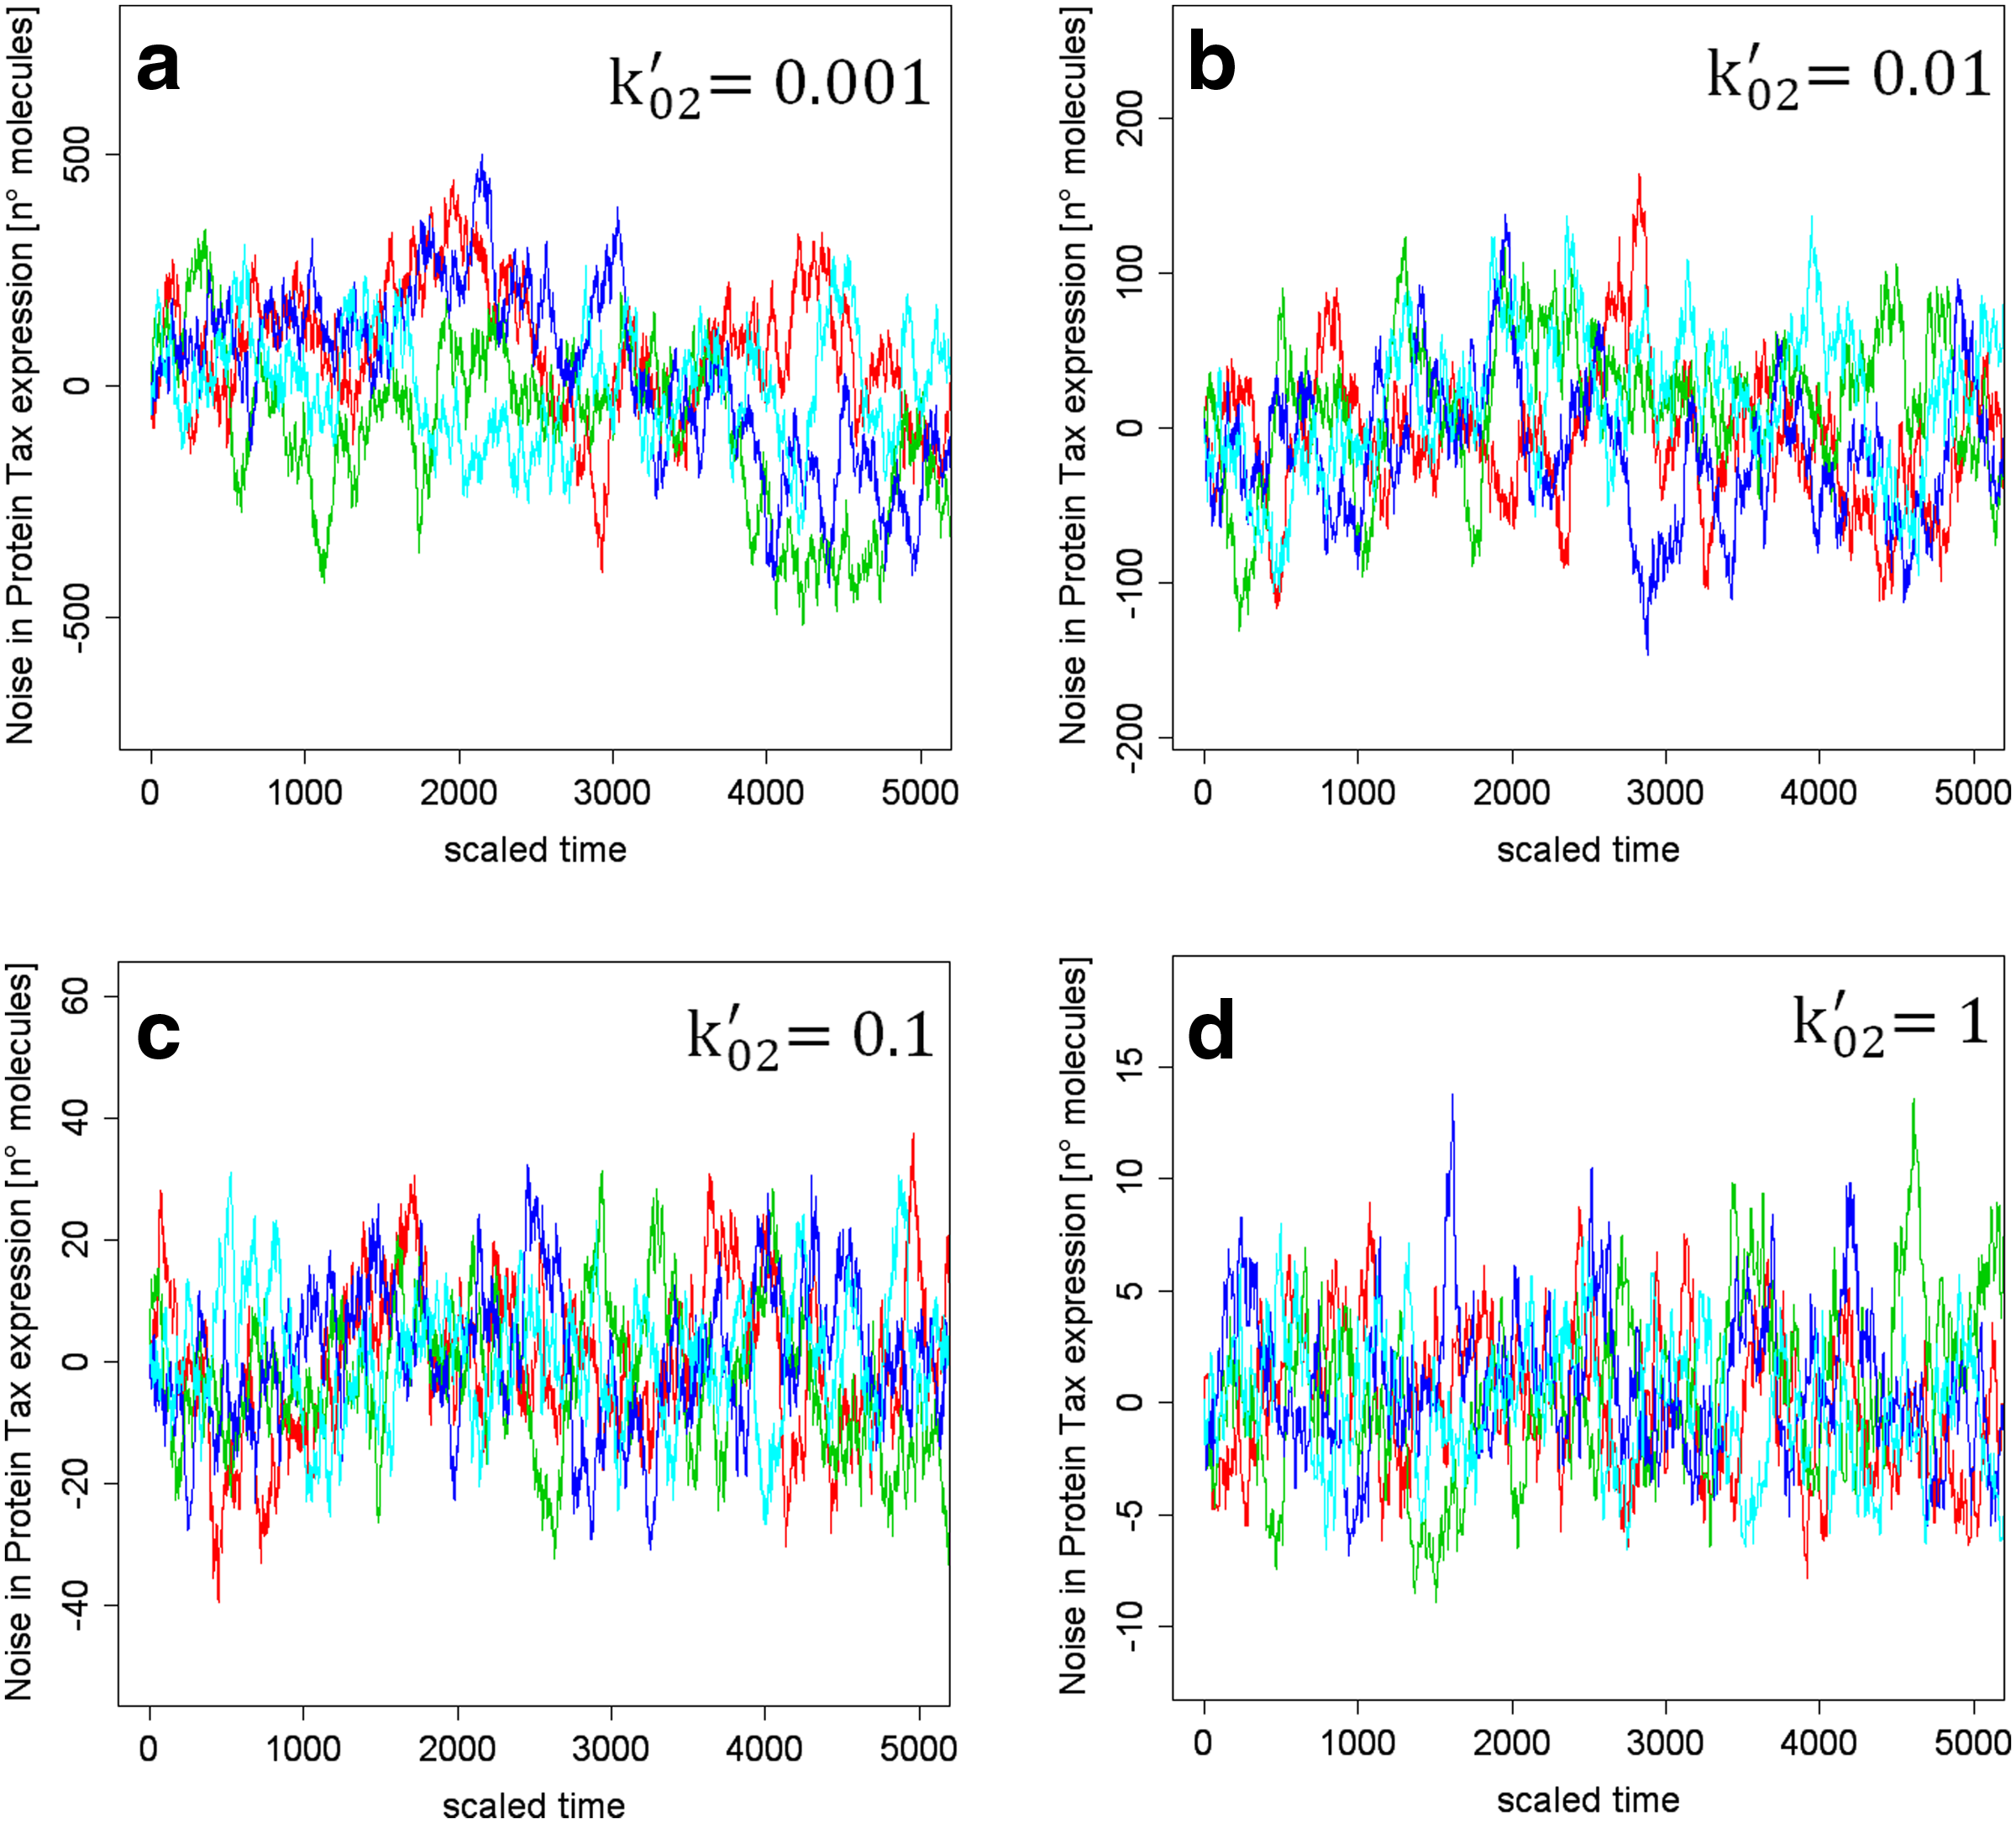
Relationship between protein Tax bursts and tax/rex degradation rate. Realizations of Gillespie's steady-state fluctuations for different values of tax/rex degradation rate k′02 show that the amplitude of protein Tax bursts markedly reduce due to an increase of k′02.
As regards the theoretical analysis of the retrovirus gene circuit, it can be extended by considering different noise models, e.g., based on the experimental observations of Golding et al. (2005). A further extension regards modeling the extrinsic noise (Elowitz et al., 2005), i.e., the variability due to different amounts of cellular molecules like RNA polymerase or cellular transcription factors. Here, this noise component was neglected because, with low multiplicities of infection, these reactants are in great excess with respect to the viral promoters they interact with; hence, they behave like constant amounts in the chemical kinetics (Connors, 1991) characterizing retrovirus transcription. However, it can be of interest to address the higher MOI case, together with modeling and quantification of extrinsic noise.
In conclusion, in this article we identified two biological processes (Tax phosphorylation and tax/rex degradation) that potentially affect remarkably transactivation, but with distinct effects on the expression of the transactivator protein Tax. This offers some hypotheses, e.g., related to drug target selection, to affect retrovirus expression and the duration of the asymptomatic state in HTLV-1-infected patients, to be experimentally validated.
5. Appendix
5.1. Molecular syntheses and degradations at steady state
Following the definition of shot noise, PSD1 is constant and equal to gag synthesis at steady state, S1SS, multiplied by two (Simpson et al., 2003). S1SS can be obtained by solving Eqs. (4–6) at steady state:
where
Similarly, synthesis and degradation of protein Tax are equal at steady state. Tax synthesis at steady state, S3SS, can be calculated as
5.2. HTLV-1 gene circuit transfer functions
Since the transfer function approach can be applied only to linear systems, linearization of the HTLV-1 model (Eqs. 4–;6) around its steady state is needed. Linearization is justified a posteriori by the small coefficient of variation (4%), the inverse of the gene circuit SNR (24.88; Table 1), which confirms that the fluctuations of Tax expression due to stochastic phenomena are small, on average, with respect to the protein steady-state level.
The unique nonlinear term in the model is the Hill term of Eq. (4) whose Taylor expansion is:
where the higher order terms in the Taylor series have been neglected because we assume only small excursions around
where u represents a constant transcriptional input of the linearized model in Eqs. (18–20):
A Langevin approach (Simpson et al., 2003, 2004) is then applied: additive noise terms ηi(τ), i = 1 … 3, corresponding to noise sources Ni, i = 1 … 3, (Fig. 1) and related to the noise in gag transcription, tax/rex degradation, Tax synthesis and degradation, respectively, are introduced into the linearized HTLV-1 model of Eqs. (18–20):
Finally, the linear differential equations in Eqs. (22–24) are Laplace transformed (Levine, 1996) as follows:
where Qi, i = 1 … 3, are the Laplace transforms of the state variables qi; U(s) is the Laplace transform of the constant transcriptional input u and ηi(s), i = 1 … 3, those of the noise terms ηi(τ). G is the gain of the feedback loop, as results from the linearization of the Hill term in Eq. (4):
The transfer functions expressing the relationships between each noise source and protein Tax expression were found by neglecting the initial values of state variables (as usual when analyzing the forced response of any linear system [Levine, 1996]), considering one noise term at a time as the unique model input and calculating the gene circuit output,
and, subsequently,
Therefore, transfer function H41 can be easily calculated from Eq. (32) as the ratio between output
Analogously, H42 and H43 were calculated as the ratio between
Finally, the system transfer functions can be expressed as a function of frequency:
where j is the imaginary unit and f the frequency (Priestley, 1982).
5.3. Analytic calculation of ACFout
ACFout was calculated by symbolic inverse Fourier transform of PSDout (Eq. 10) using MatLab (www.mathworks.it/) built-in functions.
Footnotes
Acknowledgments
A.C. thanks Sara Valpione for suggestions. This work was supported by CARIPARO 2008/2010 ("Systems Biology Approaches to Infer Gene Regulation from Gene and Protein Time Series Data").
Disclosure Statement
No competing financial interests exist.