
Abstract
Abstract
Classification of the individuals' genotype data is important in various kinds of biomedical research. There are many sophisticated clustering algorithms, but most of them require some appropriate similarity measure between objects to be clustered. Hence, accurate inter-diplotype similarity measures are always required for classification of diplotypes. In this article, we propose a new accurate inter-diplotype similarity measure that we call the population model-based distance (PMD), so that we can cluster individuals with diplotype SNPs data (i.e., unphased-diplotypes) with higher accuracies. For unphased-diplotypes, the allele sharing distance (ASD) has been the standard to measure the genetic distance between the diplotypes of individuals. To achieve higher clustering accuracies, our new measure PMD makes good use of a given appropriate population model which has never been utilized in the ASD. As the population model, we propose to use an hidden Markov model (HMM)–based model. We call the PMD based on the model the HHD (HIT HMM–based Distance). We demonstrate the impact of the HHD on the diplotype classification through comprehensive large-scale experiments over the genome-wide 8930 data sets derived from the HapMap SNPs database. The experiments revealed that the HHD enables significantly more accurate clustering than the ASD.
1. Introduction
There are various sophisticated clustering methods for general data (not limited for clustering SNPs data), many of which (e.g., Ward's method [Team RDC, 2007; Ward, 1963; Ward and Hook, 1963], k-Medoid [Kaufman and Rousseuw, 1990], DBSCAN [Ester et al., 1996], and most of the phylogenetic clustering algorithms such as the famous neighbor joining method [Saitou and Nei, 1987]) require appropriate similarity measures between target objects. Designing accurate similarity measure for the objects to be clustered is essential for these similarity-based clustering algorithms.
For SNPs data, there have been proposed various clustering algorithms for clustering haplotypes (i.e., haplotype-alleles, not diplotypes),1 and various types of similarity measures have been proposed for haplotype data (Jin et al., 2010; Li and Jiang, 2005; Li et al., 2006).2 But the human genome is diallelic, and in many cases we observe only the unordered (i.e., unphased) pair of alleles at each locus, instead of ordered (i.e., phased) allele data, due to the high costs required for deciphering unphased allele data to accurate phased ones. In this article, we call a phased pair of haplotypes a “haplotype-diplotype,” and we call an unphased pair of haplotypes a “unphased-diplotype.”
Much work has been done on clustering the unphased-diplotype data. They can be categorized into two types: distance-based methods (Bowcock et al., 1994; Gao and Starmer, 2007) and statistics-based methods (Falush et al., 2003; Pritchard et al., 2000). The distance-based methods utilize a distance measure between two objects, while statistics-based methods are based on the statistical behavior of objects. In this article, we focus on the distance-based clustering methods for unphased-diplotype data. Most previous distance-based methods utilize a similarity measure called the allele sharing distance (ASD) (Gao and Martin, 2009; Jakobsson et al., 2008; Mao et al., 2007; Witherspoon et al., 2007) (see Section 2.1.1). The ASD is a simple and straightforward extension of the Hamming distance, and is the most standard and frequently used similarity measure between a pair of unphased-diplotypes.
In genetic analysis, it is very important to consider properties of populations that are different among genetically distinct populations (Beaty et al., 2005; Fallin et al., 2001; Witherspoon et al., 2007). It should also be true with designing similarity measures for unphased-diplotypes. But the measure ASD does not utilize any population information in obtaining the similarity values. Thus, in this article, we will first propose a new similarity measure called the population model-based distance (PMD) for unphased-diplotypes, which incorporates the population information from an appropriate population model. As the model, we will propose to use an hidden Markov model (HMM)–based model predicted by a standard HMM-based phasing software called HIT (Rastas et al., 2005). We call the PMD based on the model the HHD (the HIT HMM-based distance). We will show the superiority of our new measure HHD over the previous standard ASD through comprehensive experiments over the genome-wide HapMap data (International HapMap Consortium, 2005).
The organization of this article is as follows. In Section 2, we describe previous work on which our method is based. In Section 3, we describe our new measure. In Section 4, we compare the ASD and the HHD through comprehensive experiments over large-scale HapMap data sets to evaluate the impact of the HHD. In Section 5, we conclude.
1.1. Notations and definitions
We assume all SNPs are diallelic. We consider n diplotypes over m SNP loci from the same chromosome. These loci are numbered
2. Previous Work
In this section, we describe previous work on which our work is based. In Section 2.1, we describe the definitions of measures in previous work (e.g., the ASD). In Section 2.2, we describe the HIT algorithm on which our new distance measure is based. In Section 2.3, we describe a clustering algorithm and an evaluation method for clustering that we will use in the experiments in Section 4.
2.1. Previous measures for inter-individual genetic distances
2.1.1. Allele sharing distance
The most standard inter-diplotype distance is the ASD (Gao and Martin, 2009; Jakobsson et al., 2008; Mao et al., 2007; Witherspoon et al., 2007), defined as follows. For two unphased-diplotypes
where
2.1.2. Haplotype similarity measure
The most common and simplest measurement for the similarity between DNA sequences, including the haplotype-allele data, is the hamming distance (Cover and Thomas, 1991; Isaev, 2004; Lesk, 2005; Li and Jiang, 2005; Tzeng et al., 2003). For a haplotype-allele
where I(a, b) = 0 if a = b and I(a, b) = 1 otherwise. As the hamming distance is length-dependent, we define the following A(
2.2. HIT algorithm
The Haplotype Inference Technique (HIT) algorithm (Rastas et al., 2005) is an HMM-based algorithm for phasing unphased-diplotypes. The algorithm utilizes the HMM (Rabiner and Juang, 1986). The HMM of the HIT is designed to simulate multiple set of ancestors (i.e., founders).3 The HMM is trained from a set of unphased-diplotypes in an unsupervised way with the EM algorithm (Durbin et al., 1998). Figure 1 shows the HMM model used in the HIT. The HIT algorithm phases an unphased haplotype-diplotype by heuristically finding the haplotype-diplotype with the highest emission probability from the HMM.
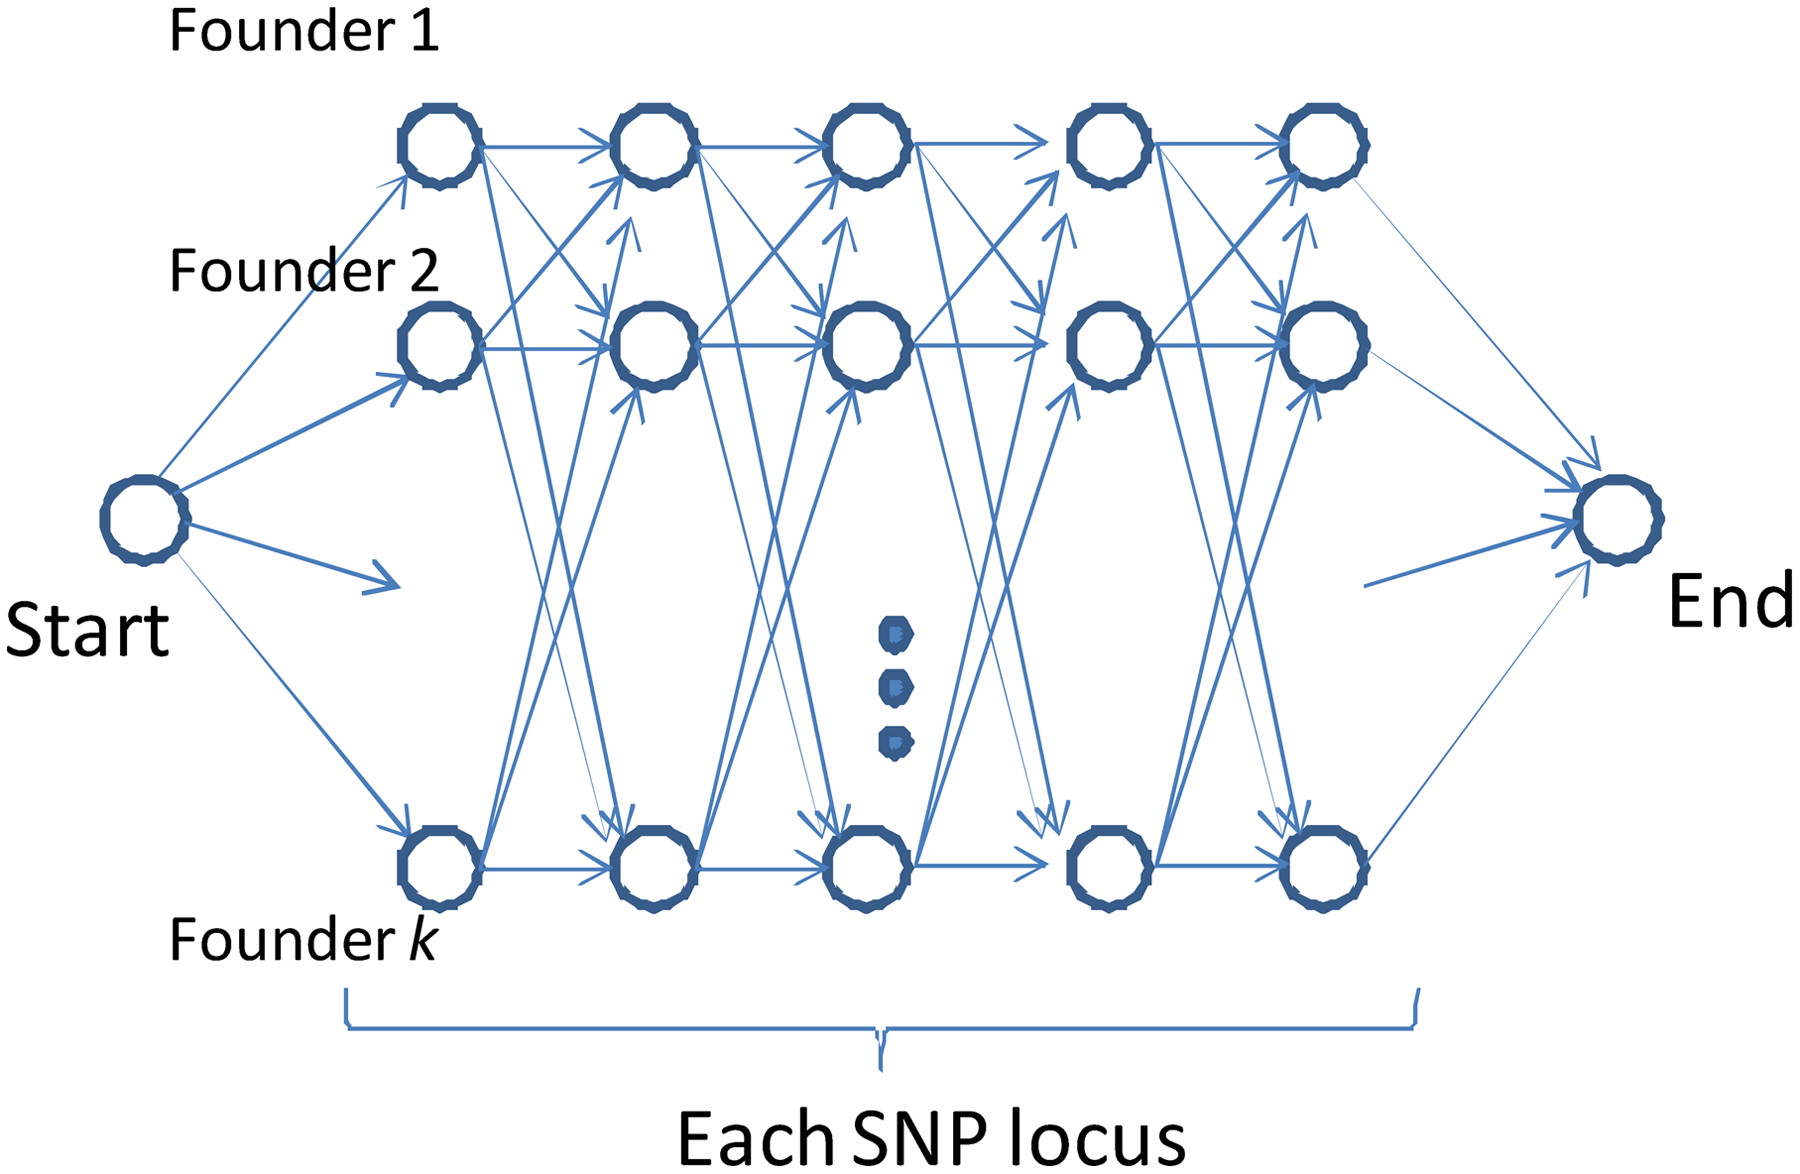
The HMM model of the HIT. In the HMM, a set of nodes in a row corresponds to states of one founder (i.e., ancestor) haplotype-allele. A set of nodes in a column corresponds to states of one locus. Each node (except for the start and end nodes) emits 1 or 0 with some estimated probabilities, which correspond to the major and minor alleles respectively. A path from the start node to the end node corresponds to a haplotype-allele. The HMM emits a haplotype-diplotype as an unordered pair of two paths from the start node to the end node, randomly based on the probabilities estimated for edges. The observers can only see the unphased-diplotype that corresponds to the emitted haplotype-diplotype.
2.3. Clustering methods
In this section, we describe the clustering method and the method for evaluating the results, which we will use in Section 4.
2.3.1. Ward's method
We use Ward's minimum variance algorithm (Team RDC, 2007; Ward, 1963; Ward and Hook, 1963), which is a widely used hierarchical clustering method, to infer clusters based on the ASD or the HHD in Section 4.4 Given n items
2.3.2. How to evaluate the clustering results
To evaluate the clustering results, we use the classification error rate (CER) (Gao and Starmer, 2007). The CER is the rate of elements that are assigned to incorrect clusters in clustering results. To know the assignment is correct or not, we need to know the labels of each cluster, but Ward's algorithm does not assign any labels onto the output clusters. In the experiment, we use the minimum CER among all the possible assignments of the population labels, to evaluate the clustering results.
3. New Unphased-Diplotype Distance Measures
In this section, we first propose in Section 3.1 a new measure for the distance between two unphased-diplotypes, the PMD. The PMD is a general concept of distance measures, and we will give an example of the PMD which we call the HHD in Section 3.2. In Section 3.3, we discuss the properties of the proposed measures.
3.1. Population model–based distance
Before defining our new measure called the PMD, we first extend the haplotype similarity measure described in Section 2.1.2 so that we can deal with the distances between two haplotype-diplotypes instead of haplotype-alleles, as follows. Let a = {
where A is the haplotype similarity measure defined in Section 2.1.2. But we cannot compute this value for unphased-diplotypes, as we cannot know the actual haplotype-diplotypes. To enable it, we extend the above haplotype-diplotype distance H for unphased-diplotypes by utilizing some given population model
For any unphased-diplotype, we can enumerate corresponding haplotype-diplotype candidates.6 For example, there are four haplotype-diplotype candidates for unphased-diplotype {1, 0} − {1, 0} − {1, 0}, i.e., {111, 000}, {110, 001}, {101, 010}, and {011, 011}. For unphased-diplotypes
If we were given a population model
where
3.2. HIT HMM-based Distance
To compute the PMD in Section 3.1, we need an appropriate model for the population. In the following, we propose an example of the PMD that we call the HHD.8 To define the HHD, we propose to use the HMM model used in the HIT algorithm (Rastas et al., 2005) (described in Section 2.2) as the population model for the PMD as follows.
The HMM defined in the HIT algorithm can be considered as a predicted population model. Thus, we first train the HMM from all the unphased-diplotype data that are in our hand, and then we define the HHD as follows. Let
Note that the probability of each haplotype-diplotype candidate is computed as the conditional emission probability of the candidate from the HMM, which can be computed by the forward algorithm (Durbin et al., 1998) for the HMM.
3.3. Discussions on the PMD
3.3.1. The PMD and the multiple founder hypothesis
In many regions (especially in important regions) of the human genome, the haplotype-alleles of the majority in populations can be categorized into a small number of types (Bhatia et al., 2010; Cirulli and Goldstein, 2010), which suggest that only a small number of founder (or ancestral) haplotype-alleles spread over the population on those regions. This hypothesis of the existence of (a few but) multiple founder haplotype-alleles is very important and effective for various kinds of research, for example, the design of the experiments of linkage disequilibrium mapping (Chung et al., 2008; Gonzalez et al., 1999; Haiman et al., 2003) and the evolutionary history analysis of populations (Ahmad et al., 2002; Gaudieri et al., 1997).
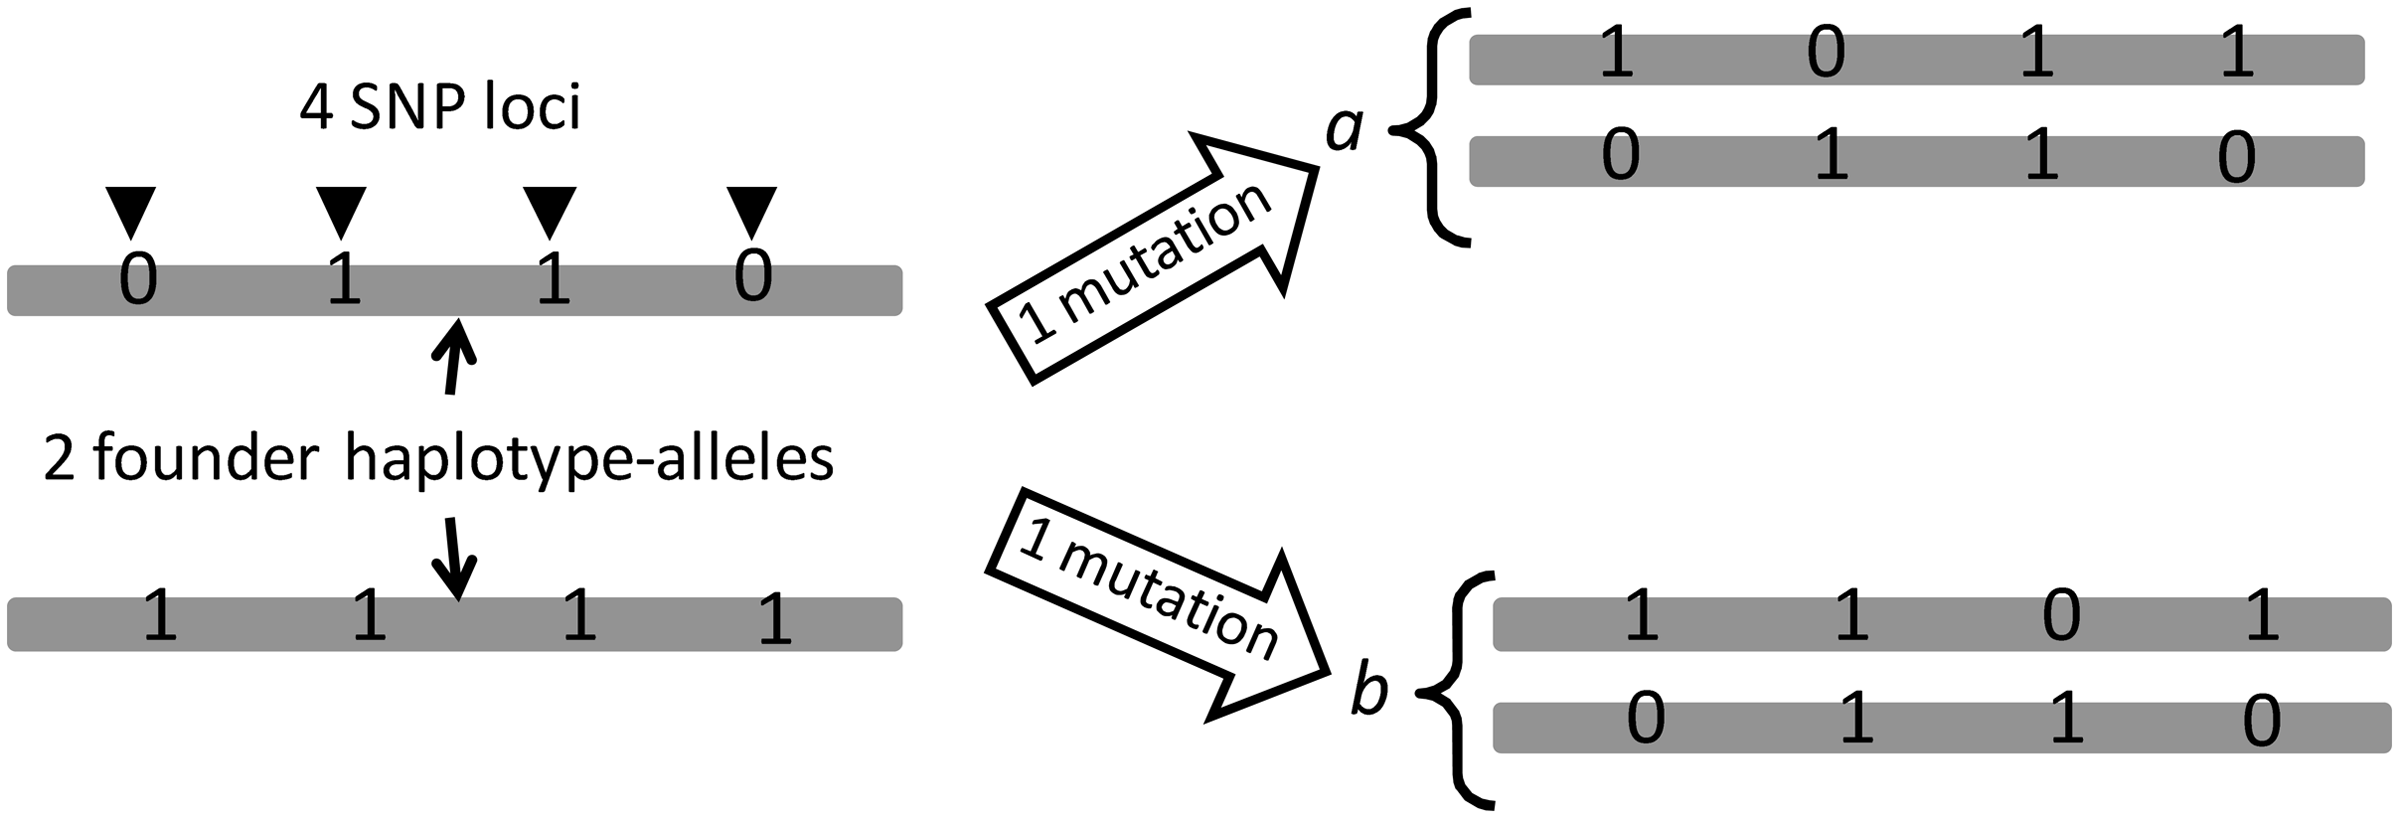
The PMD well reflects the existence of the founder haplotype-alleles. In the example given in Figure 2, there are three individuals with haplotype-diplotypes a = {1011, 0110}, b = {1101, 0110}, and c = {1111, 1000}, but we assume that we know only the unphased-haplotypes, i.e., {1, 0} − {1, 0} − {1, 1} − {1, 0}, {1, 0} − {1, 1}-{1, 0} − {1, 0} and {1, 1} − {1, 0} − {1, 0} − {1, 0}, respectively. We can easily see that the ASD between any two of these three individuals is 0.25 (Table 1(1)), and therefore we cannot cluster these three individuals based on the ASD.

Haplotype-diplotype examples on which we can observe difference between the ASD and the PMD.
The distance between two sequences are often measured by the number of point mutations between them (i.e., we consider two sequences to be very distant to each other if there are many mutations between them). We can define the number of mutations under the assumption of existence of multiple founder haplotype-alleles (for details, see the Appendix). Table 2 shows the number under the assumption that there are two founder haplotype-alleles. According to the table, the clustering result of the three individuals should be the one in Figure 3, which cannot be obtained with the ASD. Note that the clustered individuals a and b share the same haplotype-allele, i.e., 0110, which also supports the validity of the clustering result.

Clustering results for individuals in Figure 2 based on the numbers of mutations (Table 2),
See Appendix how we obtain the number of mutaions for each pair of individuals.
Unlike the ASD, the haplotype-diplotype distance H reflects the numbers in Table 2 very well. The H value between individuals a and b is 0.25, which is the same value as the ASD, but H between a and c and H between b and c are 0.5 (Table 1(2)), which enable us to cluster the individuals as in Figure 3. It means the H values are more appropriate than the ASD values under the existence of the founder haplotype-alleles, at least in this case.
But we cannot compute the real H values unless we know the real haplotype-diplotypes. Instead, we can estimate them by computing the PMD if we are given some population model. Consider the two population models given in Table 3, where haplotype frequencies in the population are given.9 Under the model
If we cluster the three individuals based on the
3.3.2. Influences of the linkage equilibrium
It is easy to imagine that the linkage equilibrium (LE) and the linkage disequilibrium (LD) should affect the similarity measures. In fact, the variance of the distribution of the ASD values among the individuals should converges to some value in Θ(1/m) where m is the number of the SNP loci in the region according to the central limit theorem, if the loci are independent to each other. It means that the variance of the ASD values should be smaller on the regions of LE. The PMD and its example HHD should also be influenced by the LE/LD. We compared the influences of the LE/LD to the ASD and the HHD by checking distances on the LE/LD regions obtained from the HapMap database (release 24) (International HapMap Consortium, 2005) as follows.
We can determine whether a region is near to LE or to LD by counting the number of haplotype tagging SNPs (htSNPs) (Carlson et al., 2004; Johnson et al., 2001; Ke and Cardon, 2003; Meng et al., 2003; Rinaldo et al., 2005). The htSNPs are selected so that each SNP in the given region has a correlation larger than a threshold with at least one of the htSNPs. Thus, the regions with many htSNPs can be considered to be near the LE, and regions with few htSNPs can be considered to be near the LD.
We divided the set of SNPs in chromosome 1 into 658 blocks, each of which consists of 100 consecutive SNPs. For each block B, we counted the number hB of htSNPs obtained by the software Tagger (de Bakker et al., 2005) with the default settings. We selected 100 blocks with the 100 smallest hB values as the LD regions and also selected 100 blocks with the 100 largest hB values as the LE regions.
For each of all these regions, we computed the ASD and the HHD measures among the 270 individuals in HapMap (which are the same as the 270 individuals used in Section 4), and computed the variances among the obtained 270 × 269/2 = 36315 distances of the ASD and of the HHD. Table 5 shows the difference between the variances of the ASD and the HHD measures. According to the P-values in the table, the HHD reflects the LD/LE effects more than the ASD.
The LE and LD columns show the means of variances on the LE regions (i.e., regions with many htSNPs) and those on the LD regions (i.e., regions with a few htSNPs), respectively. The difference of the variances between weakly and highly correlated regions are tested by t-test for each of the measures. The P-value column shows the P-value of the t-test.
4. Application To Hapmap Data Sets
4.1. Data sets
In the experiments in Section 4.2, we will use the unphased-diplotype data sets of 22 autosomal chromosomes and X chromosome derived from HapMap release 24 (International HapMap Consortium, 2005). The data sets consist of unphased-diplotypes of 270 individuals: 90 Yoruba in Ibadan, Nigeria (YRI); 90 Utah residents with ancestry from northern and western Europe (CEU, from the CEPH diversity panel); and 90 Japanese in Tokyo, Japan, and Han Chinese in Beijing, China (CHB + JPT). There are 894,398 SNPs that are genotyped for all the above 270 individuals, which we used for our experiments. We divided the SNP set into 8,930 blocks, each of which consists of consecutive 100 SNPs, and we will perform comprehensive experiments against each of these blocks in Section 4.2.
4.2. Experimental results
In this section, we demonstrate the impact of incorporating the population information, by comparing the clustering accuracies by the ASD and that by the HHD on the HapMap data described in Section 4.1. Against each of the 8,930 blocks, we performed Ward's clustering algorithm (see Section 2.3.1) based on the ASD and also did the same based on the HHD, and compared the CERs (see Section 2.3.2) of their results (Table 6). The difference of the results in relation to the number of htSNPs, i.e., hB (see Section 3.3.2), is also shown.
The ♯blocks column shows the numbers of blocks with the specified hB values. In the Comparison of CERs columns, the CERASD < CERHHD/CERASD > CERHHD/CERASD = CERHHD columns show the numbers (and the ratios) of data (with the specified hB values) where the ASD performed better/the HHD performed better/the performance of the two measures are exactly the same, respectively. x ∼ y indicates that x ≤ hB < y, and * means the result of the sign test is significant (i.e., ≤ 0.05).
The mean of CERs based on the HHD (i.e., 0.3557) is better than that for the ASD (i.e., 0.3611). The P-value of the t-test to see the difference between them is 0.004177, which means the CERs of the HHD is significantly better than that of the ASD. The number of data sets where the HHD (or the ASD) shows better performance than the ASD (or the HHD) are checked with the sign test. Among all the data sets, the HHD is superior to the ASD on 4366 data sets and inferior to the ASD in 3696 data sets. The results of two measures were the same in the other 868 data sets. The P-value of the sign test of all of these results is 8.98 · 10−14, which means that the HHD is significantly superior to the ASD.
The CERs decrease with increasing hB for both the ASD and the HHD, but the differences of CERs between the ASD and the HHD also increases as hB increase (Fig. 4). We call the result HDD's success if the HHD's CER is lower than that of the ASD, and vice versa. The ratio of the HHD's success increases with increasing hB. The ratio of ASD's success also increases with increasing hB. The difference of ratios of success between the ASD and the HHD is getting larger as hB increases. The ratio of the case when the ASD and the HHD have the same results are getting lower as hB increases (Fig. 5).
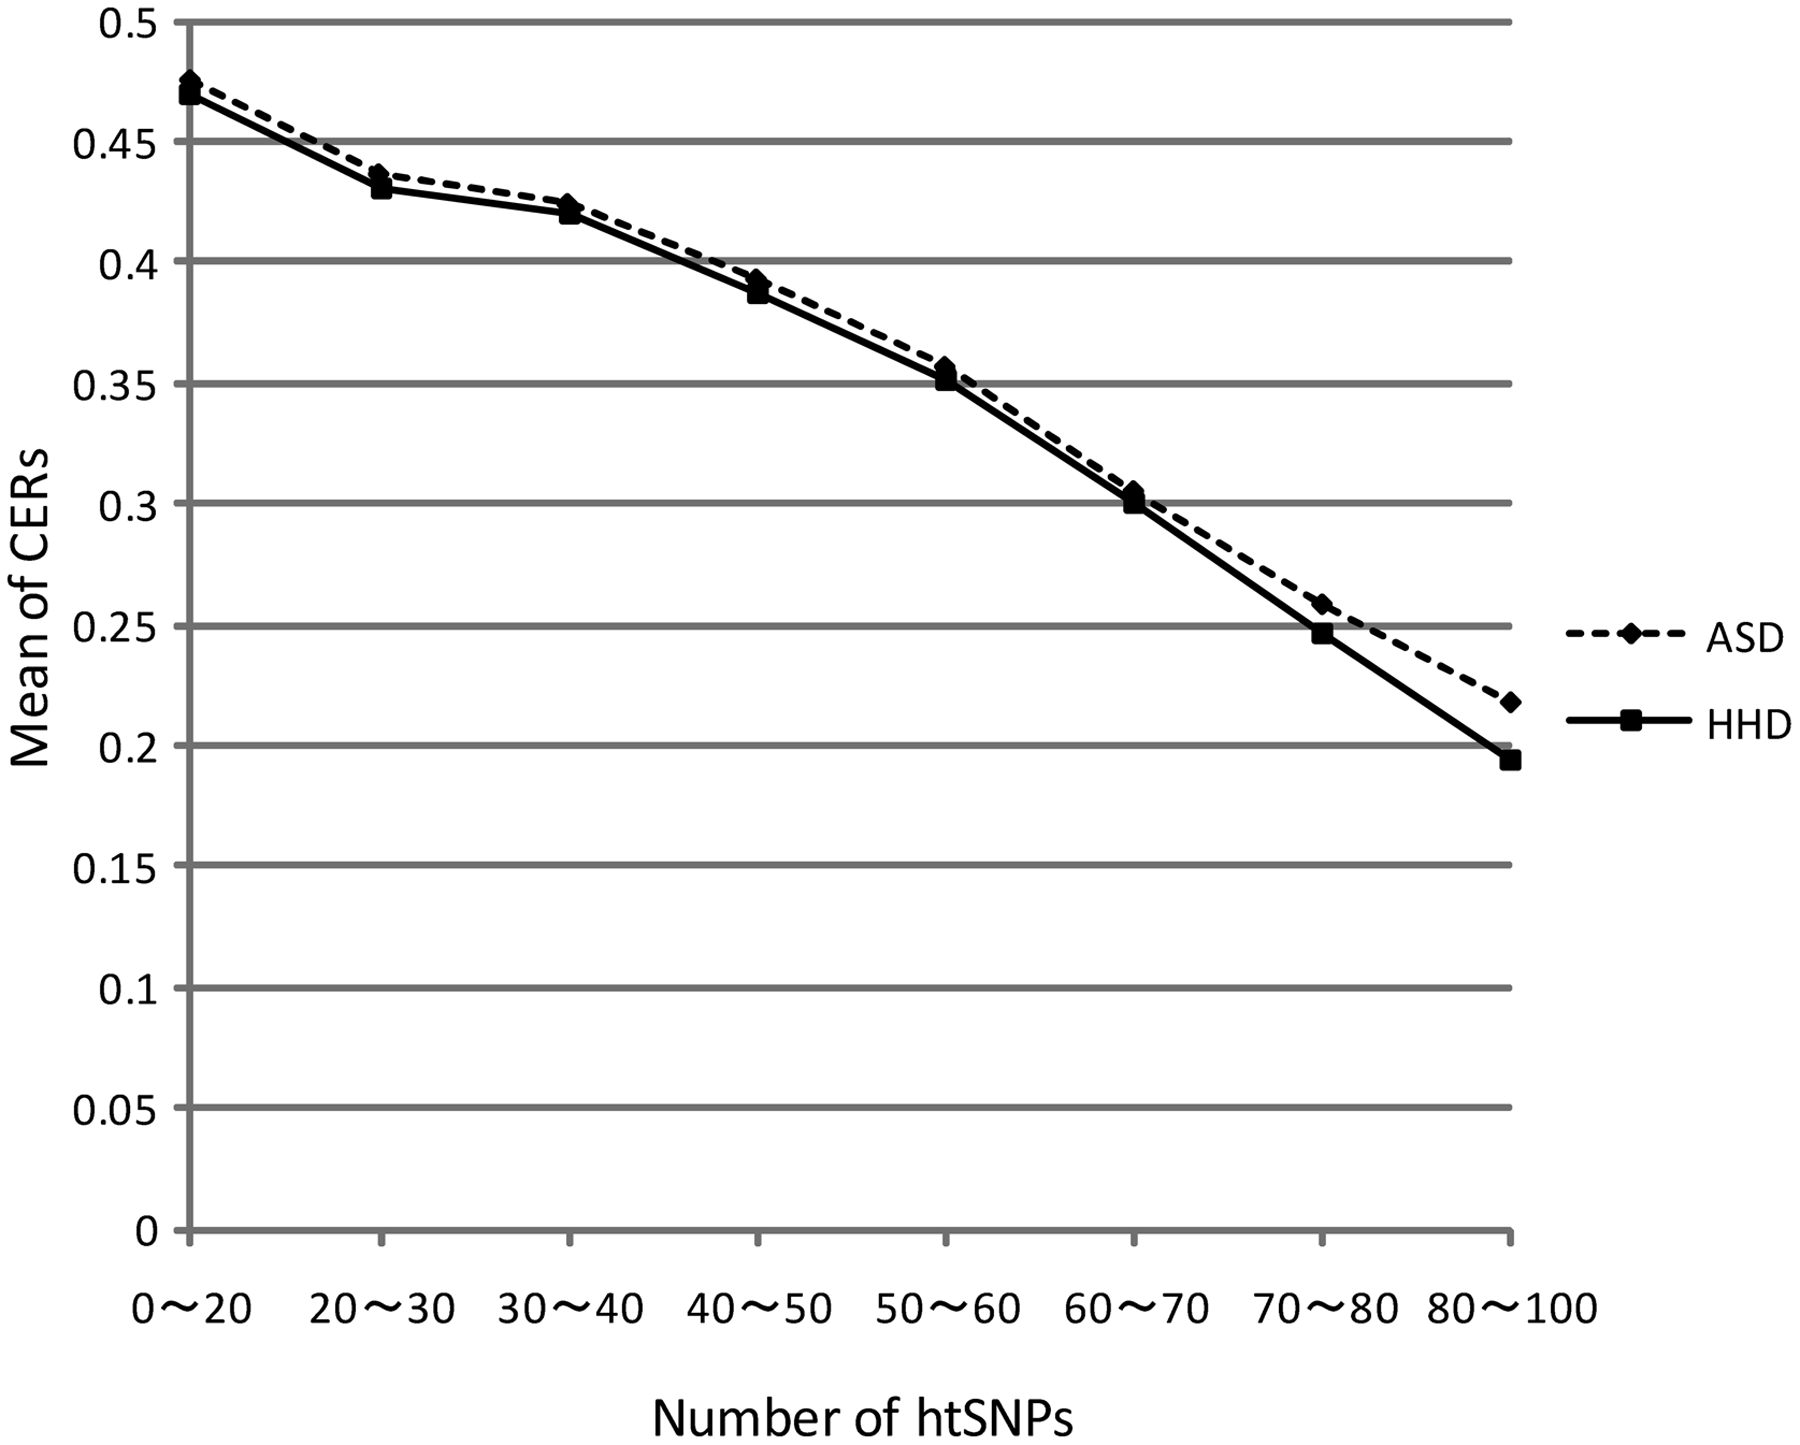
The plot of hB values and the means of CERs for both the ASD and the HHD. x ∼ y indicates that x ≤ hB < y. The HHD is superior to the ASD in all the cases.
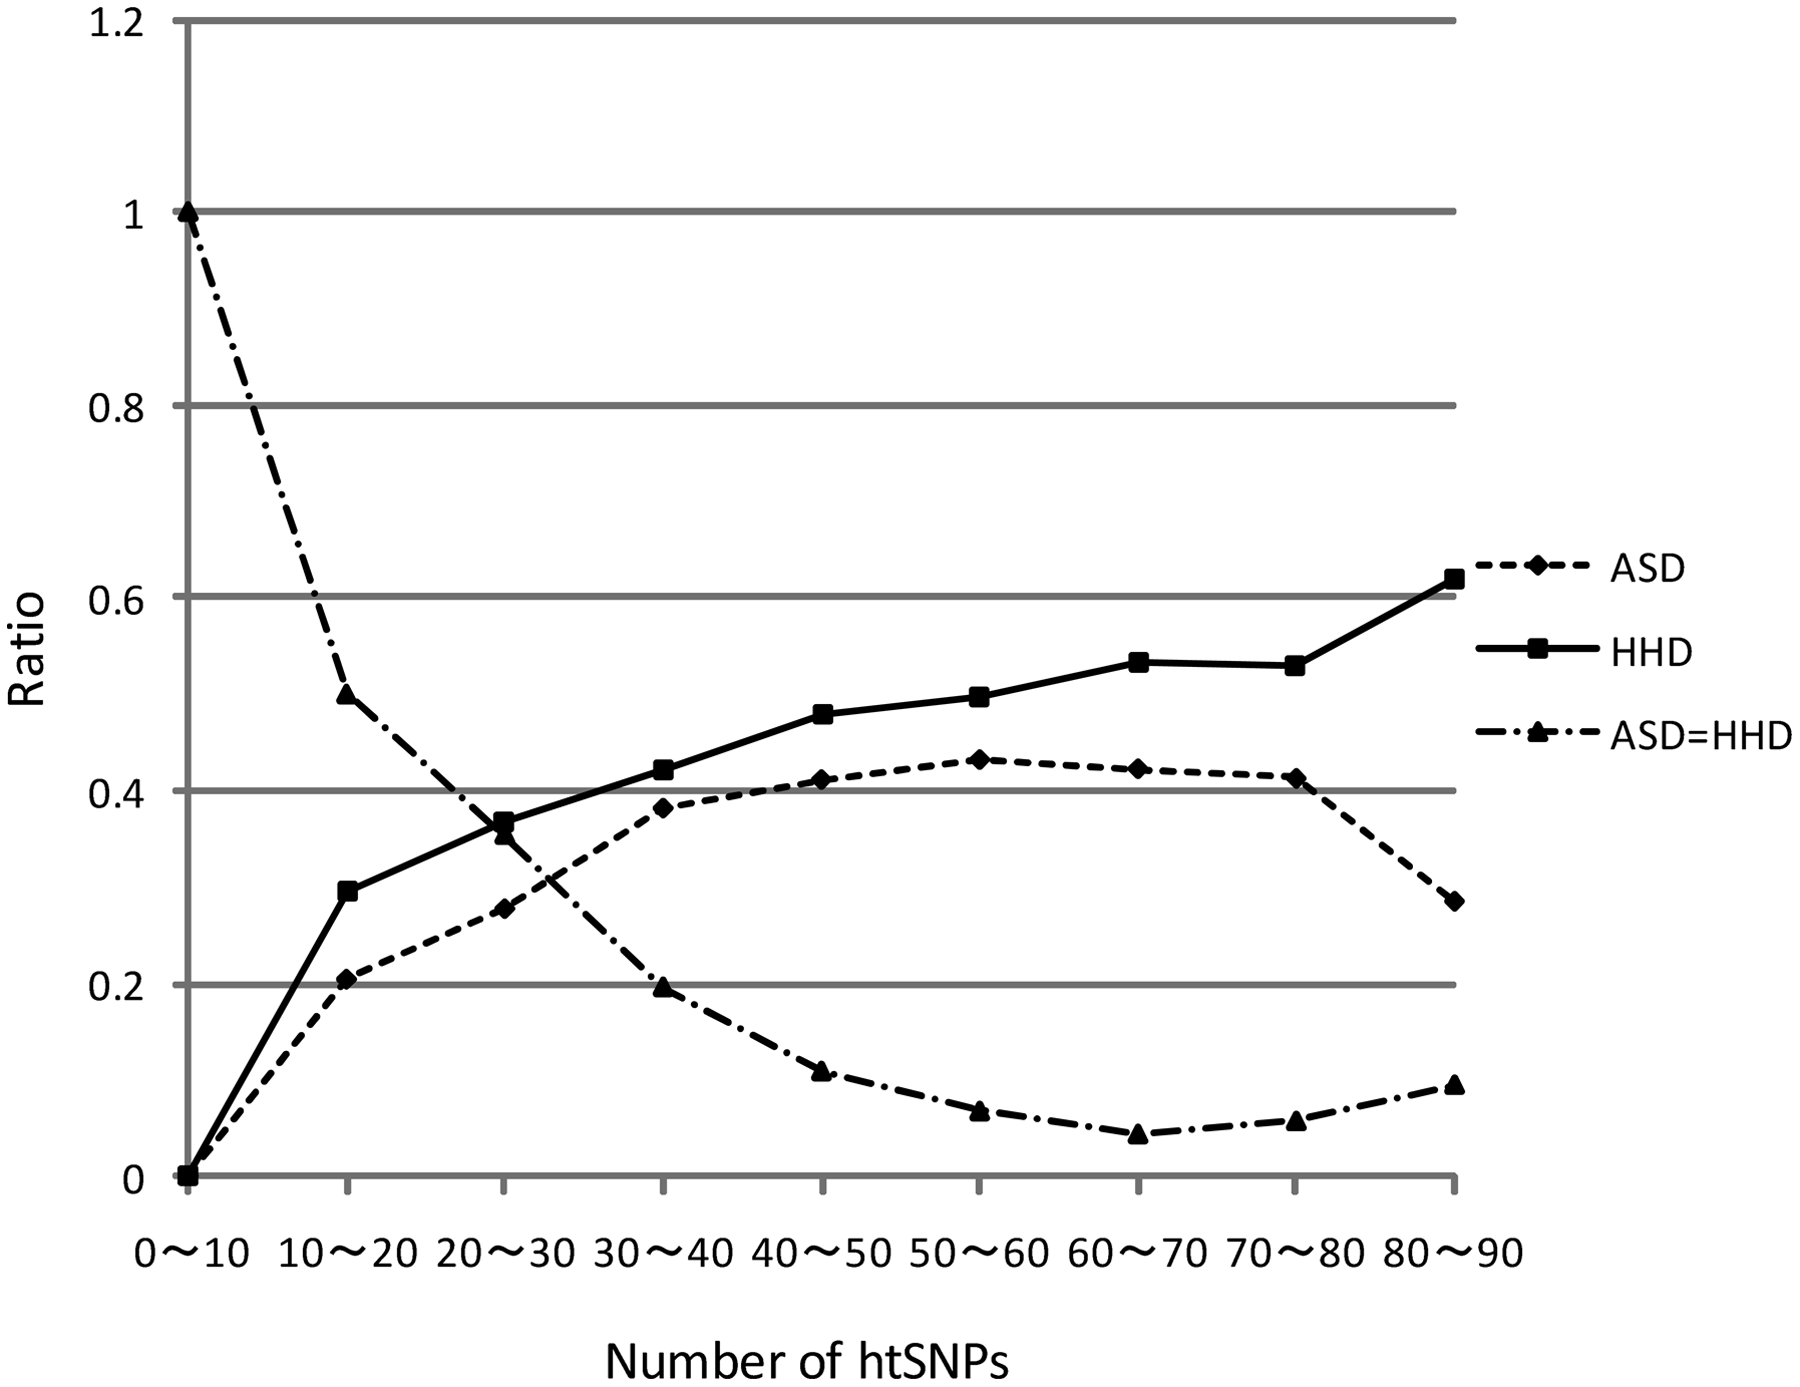
The plot of hB values and the ratios of success for both the ASD and the HHD. The line ASD = HHD indicates the results in which the performance of the two measures are the exactly the same. x ∼ y indicates that x ≤ hB < y. The HHD is superior to the ASD in all the cases.
The HHD is superior to ASD especially when 80 ≤ hB < 90. It is a reasonable result as we should be able to better cluster individuals if we have more information (i.e., LE). The difference of ratios of success between the ASD and the HHD also becomes largest when 80 < hB < 90. In this case, the HHD is superior on 13 data sets, while the ASD is superior only on six data sets among the remaining 18 data sets.
5. Conclusion
We proposed a new inter-diplotype similarity measure that we call the PMD. The PMD improves the previous ASD measure by utilizing a population model. As one of such population models, we propose to use the HMM population model used in the phasing algorithm HIT. We call the PMD based on the HIT's HMM the HHD. The HHD utilizes the predicted conditional probabilities of haplotype-diplotypes of unphased-diplotype emitted from the HIT's HMM. Based on comprehensive experiments over 8930 genome-wide data sets of HapMap, we showed that the HHD significantly outperforms the ASD. We also discussed the relationships between the clustering accuracies and the LD.
There are many future tasks to do related to this work. The HHD requires much larger computation time than the ASD, and one future task should be to improve the computation speed of the HHD. There are still data sets for which the HHD is not superior to the ASD. It would be very interesting if we can predict the regions where the HHD is inferior to the ASD, before computing these measures. Another future task is to improve the population model, as it should directly improve the performance of the PMD. From the biological viewpoint, it would also be very interesting if we can utilize our clustering algorithms to identify gene functions of the target genome regions, especially the regions that affect the disease prevalence and drug responses (Bamshad et al., 2004; Wiencke, 2004; Wilson et al., 2001).
6. Appendix
Counting number of mutations under founder hypothesis
Suppose that founder haplotype-alleles
where dist() denotes the ordinary number of mutations between the two sequences.
But we cannot know the appropriate set of founder haplotype-alleles. Instead, we can define the number of mutations between two individuals under the assumption that there are m founders as
Table 2 shows all the
The optimal founder haplotype-allele pair (when m = 2) for the individuals a and b in Figure 2.
Footnotes
Acknowledgments
The experiments in this work were done on the Super Computer System of the Human Genome Center, the Institute of Medical Science, the University of Tokyo.
Disclosure Statement
No competing financial interests exist.
1
2
3
According to Rastas et al. (2005), the optimal number of ancestors is around 7 for most cases. Thus, we also use the HMM model with 7 ancestors in the experiments in ![]() .
.
4
We used the statistical software, R, to implement this algorithm.
6
Phasing is the process of finding the most probable haplotype-diplotype, utilizing some population information.
7
Note that ![]() ), we ignore candidates with very small probabilities.
), we ignore candidates with very small probabilities.