




Abstract
Abstract
One of the critical stages in drug development is the identification of potential side effects for promising drug leads. Large-scale clinical experiments aimed at discovering such side effects are very costly and may miss subtle or rare side effects. Previous attempts to systematically predict side effects are sparse and consider each side effect independently. In this work, we report on a novel approach to predict the side effects of a given drug, taking into consideration information on other drugs and their side effects. Starting from a query drug, a combination of canonical correlation analysis and network-based diffusion is applied to predict its side effects. We evaluate our method by measuring its performance in a cross validation setting using a comprehensive data set of 692 drugs and their known side effects derived from package inserts. For 34% of the drugs, the top scoring side effect matches a known side effect of the drug. Remarkably, even on unseen data, our method is able to infer side effects that highly match existing knowledge. In addition, we show that our method outperforms a prediction scheme that considers each side effect separately. Our method thus represents a promising step toward shortcutting the process and reducing the cost of side effect elucidation.
1. Introduction
Beyond the development of new drug leads, a critical stage in drug development is the identification of side effects that result from treatment with the drug. Drug safety has gained much attention in recent years, and has become a serious bottleneck in drug development, leading to the reduction in the number of newly approved drugs despite the enormous research efforts invested in drug discovery (Billingsley, 2008). The elucidation of adverse reactions may occur long after the approval of a drug, as in the case of rosiglitazone maleate (Avienda®), and can even lead to discontinuing the use of the drug, as in the case of rofecoxib (Vioxx®) (Moore et al., 2007).
Previous attempts to relate drugs to their side effects are few and depend on specific information on the drug in question, that is not available at large scale. Xie et al. (2009) used protein-ligand binding predictions to identify off-targets for a given drug. The latter were used to pinpoint known pathways that are likely to be affected by the drug and consequently predict its side effects. This approach depends on protein structure information and accurate pathway information, which greatly limits its applicability. In particular, biological processes involved in side effect reaction to treatment are still largely unknown and inferring side effects, even when given the respective drug targets, remains a formidable task (Need et al., 2005). Cruz-Monteagudo et al. (2006) used the so-called MARCH-INSIDE chemical descriptors to represent drug molecules. Using these descriptors, they built a classification function for each side effect independently by applying linear discriminant analysis (LDA). Unfortunately, the authors did not test their approach on randomized data. Thus, it is hard to assess the quality of their method.
In contrast to the sparse work on side effect prediction, the related area of elucidating gene-disease and drug-target associations has become very active in recent years. State-of-the-art methods for predicting gene-disease associations are based on the observation that genes that cause similar diseases tend to lie close to one another in a network of protein-protein interactions (Oti et al., 2006; Franke et al., 2006). Given a query disease, genes causing similar diseases are identified, and a network-based computation is used to prioritize candidate genes according to their proximity to this initial set (Kohler et al., 2008; Vanunu and Sharan, 2008; Wu et al., 2008). Several methods have been suggested for drug-target prediction. Campillos et al. (2008) construct a comprehensive drug-side effect data set and use it, in conjunction with chemical properties, to define a similarity metric between drugs. Given a query drug, they identify similar drugs and propose their targets as candidate targets for the drug. Yildirim et al. (2007) examine a drug-target network in which drugs are connected based on shared targets and find that drug cluster according to the Anatomical Therapeutic Chemical (ATC) classification. Despite the insights offered by this network, no prediction scheme was suggested. A somewhat related work by Yang et al. (2009) uses text mining to highlight genes responsible for serious adverse drug reactions. Finally, Kutalik et al. (2008) integrate gene expression data and drug response data under different cell lines. They identify co-modules of genes and drugs with similar behavior across a subset of the cell lines, leading to the prediction of new drug targets.
Here we present a systematic approach for predicting side effects for drugs. Our approach combines two algorithms to predict side effects. The first algorithm is based on canonical correlation analysis which is used to obtain a low dimensional subspace that jointly contains drug-side effect associations and molecular data on drugs, such as their chemical structure. Data on new drug queries are projected onto this subspace and an efficient algorithm is used to identify corresponding side effect vectors that best correlate with the projected data. The second algorithm is based on diffusion in a side effect similarity network. Starting from a prior solution that is based on the side effects of drugs that are similar to the query, a diffusion process is used to obtain final scores that are smooth over the network. Both algorithms consider all known drug-side effect associations for the prediction task. We show that this approach is better than an approach based on analyzing each side effect independently.
We evaluate our method by measuring its performance in 20-fold cross validation using a comprehensive data set of 692 drugs and their known side effects derived from package inserts. For 34% of the drugs, the top scoring side effect matches a known side effect of the drug; for almost two thirds of the drugs, our method infers a correct side effect among the five top ranking predictions. In comparison, applying the algorithm to randomized instances, “correct” predictions are obtained for only 10% (top ranking) or 32% (among the five top ranking) of the drugs. Furthermore, we show that an attempt to analyze the data by considering each side effect independently results in reduced performance with only 14.7% correct predictions for the top scoring side effect.
We further validate our method in a blind test on ∼450 drugs that were not part of the initial data, but for which some side effect information exists in the literature. Remarkably, even on these unseen data, our method is able to infer side effects that highly match existing knowledge: for 45% of the drugs, a correct side effect is included among the five top ranking predictions. Finally, we show the utility of our method in drug target elucidation. We make predictions for over 4,000 drugs for which no side effect information is readily available. We then show a significant correlation between the side effect similarity and target similarity among these drugs. Not only does this agree with a previous study that used this correlation to predict drug targets (Campillos et al., 2008), but importantly, it suggests that target prediction algorithms can be applied also in the vast regime of drugs whose side effects have not been mapped to date.
2. Algorithmic Approach
We present two novel algorithms for predicting side effects, which are then combined to yield the final ranking of side effects for a given drug. The first algorithm is based on canonical correlation analysis. It requires as input an attribute matrix describing the drugs. In a training phase, it learns a linear projection of the attribute and side effect data onto a joint low-dimensional space such that per drug, the correlation between the projected vectors of attributes and side effects is maximized. This projection is then used to infer the side effects of a test drug. The second algorithm is based on diffusion in a side effect similarity network. Given a query drug, the algorithm first identifies side effects of similar drugs. Starting from these side effects, a diffusion process is executed to obtain a final ranking that is smooth over the side effect network.
In the following, we denote the number of drugs by n and the number of side effects by m. We assume that we are given as input a drug attribute matrix Rp×n, in which each drug is described by a set of p attributes; a drug–side effect association matrix Em×n; and an attribute vector q for a query drug. In a preprocessing step, we normalize the rows of E and R to have mean 0.
2.1. Canonical correlation analysis
In canonical correlation analysis, we aim to uncover and exploit the correlation between the two data sets that represent the drugs, R and E in our case, by projecting these data sets into a joint space and using the projection for the prediction task. We assume that corresponding vectors in each of the data sets should be highly correlated under some joint representation. Intuitively, our objective is to find two projection matrices,
Formally, the problem is defined as follows:
where Tr (M) is the trace of M. This optimization problem can be reduced to an eigenvector problem: denote CEE = EET, CER = ERT, CRE = RET and CRR = RRT. Consider first the case where each of the projection matrices is a single vector, and define the following optimization problem:
Since the expression to optimize is invariant under scaling of the projections we and wr, one can fix the two terms in the denominator to 1 and optimize the numerator. The resulting Lagrangian is:
Taking derivatives and comparing to zero we find that λ
e
= λ
r
= λ and, consequently, that wr can be expressed as:
and that we is the solution to the generalized eigenproblem:
To solve the original problem (Eq. 1), let
Thus, choosing eigenvectors corresponding to the k largest eigenvalues will maximize the objective of Eq. 1.
It remains to show that this solution respects the optimization constraints. The constraints of the Lagrangian ensure that the entries along main diagonal of
As AAT is symmetric, its eigenvectors {ue,i} are orthogonal, implying that for i ≠ j:
To avoid over-fitting and to account for numerical instabilities, we use a regularized version of CCA (Leurgans et al., 1993). The regularization takes additional regularization factors ηE and ηR, which are used to penalize the norm of the column vectors of WE and WR. Instead of using two regularization factors, we follow Wolf and Donner (2008) and use a single additional regularization parameter, η, and the largest eigenvalues, λE and λR, of EET and RRT, respectively. Thus, in the regularized version of CCA, the terms CEE and CRR in Eq. 2 are replaced with
Finally, we use the projection matrices to compute a score vector for the query drug. To this end, the attribute vector q of the query drug is projected onto the subspace identified by the CCA:
The maximum is achieved when
In general, a pseudoinverse is computed using singular value decomposition, but here we can use the specific structure of WE to compute it more efficiently using matrix multiplication. Formally, using the notation above,
Since
2.2. Diffusion-based prediction
The second algorithm that we use is based on a diffusion process in a side effect similarity matrix, aiming to score side effects so that: (i) prior information is taken into account; and (ii) similar side effects receive similar scores. Such an approach was applied successfully for predicting disease-causing genes (Vanunu and Sharan, 2008).
Formally, given a similarity matrix between side effects (S) and a prior information vector y, we seek a score vector f which satisfies:
where
We build S based on E, by measuring the Jaccard coefficient between the sets of drugs associated with each side effect. Formally, let Γ(s) denote the set of drugs associated with side effect s. Then the similarity between side effects i and j is given by the Jaccard coefficient of their corresponding drug sets:
To account for the different similarity profiles of different side effects, we normalize the similarities by setting
The computation of the prior vector is based on a similarity function between drugs. The latter is computed using R and its specific definition depends on the attribute data at hand (see Section 3.1). Let Dq,d denote the similarity between the query drug q and any other drug d. We apply a nearest neighbor approach, defining the prior value for side effect s as the highest similarity score Dq,d between a drug d and the query, across all drugs associated with s:
In Zhou et al. (2004), it is shown that if the eigenvalues of S are in [−1, 1] (which is the case under our normalization) then f can be computed using an iterative process
which efficiently converges to the analytical solution: f = (I − αS)−1 (1 − α)y.
2.3. Merging score vectors
Invoking the CCA-based prediction and the diffusion-based prediction yields two score vectors. Different strategies for merging these two vectors into a single ranking can be applied. Merging the two score vectors directly is problematic as the scores are not necessarily comparable. We follow ideas from Lin and Hauptmann (2004), who use a logistic function for the merging. The logistic function is a monotonic transformation of the score, thus preserving the relative ranking of each algorithm on the one hand, while rescaling the scores to the same range on the other hand.
Formally, given score vectors s1 and s2, with mean values
where a and b are two free parameters which adjust between the two scoring systems.
2.4. Parameter tuning and performance evaluation
The prediction algorithm has several parameters. Two parameters are used by the CCA algorithm: η, the regularization parameter; and k, the dimension of the subspace to which the data are projected. One parameter is used by the diffusion algorithm: α, the relative weight of the prior term versus the smoothing term. Two final parameters, a and b, control the merging of the two score vectors.
We tune the parameters using grid search in a cross validation setting. Specifically, in each iteration of a 20-fold cross validation, 5% of the drugs serve as a test set and their side effect associations are hidden; 5% additional drugs serve as an internal test set to tune the parameters; the rest 90% of the drugs are used for training. First, the parameters of the two algorithms—η, k, and α—are learned, maximizing the performance of each algorithmic variant separately on the internal test data. Next, the mixing parameters a and b are learned. Finally, the learned parameters are used to evaluate the performance of the algorithm on the test data. We note that in each cross validation iteration, the CCA projection and the side effect similarity network are recomputed.
We measure the quality of the predictions by computing a precision-recall curve for varying numbers of predictions per drug. Given a desired number of predictions, k, we consider the union of the top k ranking predictions for all drugs and compute: (i) precision, the percent of correct predictions; and (ii) recall, the percent of true side effects that were recovered. To summarize the curve we compute the area under it, as well as the area under its leftmost section where the recall is smaller than 0.2. To resolve cases in which several side effects attain the same score, we adjust the ranks of these side effects to be their average (unadjusted) rank.
To assess the significance of the results obtained by the algorithm, we applied it also to randomized instances of the data. The randomization was performed by permuting the columns of the drug-side effect association matrix E, thus randomizing the relations between drugs and their side effect vectors, while preserving the distribution of side effects in the data.
3. Results
3.1. Data retrieval and similarity computations
Drugs and their associated side effects were obtained from SIDER (Kuhn et al., 2010), an online database containing drug–side effect associations extracted from package inserts using text mining methods (Campillos et al., 2008). This data set spans 880 drugs, 1382 side effects, and 61,102 drug–side effect associations. Drugs and side effects vary greatly in their number of associations. Some effects are present in almost all drugs (e.g., dizziness, edema and nausea), while others are associated with very few drugs (e.g., flashbacks, rectal polyp); and similarly for drugs. Thus, we filtered from the association data drugs and side effects that lie at the top 10% (greater than 151 associations for drugs and 127 associations for side effects), as well as side effects and drugs having less than two association. The resulting drug-side effect network contained 692 drugs, 680 side effects, and 12,871 associations. These data were represented in a binary association matrix, E, where Es,d = 1 if and only if drug d is associated with side effect s.
The prediction algorithm can be applied with various drug attribute schemes, drug similarity measures and side effect similarity measures. For drugs, we experimented with two supporting data sets: (i) chemical hashed fingerprints; and (ii) NCI-60 drug response data for the different drugs under different cell lines (Kutalik et al., 2008). For side effects, we based our similarity computation on their sets of associated drugs (see Section 2).
3.1.1. Chemical data–based computation
Structures for the drugs molecules were downloaded from PubChem (Wheeler et al., 2008). Hashed fingerprints based on these chemical structures were computed using the open source Chemistry Development Kit (CDK) (Steinbeck et al., 2003, 2006). The description matrix, R, used by the CCA prediction algorithm, is the matrix whose columns are the hashed fingerprints.
The similarity score between drugs, used by the diffusion algorithm, was calculated according to the Tanimoto 2D score between the two fingerprints, which is equal to their Jaccard coefficient. Formally, let rd denote the hashed fingerprint for drug
3.1.2. Response data–based computation
We downloaded the drug response data used by Kutalik et al. (2008) from http://serverdgm.unil.ch/bergmann/PingPong.html. The data were used to build the description matrix R. An entry in R lists the concentration of a drug that is needed to achieve 50% growth inhibition under a certain cell line (log(GI50)). Missing data were replaced by the mean response to the drug over all cell lines. The similarity score between drugs, used by the diffusion algorithm, was calculated according to the Pearson correlation between the corresponding response profiles.
3.2. Chemical structure–based prediction performance
In our first application of the algorithm we used the drug chemical structure information as supporting data. We tested the algorithm in a 20-fold cross validation setting, where in each cross validation iteration 5% of the data were hidden, serving as a test set, and the other 95% served as a training set. Within the training set, an internal cross validation was conducted to train the parameters of the algorithm as described in Section 2.4.
Overall, for 34.7% (240) of the 692 drugs, the algorithm ranked first one of the known side effects of these drugs. For 63.4% (439) of the drugs, a correct side effect was ranked among the top five scoring side effects. In comparison, when applying our algorithm to randomized instances of these data, for only 68.1 (±7.69, 9.85%) of the drugs, on average, the top ranking side effect matched a known side effect of the drug; and only 225.1 (±12.8, 32.5%) of the drugs, on average, had a known side effect among the top five ranking side effects. These marked differences are also reflected in the areas under the curve: 0.119 on the real data and 0.0524 (±0.0009) at random (Fig. 1 and Table 1).
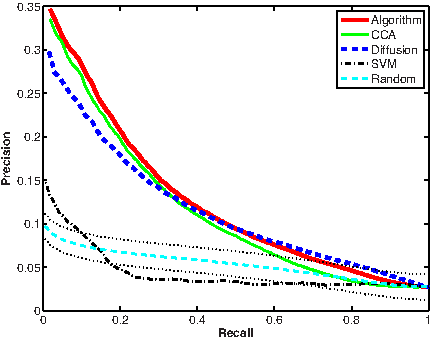
Performance evaluation using chemical structures. Dotted lines depict standard deviation for random curve.
Top1 lists the number of drugs having a known side effect ranked highest. Top5 lists the number of drugs having at least one known side effect among the 5 highest ranking side effects. Area is the total area under the precision-recall curve; Area20 is the area under the leftmost (recall < 0.2) section of the precision-recall curve. The best result in each row appears in bold.
We further compared the performance of the combined algorithm to those of applying the CCA or diffusion-based computations by themselves. As evident from the results in Figure 1 and Table 1, the combined algorithm outperforms the diffusion-based variant and is marginally better than the CCA based variant in all evaluation measures.
3.3. Response-based prediction performance
We additionally applied our algorithm using the drug response data. As the response information was not available for many of the drugs, the application was limited to 58 drugs, spanning 188 side effects. The algorithm ranked one of the known side effects highest for 17 (29%) of the drugs. For 29 (50%) drugs, a correct side effect was ranked among the top five scoring side effects. These results significantly outperformed the random expectation (Table 1). Precision-recall curves for the different algorithmic variants are displayed in Figure 2. As for the chemical structure data, the combined algorithm outperformed diffusion based variant significantly and is marginally better than the CCA variant.
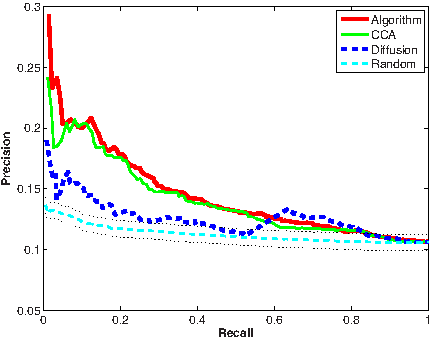
Performance evaluation using response in cell lines. Dotted lines depict standard deviation for random curve.
3.4. A large-scale blind test
To further validate our approach, we downloaded from DrugBank (Wishart et al., 2006, 2008) a compilation of 4,335 drugs that were not available in SIDER. Chemical structures and hashed fingerprints for these new drugs were computed as described in Section 3.1, and side effect rankings were calculated using the combined algorithm.
To evaluate the results of our prediction algorithm, we used the Hazardous Substances Data Bank (HSDB), an online peer-reviewed database focusing on toxicology of potentially hazardous chemicals (Wexler, 2001). For 448 drugs that had matching records in HSDB, the text in the Human Health Effects section was downloaded and a simple textual search scheme was applied to extract annotated side effects. For 102 (22.8%) of the drugs, the side effect that was ranked highest by our algorithm was also associated to the corresponding drug in HSDB (Fig. 3). For 201 (44.9%) of the drugs, one or more of the 5 top scoring side effects were confirmed by HSDB.

A blind test. Percentage of new drugs with validated predictions in HSDB.
3.5. Comparison with independent side effect prediction
We compared our approach, which analyzes side effects jointly, to an approach that considers each side effect separately. For each side effect, we trained a soft margin support vector machine (SVM) classifier, using the hashed chemical fingerprints of drugs as feature vectors. We used the same training/test 20-fold cross validation procedure as in our algorithm to tune the SVM parameter (C, misclassification cost) and evaluated the predictions obtained. For the latter assessment we scored each prediction according to its distance from the best separating hyperplane according to SVM methodology. We then computed precision-recall curves for each classifier. The following results were obtained using a linear kernel SVM, computed using SVMlight (Joachims, 1999). We note that using non-linear kernel (radial basis function kernel) did not change our findings (data not shown).
First we used all the SVM classifiers to generate predictions on the association between all drugs and side effects (Fig. 1). For 102 drugs (14.7%), the SVM classifiers ranked a known side effect highest compared with 240 (34.7%) drugs using the combined algorithm. Additionally, for 292 drugs (42.2%), the SVM classifiers ranked a known side effect among the top five scoring side effects, compared with 439 (63.4%) drugs in the combined algorithm. The difference between the prediction quality was best demonstrated by the area under the curves where the SVM-based predictions resulted in an area of 0.043 compared with 0.119 for the combined algorithm and 0.0524 for the random expectation (see Section 2.4).
The aforementioned comparison might be misleading as the SVM classifiers were trained and optimized for each side effect separately while the other algorithmic variants were trained on the entire dataset. Therefore, we tested the prediction quality of the combined algorithm for each side effect independently. For 516 (75.8%) of the side effects, the area under a precision-recall curve for the combined algorithm was better than that of the respective SVM classifier (Fig. 4). Similar results were obtained by using the maximum F1 measure where the combined algorithm scored highest for 524 (77%) of the side effects.

Performance of the combined and independent side effect analysis, evaluated on each side effect separately. Y-axis: the area under the precision-recall curve. Side effects are sorted according to increasing area under the precision-recall curve as predicted by the combined algorithm.
3.6. Using side effect predictions for drug target elucidation
In a seminal article, Campillos et al. (2008) have shown that drugs with similar side effects are likely to share molecular targets. Exploiting this correlation, they were able to predict new targets for drugs. However, their analysis was limited to drugs with known side effects. Our method has the potential to overcome this limitation as long as some molecular data is available on the drug in question.
To demonstrate the utility of our method in drug target elucidation, we applied it to predict the side effects of 4,335 drugs from DrugBank that do not have side effect information in SIDER. We then computed the correlation between two drug similarity matrices: one that is based on comparing the top k predicted side effects (via a Jaccard coefficient) and another that is based on comparing known drug targets (via a Jaccard coefficient). The Pearson correlation between the two similarity matrices varied for varying k, reaching a peak of 0.084 for k = 13 (Fig. 5). This correlation was significantly higher than the random expectation (shuffling the drug-target associations while maintaining the same number of associated targets per drug). Expectedly, the correlation was lower than that observed for the drugs whose side effects are known (from SIDER).

Correlations of side-effect-based and target-based similarities.
4. Conclusion
Our contribution in this article is fourfold: (i) We show that computational prediction of side effects of drugs is possible. We present an approach that combines correlation based analysis with network diffusion, achieving very high retrieval accuracy. In cross validation, we are able to accurately predict side effects for up to two thirds of the drugs; in a blind test, we are able to confirm our predictions for almost half of the drugs. (ii) We demonstrate the use of different data sets, such as chemical structure and cell line response, for the prediction task. The use of different data sets could potentially increase the sensitivity and specificity of the predictions. (iii) We find a significant correlation between the similarity of the predicted side effects of drugs and their targets, indicating the potential utility of our algorithm in drug target identification. (iv) We show that analyzing multiple side effects together improves on a simple approach that considers each side effect independently.
Several extensions of our work are possible. The CCA algorithm that we presented is limited to the analysis of one descriptive data set at a time. It is possible that using generalized canonical correlation analysis one could extend the method to take into account multiple data sets. The descriptive data used came from two sources: chemical structure information and cell line response data. Other sources of descriptive data could be used, most notably gene expression data in response to drug treatment such as those cataloged by the Connectivity Map project (Lamb et al., 2006).
In summary, we believe that our algorithm constitutes an important step toward shortcutting the process of side effect identification in the development of new drugs.
Footnotes
Acknowledgments
N.A. is partially funded by the Edmond J. Safra Bioinformatics program. R.S. was supported by the Israel Science Foundation (grant 385/06).
Disclosure Statement
No competing financial interests exist.