
Abstract
Abstract
Metagenomic data enables the study of microbes and viruses through their DNA as retrieved directly from the environment in which they live. Functional analysis of metagenomes explores the abundance of gene families, pathways, and systems, rather than their taxonomy. Through such analysis, researchers are able to identify those functional capabilities most important to organisms in the examined environment. Recently, a statistical framework for the functional analysis of metagenomes was described that focuses on gene families. Here we describe two pathway level computational models for functional analysis that take into account important, yet unaddressed issues such as pathway size, gene length, and overlap in gene content among pathways. We test our models over carefully designed simulated data and propose novel approaches for performance evaluation. Our models significantly improve over the current approach with respect to pathway ranking and the computations of relative abundance of pathways in environments.
1. Introduction
Analysis of metagenomic data poses analytical challenges resulting from the short length of DNA reads of which the data consists. Traditional Sanger sequencing generates reads of average length 900bps; newer high-throughput sequencers produce reads of even shorter lengths ranging from less than 100bps (e.g., the Illumina Solexa and ABI SOLiD sequencers) to 500bps (the 454 Life Sciences sequencer). Even with recent and expected advances in sequencing technology, read length is likely to remain a major issue in metagenomics analysis that will require novel computational methods that are different from those used for the analysis of complete genomes. Such methods have been emerging in an increasing rate lately, including methods and strategies for assembly, gene calling, community structure prediction, and more (Raes et al., 2007).
The functional analysis of metagenomes aims to identify those functional capabilities most significant to organisms living in the environment under study. Usually, analysis is done either at the single gene level, focusing on the abundance of gene families, or at the pathway level in which the occurrence of genes in pathways is taken into account. These processes start by identifying genes in the data and predicting their function, where function prediction is done by aligning the data against function-oriented databases. Such databases include COG (Tatusov et al., 2003), Pfam (Finn et al., 2006), and TIGRFAM (Haft et al., 2003) for gene level analysis, and KEGG (Kanehisa and Goto, 2000), MetaCyc (Caspi et al., 2008, 2010), or SEED (Overbeek et al., 2005) for systems or pathway level analysis
1
. For each function, the function prediction process generates its read count, i.e., the number of reads associated with the function in the metagenome. Once determined, read counts can be used for computing the relative abundance of each function in the metagenome. Previous works ignored issues related to gene length and the minimum portion of a gene required in order to identify it (DeLong et al., 2006; Markowitz et al., 2006; Rodriguez-Brito et al., 2006)) and estimated the relative abundance of each function f, both at the gene family and pathway levels, as the relative abundance of its read count from all functions in the function database F:
We refer to this as the read count approach. It is straightforward when complete genomes are considered and the relative abundance of functions is computed based on gene count, namely the number of genes associated with the different functions. However, it results in inherently biased estimates when read counts are considered, due to the fact that longer genes are expected to have a higher read count simply due to their length. This problem is addressed in a recently published work (Sharon et al., 2009b) that presents a statistical framework for the functional analysis at the gene family level. The model presented in that article is based on the assumption that the number of reads beginning at each position across any genome is Poisson-distributed (Lander and Waterman, 1988). While this framework fits gene families, it may not be suitable as it is for functional analysis at the pathway level, most notably due to the presence of the same genes in several pathways.
Functional analysis at the pathway level is mainly used for two purposes: computation of pathway relative abundance, and pathway content comparison. Computing relative abundance of pathways within a single sample provides an overall view of the environment and was used in many studies and platforms (Dinsdale et al., 2008; Edwards et al., 2006; Overbeek et al., 2005; Rodriguez-Brito et al., 2006). Comparing pathways' abundance between samples makes it possible to identify pathways that are enriched within one of the environments with respect to the other (DeLong et al., 2006; Edwards et al., 2006). Derivatives of pathway content comparison may be used for clustering functionally similar environments using metrics over pathway abundances vectors (DeLong et al., 2006; Feingersch et al., 2010).
Pathway reconstruction is a related problem in which the most likely set of pathways in a genome or a metagenome is determined, without estimating their abundance. A commonly used naive approach to this problem would be to collect all pathways with at least one representative in the data. However, this approach is expected to yield an inflated list of pathways. Recently, a method called MinPath was described that attempts to deduce the minimal set of pathways required for supporting an observed set of functions (Ye and Doak, 2009). The method uses Integer Programming for deciding whether a pathway is present, based on the observed functions. Note that in this case the relative abundance of the different functions is not taken into account, and no estimation of the relative abundance of the different pathways is done.
Here, we present two models for the functional analysis of metagenomes at the pathway level. Both models ignore pathway topology and treat pathways as gene sets. We begin with a short description of the model described in Sharon et al. (2009b) and deduce the independent pathways model that can be regarded as a natural extension of the previous work. Next, we present the pathway intersection model that takes into account the co-occurrences of genes in more than one pathway. We test both models on synthetic data and compare the results to the currently used read-count approach. Our tests focus on the above-mentioned two common functional analysis tasks, namely sample comparison and the computation of relative abundance of pathways in the environment.
2. Methods
2.1. The Poisson model for computing gene family abundance
A metagenome M is a set of R sequence reads of length r each, extracted randomly with uniform probability for all positions across all genomes from some DNA sample of size L bps. A gene family G represents a set of functionally similar genes, which can be defined, for example, via sequence similarity. COG, Pfam, and other databases are often used as references for the identification of gene families in metagenomic data. We denote a collection of gene families by DGENE; the association between M's reads and gene families is defined in terms of the read count, RG, representing the number of reads (out of R) carrying a detectable portion of G's member. Assuming that the abundance of a gene family G∈DGENE in the DNA pool is CG (i.e., the DNA sample has CG copies of genes that are members in G), the read count, RG, is Poisson distributed with mean λG (Sharon et al., 2009b):
where
In this formula, R/L is the rate of read starts per base pair. The term (r + LG − 2T) reflects the average number of starting positions for reads carrying a detectable portion of a single copy of G, where LG is the average length of G's members, T is the minimum portion of a gene required to be present on a read in order to be associated with its family, and r is the read length.
An estimator for a gene read count,
All parameters in this formula are known, except for L, and hence an explicit calculation of gene family abundance is impossible. In previous work (Sharon et al., 2009b), the above formula was used to compute frequency estimators for gene families, which is the relative abundance of a certain gene family out of the total abundance of all gene families in the DNA sample pool (which eliminates the dependency on L) 2 . In this article, we resolve the problem of the unknown DNA sample length L by computing the abundance of a gene family per organism in the sample, instead of the absolute abundance. This requires an estimation of the average genome length in the DNA sample, as shown next.
2.2. Estimating the average genome length in the DNA sample
The estimation of the average length of a genome is based on the known existence of a group of genes that are known to be present exactly once per genome in all bacterial species. Several known single-copy genes, such as bacterial rpoB, recA, and gyrA, were used as both phylogenetic markers (Mollet et al., 1997; Venter et al., 2004), as well as for the normalization of the abundance of genes in metagenomic samples (Howard et al., 2006; Loy et al., 2009; Rusch et al., 2007; Venter et al., 2004; Yutin et al., 2007). Notably, several other approaches enable to estimate the average genome length without relying on single copy genes, either experimentally (Grossart et al., 2000) or computationally (Angly et al., 2009).
In the case of a single-copy gene SCG, the number of copies in the entire DNA sample, CSCG, is equal to the number of organisms in the sample, N0; hence, it is possible to deduce an MLE for the average genome length based on Equation 4:
A more accurate estimation of the average genome length is achieved by averaging the estimated values for several single copy genes.
Utilizing the estimated average genome length, based on Equation 4, the abundance of a gene family G per organism in the DNA sample can be calculated as following:
2.3. Computing pathway abundance: the independent pathways model
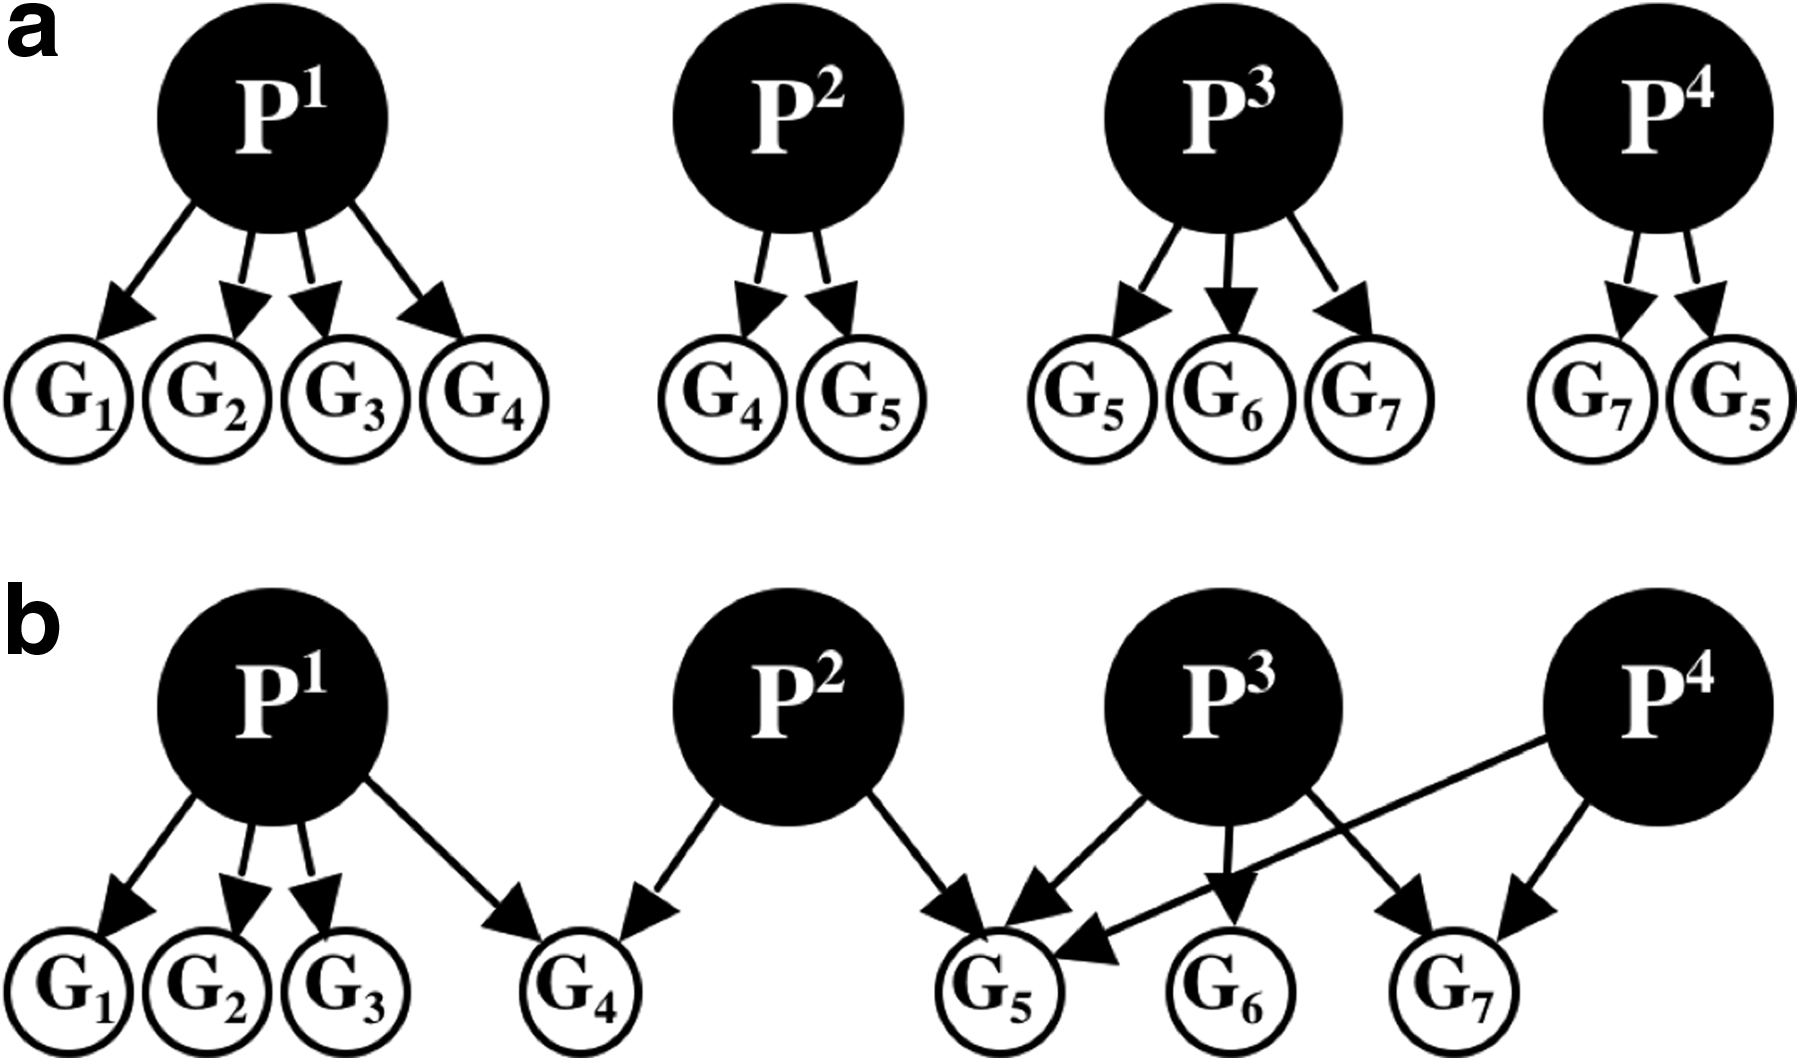
In the context of the current analysis, a pathway P is defined as a set of gene families
The independent pathways model assumes that all gene families within a certain pathway, P, have the same number of occurrences (i.e.,
Note that it is also possible to express the relative abundance of a pathway with respect to all other pathways in a sample by dividing WP by the sum of Wi for all Pi∈DPATH. In this case, the estimation for the average genome length (L/N0) is eliminated.
2.4. Computing pathway abundance: the pathways intersection model
Pathways—being a descriptive tool—are not necessarily disjoint modules, but rather they share common proteins. Ignoring the overlap in gene family content between pathways may lead the method of Section 2.3 to overestimate the abundance of pathways that share proteins with other pathways. Here, we describe a second model that accounts for non-empty pathway intersections by jointly computing the abundance of all pathways within a collection of pathways.
The pathways intersection model assumes that a given pathway Y is either present or absent in an organism in the sample, where the presence of the pathway entails the presence of all of its member gene families in the organism. We denote by WY the random Boolean variable that represents the presence of a pathway Y in an organism. The probability that a gene family G is present in the genome of the organism is given by:
The abundance of G in the sample, CG, is deduced by multiplying this probability by the number of organisms in the sample, N0. Consequently the read count, RG, is Poisson distributed with the following mean:
This can be computed for various estimates of the W variables, using the estimated average of the genome lengths in the sample (see Section 2.2).
Using the observed number of reads,
2.5. Materials
In order to test both our models, we have generated five synthetic metagenomes based on simulated organisms, with different community complexities and metagenome sizes.
2.6. Evaluation of the different methods
where N is the total number of pathways and n = m is the prefix size. The significance of the observed k is given by the Hyper-Geometric Tail (HGT):
In addition to the above, we have also used the Pearson correlation coefficient for evaluating the degree of agreement between the lists of true and estimated frequencies.
3. Results
To evaluate the performance of our methods in predicting pathway abundances, we generated synthetic metagenome data with various community complexities and sizes (see Section 2.5; Table 1). Our tests focus on two of the most interesting tasks in the context of metagenomics: (i) comparing pathways' abundance between samples and (ii) computing relative abundance of pathways within a single sample. As a baseline, we compared the performance of our methods to that of a standard read-count approach, estimating the relative abundance of each pathway as the relative abundance of its read counts out of the total number of read counts in all considered pathways (Equation 1).
To evaluate the performance of the various prediction methods on the task of function comparison, we compared all pairs of metagenomes and evaluated the resulting lists (Fig. 2; also see Fig. 5 in the Appendix). The pathway intersection model showed superior performance over the other models in six out of 10 scenarios (Fig. 2a). The independent pathways model performed slightly better than the read-count model in most cases. The relatively low improvement in performance in this task is somewhat expected, since our models aim to correct biases in the estimation of pathway abundances introduced by differences in pathway size and gene lengths, while these biases are largely eliminated when comparing the same pathway over two samples.

Agreement between true and estimated lists of most differentially enriched pathways in selected pairs of metagenomes. For each m ≤ 100 (x-axis), the y-axis shows the number of pathways (normalized by m) that are ranked as being among the m most differentially enriched pathways between two simulated metagenomes, by both the true ranking and the predicted ranking by the various prediction methods. Results for differently enriched pathways between metagenomes M1 and M5
Since the original aim of the read-count method was to address the above task of computing changes in gene set abundances across metagenomes, it is not suitable for computing the relative abundance of pathways in a sample as it does not account for differences in pathway sizes (an inherent factor for this task). Therefore, as a baseline to assessing the performance of our methods here, we implemented a fourth method, the normalized read-count, that is based on read-counts but also account for pathway sizes. The relative abundance of a pathway in this method is given by:
To evaluate the performance of the various methods in predicting the relative abundance of pathways across a single sample, we tested the agreement between the rankings of pathways based on their true abundances and predicted abundances by the various methods (Fig. 3; also see Fig. 6 in the Appendix). Quite expectedly, the performance of the read-count method is significantly worse than that of the other methods. A significant improvement is achieved by the normalized read-counts, taking into account pathway sizes. An additional marked improvement is achieved by the independent pathway model, accounting for variation in gene lengths. The performance of the pathway intersection method is inferior to that of the independent pathways method when ranking sets of highly abundant pathways. On the other hand, the performance of the pathway intersection method is superior to all other methods when considering pathways with lower abundances.
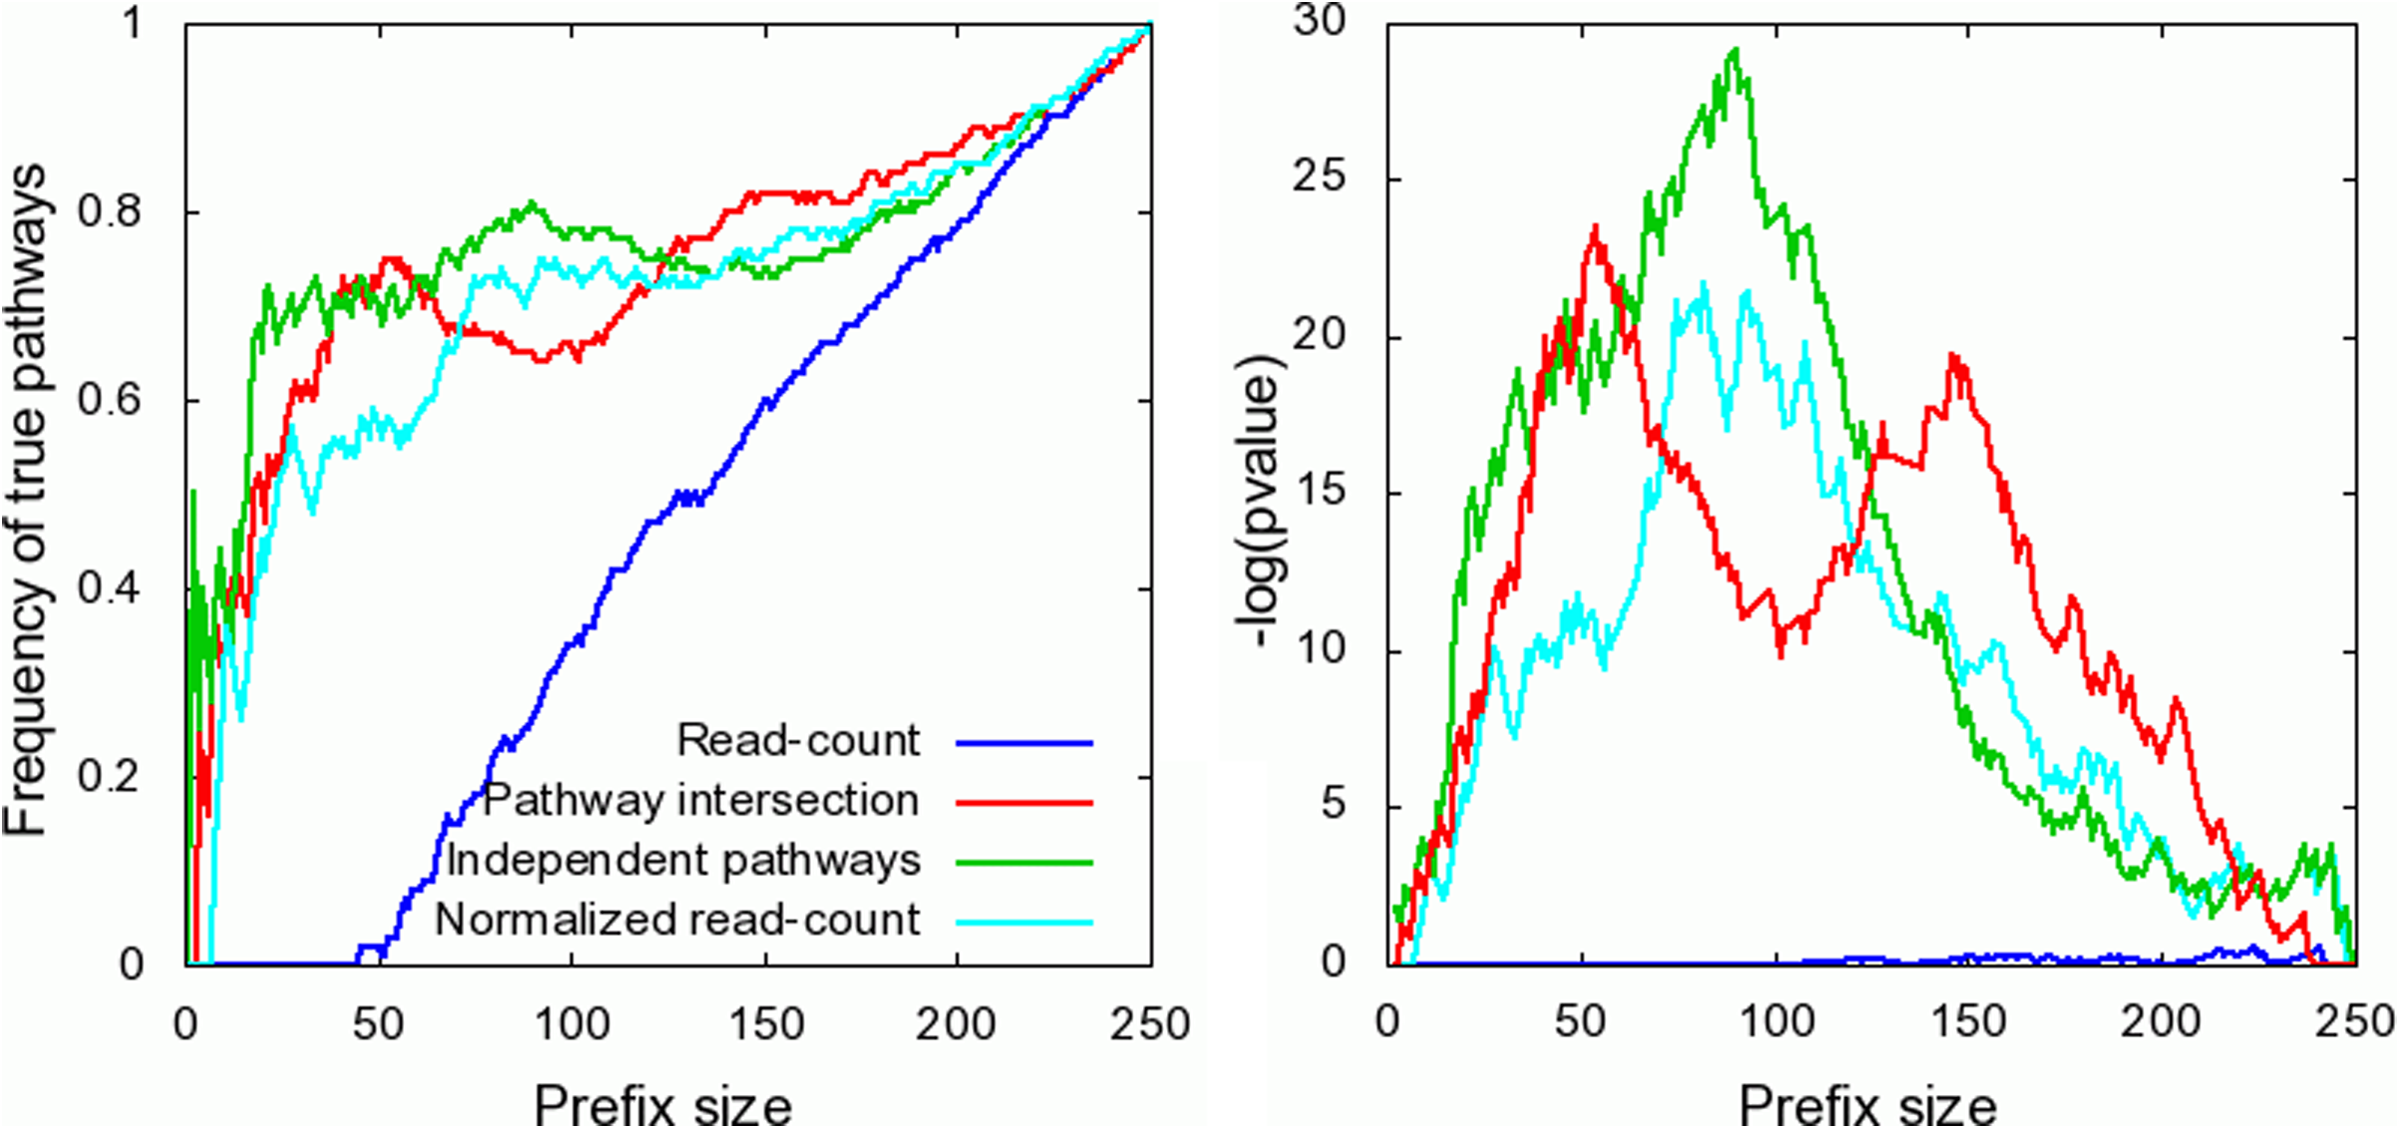
Ranking pathways based on their enrichment in metagenome M3.
To further evaluate the performance of the various methods in predicting relative abundance of pathways across a single sample, we computed the Pearson correlation coefficient between the true and predicted relative abundances (Fig. 4a). Consistent with its poor performance in the ranking test, the read-counts method shows no correlation with the true pathway abundances across all metagenomes. The independent pathways and the pathway intersection methods perform better than or equal to the normalized read counts method in all cases. In particular, the pathway intersection method outperforms the other approaches when lowly abundant pathways are considered (Fig. 4b), as also shown above in the ranking tests. The success of the pathway intersection method on rare (or missing) pathways may be due to the fact that it does not do multiple counting of a gene common to several pathways while the other methods do. Frequencies assigned by the other models will be higher than the true frequencies; while this also happens with abundant pathways, its influence on rare pathways is much higher. The independent pathways model does not suffer from this bias.
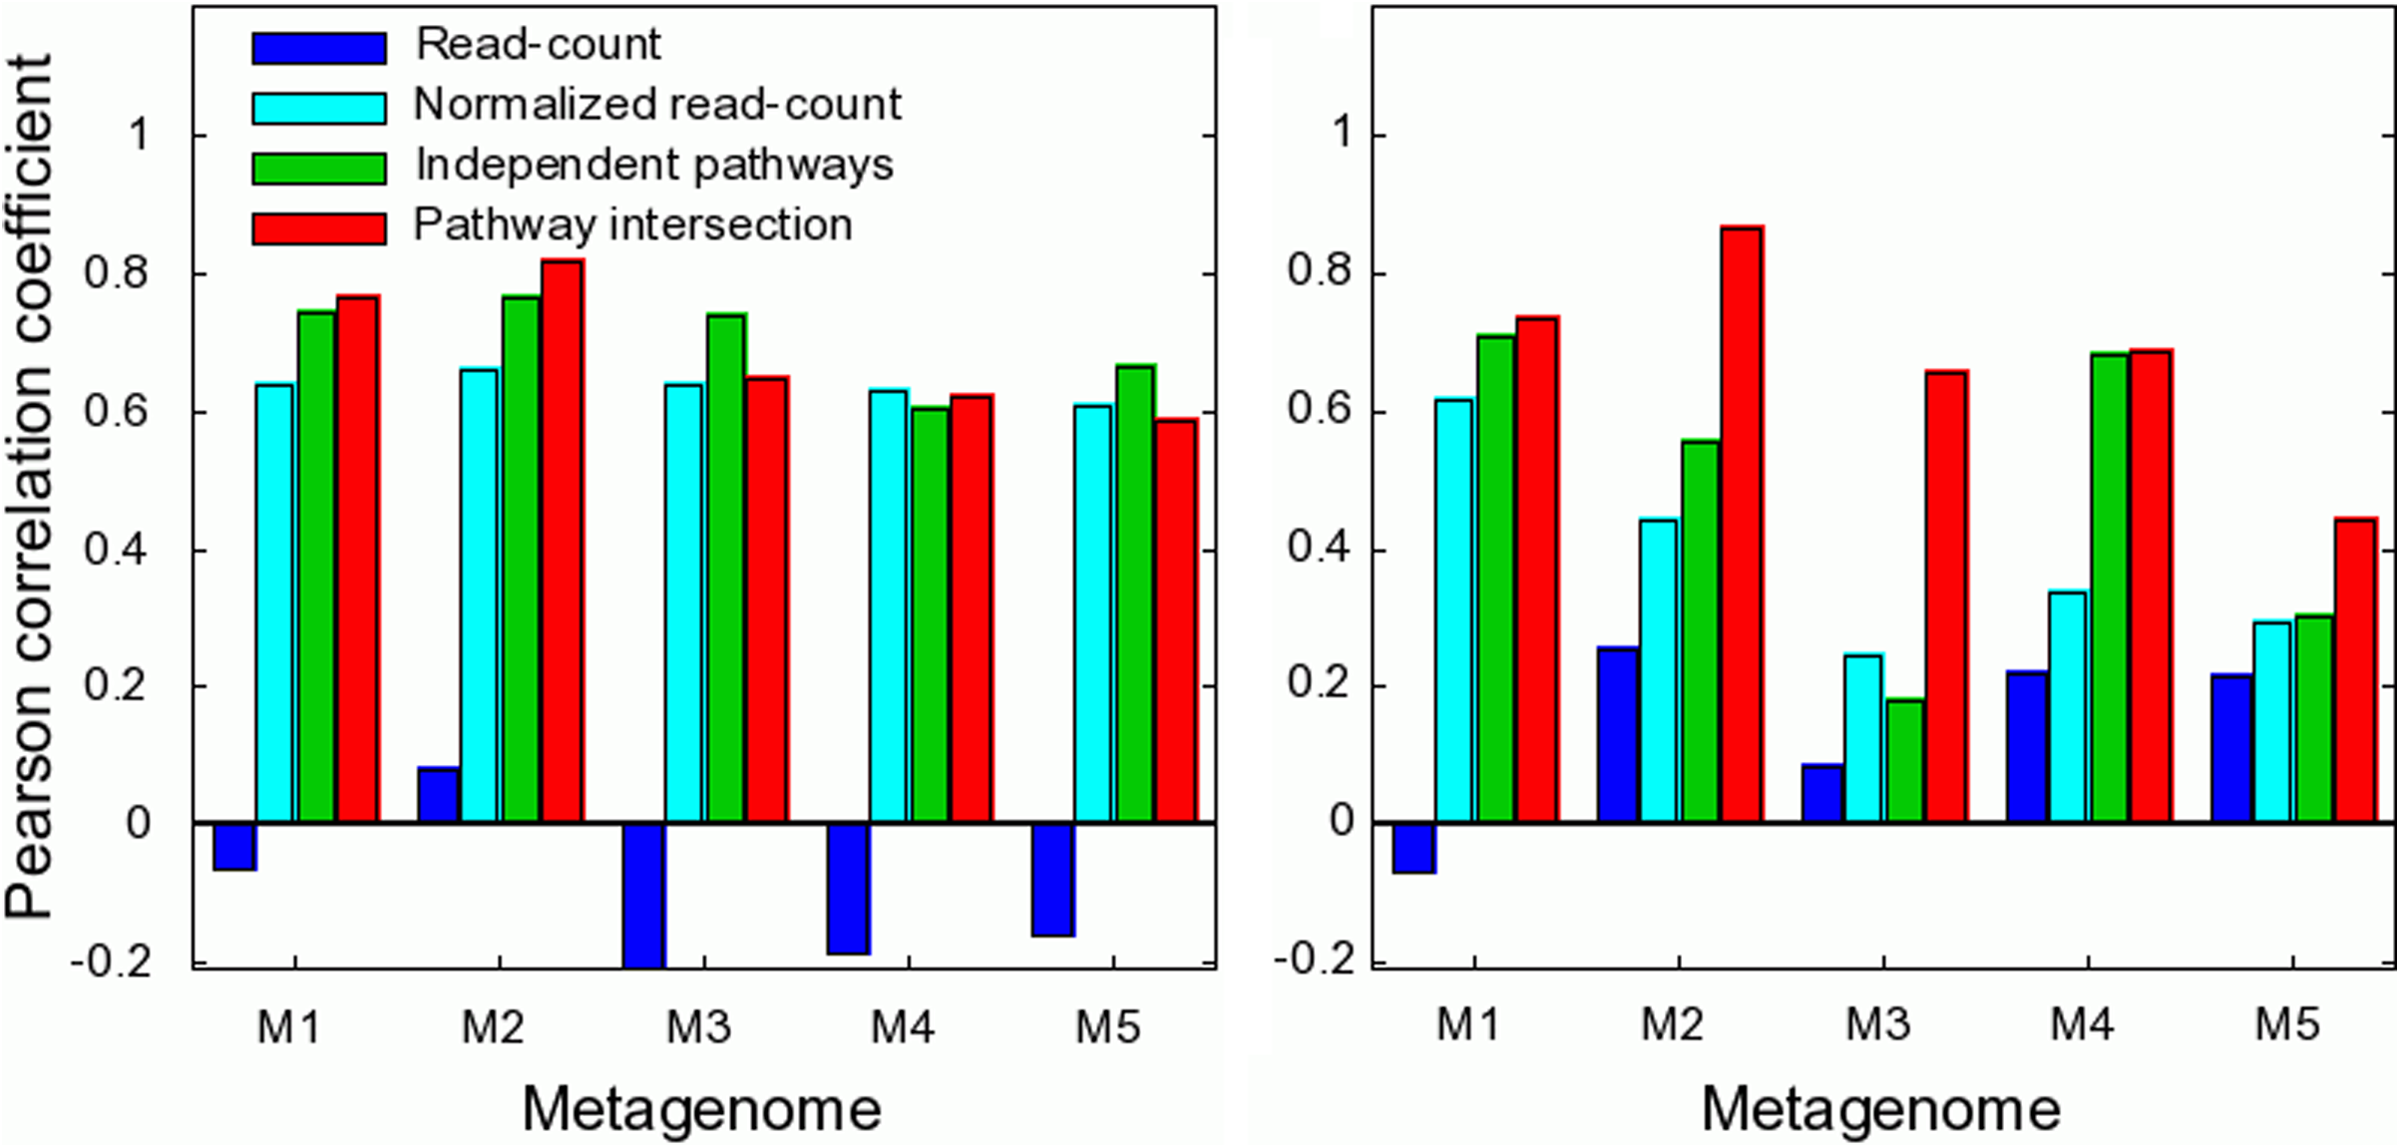
Pearson correlation between predicted and true pathway abundances across the various metagenomes. Correlations obtained for the entire set of 250 pathways used in the simulation
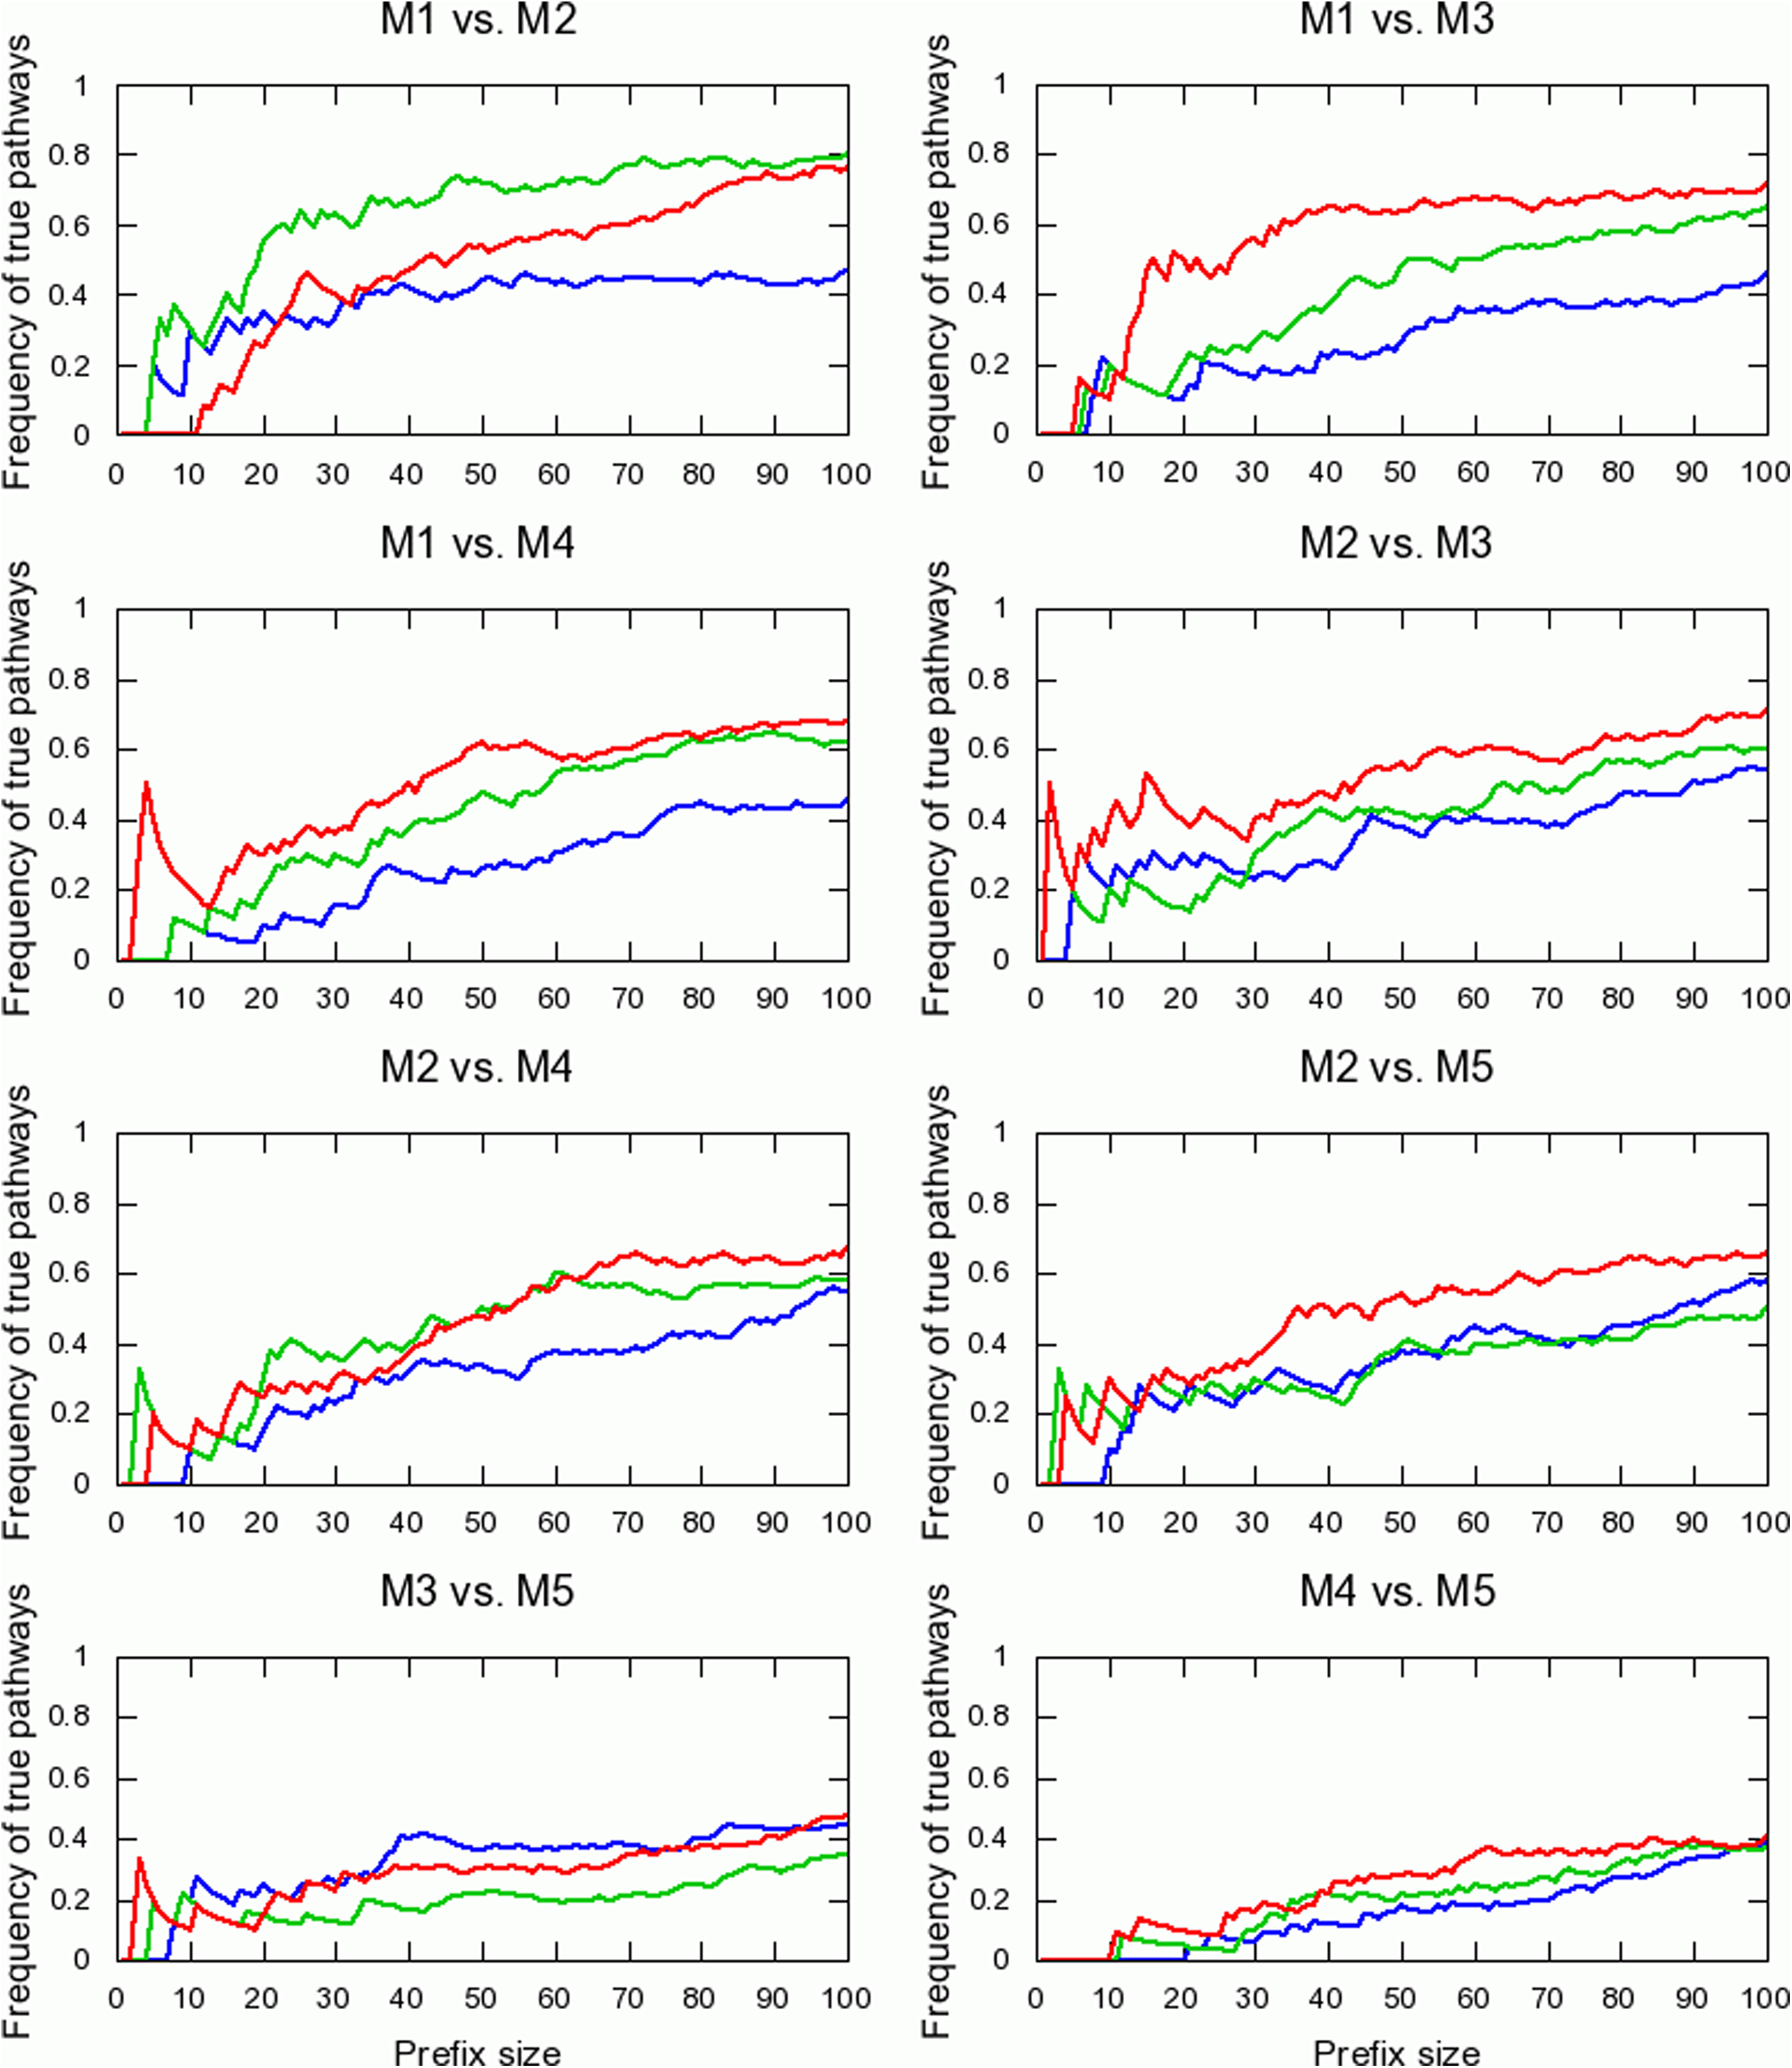
Agreement between true and estimated lists of most differentially enriched pathways in pairs of metagenomes. Refer to the legend of Figure 2 for description. Read count (blue), independent pathways (green), and pathway intersection (red) models are compared.
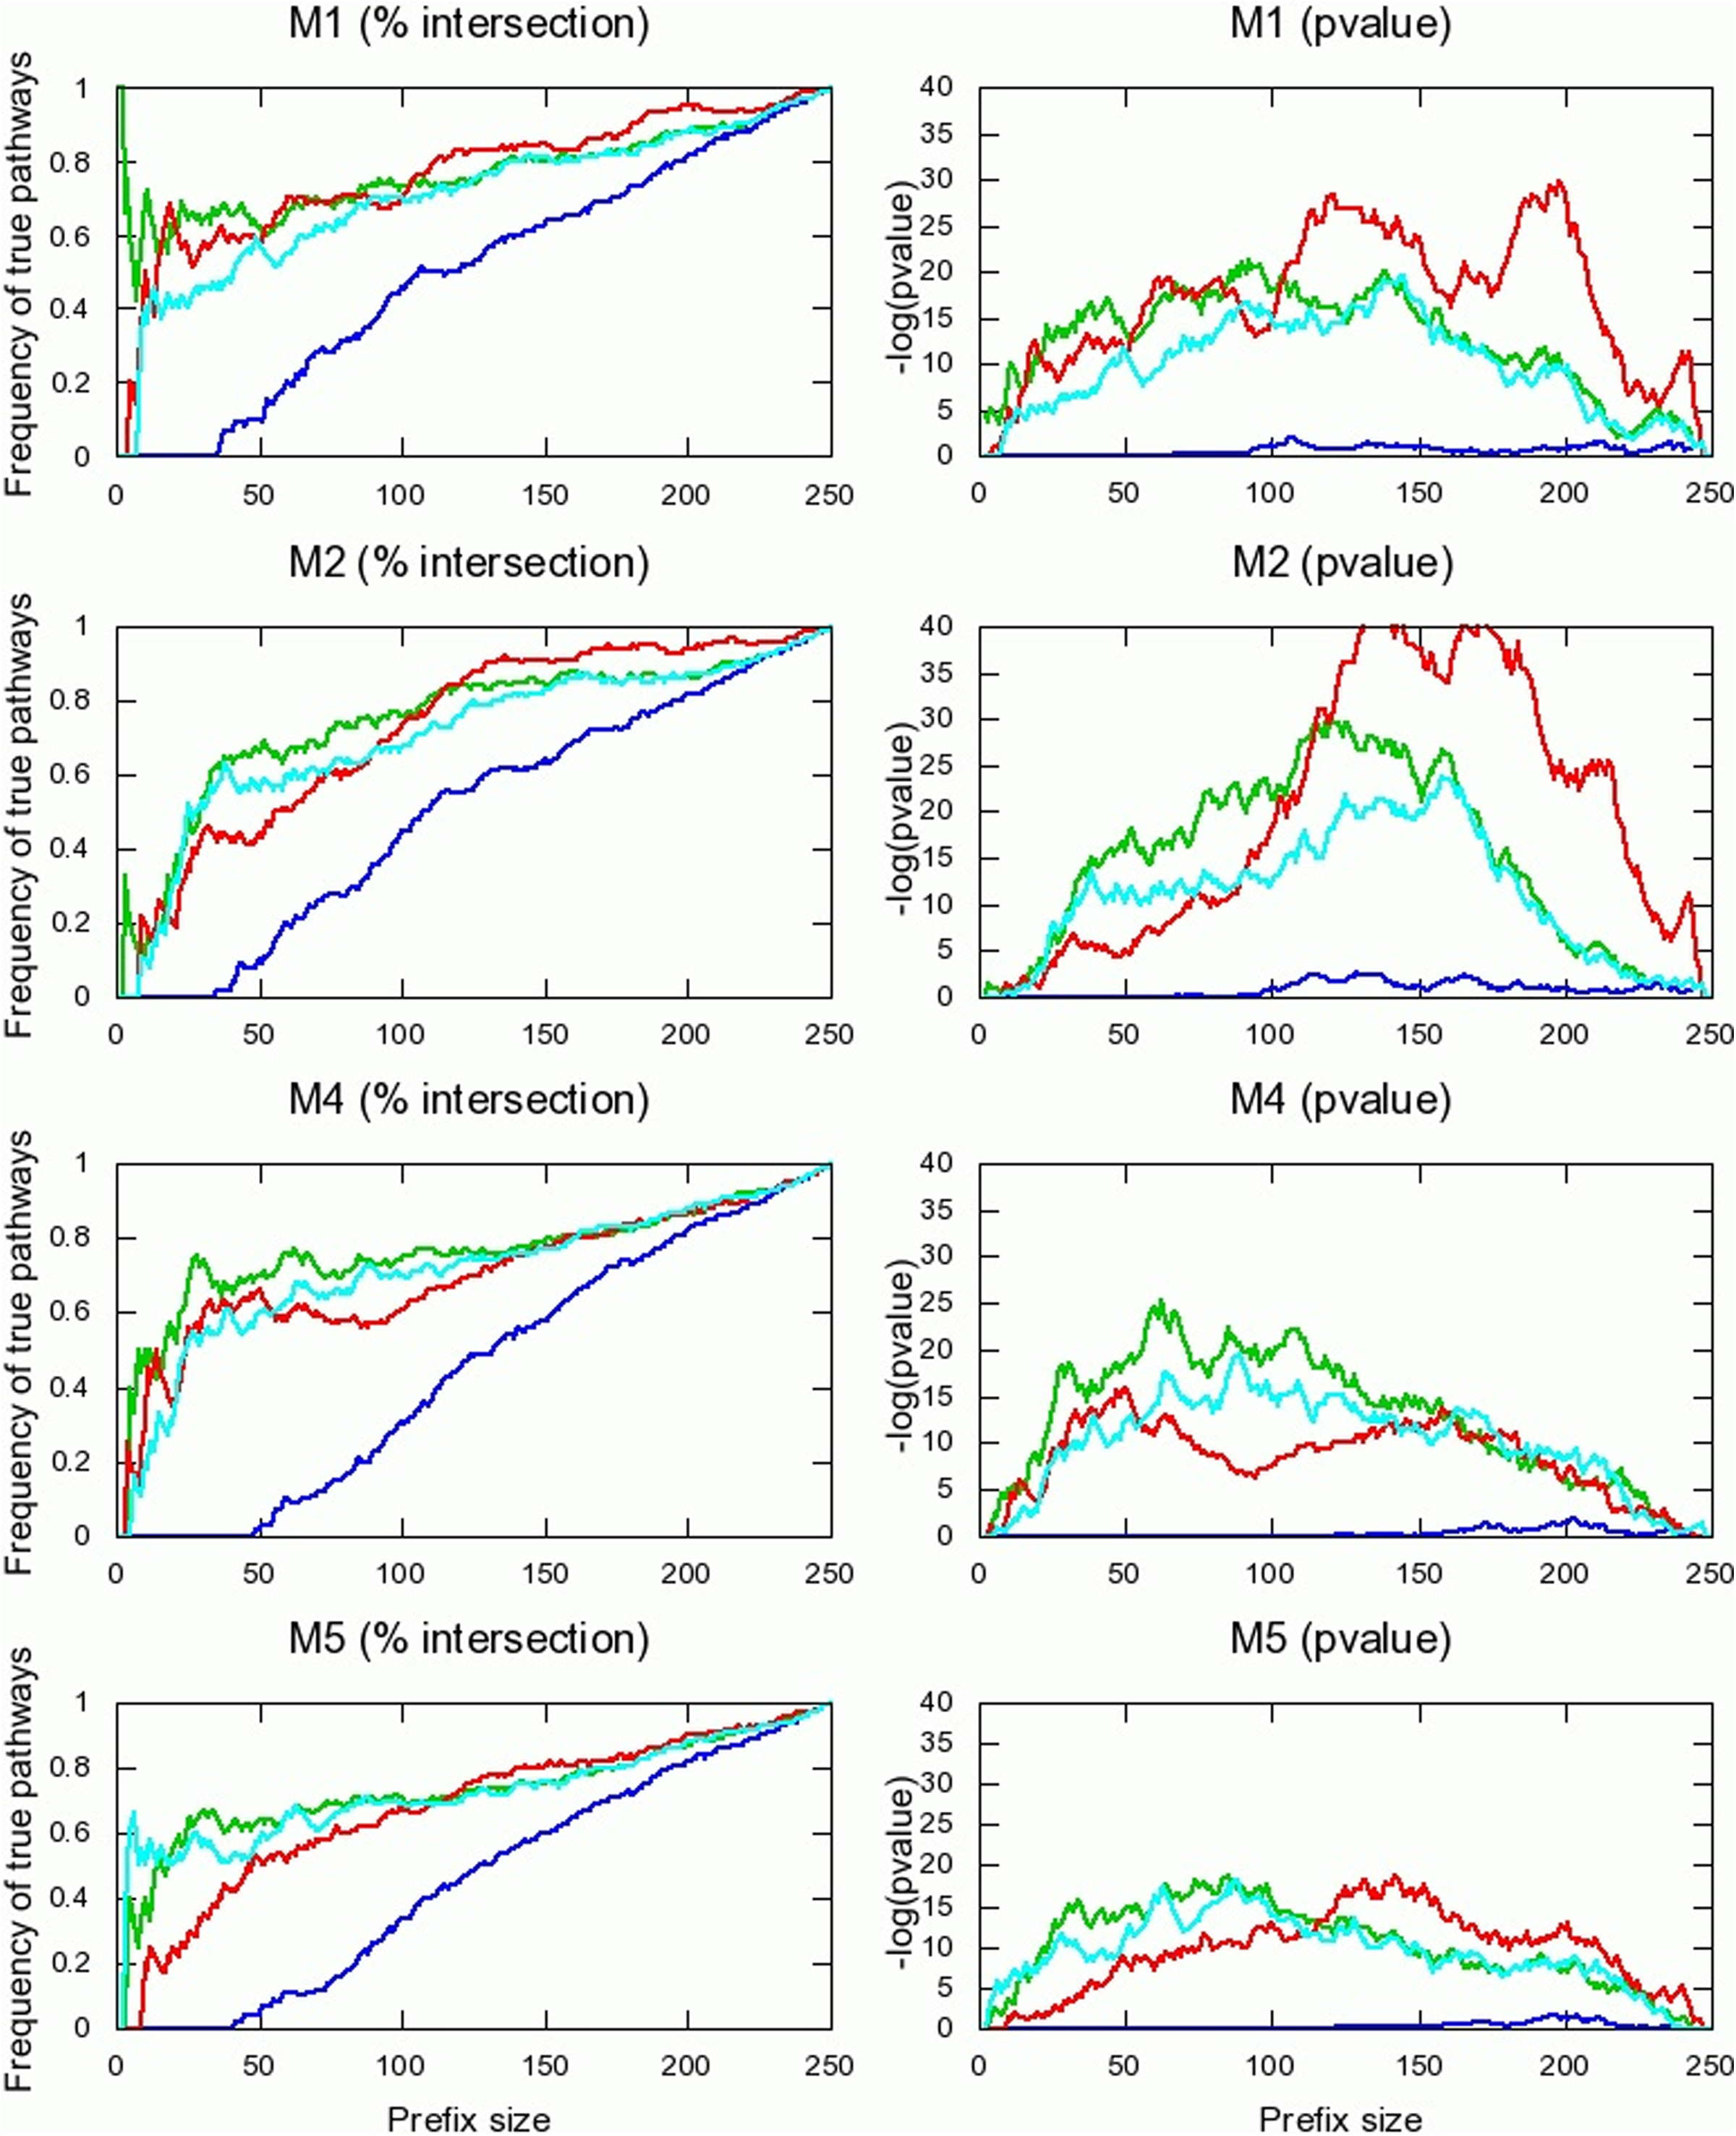
Ranking pathways based on their abundances in metagenomes M1, M2, M4, and M5. Refer to the legend of Figure 3 for description. Read count (blue), normalized read-count (cyan), independent pathways (green), and pathway intersection (red) models are compared.
4. Conclusion
In this work, we have proposed two models for functional analysis of metagenomes at the pathway (systems) level reflecting two different assumptions regarding the sharing of genes among pathways. The two models eliminate biases resulting from variations in number of genes across pathways and also biases resulting from variation in genes' lengths (Sharon et al., 2009b). Our methods performed much better with respect to predicting relative abundance of pathways. Each of our two methods was shown to have its own strength: the pathway intersection method outperforms the other approaches in predicting pathway abundances when focusing on lowly abundant pathways; the independent pathways method is superior in ranking pathway abundances for highly abundant pathways. Both our methods performed only slightly better than the read-count method when used for functional comparison, despite the failure of the later in the second task of predicting the absolute frequencies of the different pathways. One possible explanation for this behavior is that frequency estimation biases of specific pathways tend to be similar in both compared datasets and thus cancel each other when computing the relative abundances. For example, the relative abundance of a gene family or a pathway whose members are relatively long is likely to be overestimated by the read-count method in both samples. Such mutual compensation does not hold in the general case, suggesting that a more robust method is in place.
The pathway intersection method relies on the availability of single copy genes that are present in the vast majority of species in the studied environment. Single copy genes were used in the past as phylogenetic markers (Yooseph et al., 2007) and for estimating gene abundance (Loy et al., 2009; Rusch et al., 2007; Yutin et al., 2007). There are several families of single copy genes that are known to be present across all known bacterial species, but these families are not present in Archaea and Eukaryotes. Hence, the pathway intersection method is more appropriate for environments in which the vast majority of sampled microbes are bacteria such as marine environments, but is likely to yield skewed frequencies when applied to environments in which either Archaeal or Eukaryotic species are abundant (such as acid mine drainage).
Functional characterization of metagenomic data such as that discussed in this study depends, first and foremost, on the quality of the employed pathway annotation data. Specifically, all pathway analysis methods rely on the basic assumption that a pathway is a coherent functional module that is either entirely present or absent in an organism. However, pathways defined in databases such as KEGG and MetaCyc do not fully address this requirement and, in many cases, have only a fraction of their genes actually present in many species. Future advances in pathways curation are expected to significantly improve the outcome of the presented methods.
To our knowledge, this is the first time in which the issue of functional analysis at the pathway level of metagenomic data was studied in depth, providing further means for the exploration of metagenomes and their functions via environment-based comparative analysis.
5. Appendix
Footnotes
Acknowledgments
S.B. is grateful to the Azrieli Foundation for the award of an Azrieli Fellowship.
Disclosure Statement
No competing financial interests exist.
1
The SEED database is commonly used for functional analysis that is defined in terms of subsystems rather than pathways. However, since our models treat pathways as gene sets and do not consider issues such as pathway topology and products, the theory described in this paper is also applicable to databases such as SEED.
2
Note that λG in [18] refers to the expected number of clone inserts whose two sides are sequenced. Here reads are assumed to be independent of each other, the adjustment to pair-end sequencing should be straightforward.